/
Alcohol use and binge drinking among Hispanic/Latino subcul Alcohol use and binge drinking among Hispanic/Latino subcul

Alcohol use and binge drinking among Hispanic/Latino subcul - PowerPoint Presentation

karlyn-bohler
karlyn-bohler . @karlyn-bohler
Follow
457 views
Uploaded On 2015-10-27

Alcohol use and binge drinking among Hispanic/Latino subcul - PPT Presentation

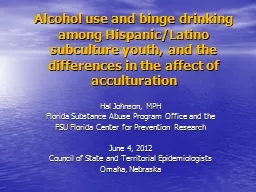
Hal Johnson MPH Florida Substance Abuse Program Office and the FSU Florida Center for Prevention Research June 4 2012 Council of State and Territorial Epidemiologists Omaha Nebraska Background ID: 173947

hispanic youth florida acculturation youth hispanic acculturation florida binge american language drinking spoken differences substance survey population abuse spanish

Share:

Link:

Embed:

Download Presentation from below link

Download Presentation The PPT/PDF document "Alcohol use and binge drinking among His..." is the property of its rightful owner. Permission is granted to download and print the materials on this web site for personal, non-commercial use only, and to display it on your personal computer provided you do not modify the materials and that you retain all copyright notices contained in the materials. By downloading content from our website, you accept the terms of this agreement.


Presentation Transcript

Slide1

Alcohol use and binge drinking among Hispanic/Latino subculture youth, and the differences in the affect of acculturation

Hal Johnson, MPH

Florida Substance Abuse Program Office and the

FSU Florida Center for Prevention Research

June 4, 2012

Council of State and Territorial Epidemiologists

Omaha, NebraskaSlide2

BackgroundRisky behaviors vary among different races/ethnicitiesHispanic ethnicity is a growing portion of the US population

Many programs/interventions have been developed to reduce risky behaviors, including underage drinking, among Hispanic youth.Slide3

BackgroundHowever, most of these programs don’t distinguish between Hispanic subcultures

Spanish, Mexican, Puerto Rican, Central American and other Hispanic cultures, while sharing some aspects, are different

Examining differences between these subcultures in the US is challenging for several reasonsSlide4

BackgroundChallenges

Immigration patterns - limited diversity of Hispanic subcultures in most areas

Underage drinking – limited age range means limited population

Few databases include information on ethnicity at a level lower than “Hispanic”Slide5

Florida Youth Substance Abuse Survey

Annually since 2000

Even years – County level (~60,000)

Odd years – State level (~8,000)

Grades 6 through 12

Based on Communities That Care SurveySlide6

Florida Youth Substance Abuse Survey

How do you describe yourself? (You can choose one answer, or more than one)

American Indian/Native American or Alaska Native

Asian

Black/African American

Spanish/Hispanic/Latino

Native Hawaiian or other Pacific Islander

White/Caucasian

OtherSlide7

Florida Youth Substance Abuse Survey

Which one of these ethnic groups BEST describes you? (Choose only one answer)

Central American (Guatemalan, Nicaraguan, Honduran, for example)

Cuban or Cuban American

Dominican

Mexican or Mexican American

Puerto Rican

Other Hispanic, Latino or Spanish origin

Haitian

West Indian or Caribbean

None of theseSlide8

Florida Youth Substance Abuse SurveyConsistent differences by race/ethnicity

Whites use at the highest rate

Black youth use at lowest rate

Hispanic youth use at a slightly lower rate than non-Hispanic Whites

Similar results from other school based surveys such as Monitoring the FutureSlide9

Florida Youth Substance Abuse SurveySlide10

Florida Youth Substance Abuse SurveySlide11

Hispanic Youth Population Trend

* Source: Florida Office of Economic and Demographic Research (Age 10-17)Slide12

Florida youth Ethnicity (FYSAS)Slide13

Hispanic Subcultures among Florida youth (FYSAS)Slide14

Data ConsiderationsUse even year data

Exclude 2000

Changes made in race/ethnic variables

Compare each year for variations

Combine years

Weight to adjust for sample sizeSlide15

Population Proportion Across YearsSlide16

Combined Dataset Ethnicities


Hispanic

Non-Hispanic

Total N


2002

10,467

52,467

62,934


2004

12,140

48,205

60,345


2006

12,684

43,668

56,352


2008

20,343

70,351

90,694


2010

16,563

56,234

72,797 Combined72,197270,925343,122      Slide17

Past-30-day Alcohol UseSlide18

Binge DrinkingSlide19

Odds Ratios

Reference Group:

Non-Hispanic White

Control Variables:

Age

Gender

Mother’s education

Father’s educationSlide20

Acculturation

“Acculturation … is now commonly viewed as a multidimensional process in which one maintains aspects of their culture of origin while also adopting elements of the new cultural group.”

Coatsworth

and Maldonado-Molina. J Community Psychol. 2005. 33(2).Slide21

AcculturationAcculturation has been implicated as a risk factor for substance use and other unhealthy behaviors

1990 to 2000 Hispanic Population Growth*

50% increase in # American-born Hispanics

81% increase in # born in other countries

In 2000, 40% of all Hispanics and 54% of southern US Hispanics were foreign born*

*Saenz, R. www2.asanet.org/public/saenz_brief.pptSlide22

AcculturationLength of time in the US related to less acculturationLanguage spoken at home is reasonable proxy for length of time in US and acculturation

FYSAS has one question on language spoken at homeSlide23

AcculturationFYSAS question:

What is the language you use most often at home?

English

Spanish

Another LanguageSlide24

Language Spoken at HomeSlide25

Past-30-day Use and Binge Drinking by Language Spoken at Home – All Hispanic YouthSlide26

Odds Ratios – Language Spoken at Home

OR Group:

Speak Spanish at Home

Reference Group:

Speak English at Home

Control Variables:

Age

Gender

Mother’s education

Father’s educationSlide27

Past-30-Day Alcohol Use by Language Spoken at HomeSlide28

Binge Drinking by Language Spoken at HomeSlide29

Odds Ratios – Language Spoken at Home

OR Group:

Speak Spanish at Home

Reference Group:

Speak English at Home

Control Variables:

Age

Gender

Mother’s education

Father’s educationSlide30

SummaryAll Hispanic youth in Florida drink and binge drink at a rate between NH-Whites and NH-Blacks

But there are differences among the Hispanic subcultures

Central American youth less likely to drink or binge than others

“Other Hispanic” youth more likely to drink or binge than others

Mexican youth more likely to binge than othersSlide31

SummaryHispanics speaking Spanish at home less likely to report past-30-day use, but not binge drinking

Subculture differences:

Cuban, Mexican and Puerto Rican youth show past-30-day acculturation affect

Central American and Mexican youth show binge drinking acculturation affect

No other significant differencesSlide32

ConclusionsFYSAS provides an excellent opportunity to investigate AOD use and other risky behavior among Hispanic subpopulations

Large and growing Hispanic youth population

More diverse Hispanic population than most states

Annual youth survey with large N and useful ethnicity and acculturation questionsSlide33

Conclusions

Hispanic youth are not homogeneous

There are differences in alcohol use and binge drinking among subcultures

There are differences in the affect of acculturation on likelihood to drink or binge drink

Taking subculture into account can add to the effectiveness of targeted prevention programs