/
+ assists countries worldwide in the collection and use of data to mon + assists countries worldwide in the collection and use of data to mon

+ assists countries worldwide in the collection and use of data to mon - PDF document

karlyn-bohler
karlyn-bohler . @karlyn-bohler
Follow
384 views
Uploaded On 2016-04-28

+ assists countries worldwide in the collection and use of data to mon - PPT Presentation

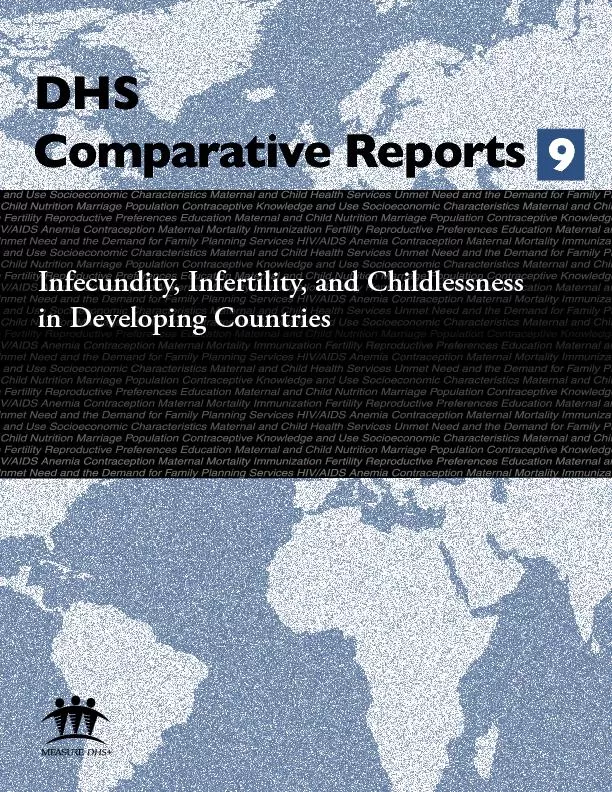
Shea O Rutstein Calverton Maryland USA Iqbal H Shah World Health Organization Geneva Switzerland World Health Organization This report presents the results of a collaborative effort between t ID: 296507

Shea Rutstein Calverton Maryland

Share:

Link:

Embed:

Download Presentation from below link

Download Pdf The PPT/PDF document "+ assists countries worldwide in the col..." is the property of its rightful owner. Permission is granted to download and print the materials on this web site for personal, non-commercial use only, and to display it on your personal computer provided you do not modify the materials and that you retain all copyright notices contained in the materials. By downloading content from our website, you accept the terms of this agreement.


Presentation Transcript

+ assists countries worldwide in the collection and use of data to monitor and evaluate population, health, and nutrition programs. Funded by the U.S. Agency for ent (USAID), MEASURE + is implemented by ORC Macro in Calverton, Maryland. The opinions expressed herein are those of the authors and do not necessarily reflect the views of the U.S. Agency for International Development. The main objectives of the MEASURE + project are: 1) to provide decisionmakers in survey countries with information useful for informed policy choices, 2) to expand the international population and health database, 3) to advance survey methodology, and 4) to develop in participating countries the skills and resources necessary to conduct high-quality demographic and health surveys. Information about the MEASURE + project is available on the Internet at http://www.measuredhs.com or by contacting: 11785 Beltsville Drive Calverton, MD 20705 USA Telephone: 301-572-0200 Fax: 301-572-0999 E-mail: reports@orcmacro.com Shea O. Rutstein Calverton, Maryland, USA Iqbal H. Shah World Health Organization Geneva, Switzerland World Health Organization This report presents the results of a collaborative effort between the MEASURE DHSand the UNDP/UNFPA/WHO/World Bank Special Programme of Research, Development and Research Training in Human Reproduction. ORC Macro in Calverton, Maryland, USA, imple-ments the MEASURE DHS+ project with funding from the U.S. Agency for International De-velopment. The Special Programme is a part of the Department of Reproductive Health and Re-search of the World Health Organization in Geneva, Switzerland. Editor: Sidney Moore Series design: Katherine Senzee Report production: Justine Faulkenburg Rutstein, Shea O. and Iqbal H. Shah. 2004. Infecundity, Infertility, and Childlessness in Developing DHS Comparative Reports No. 9. Calverton, Maryland, USA: ORC Macro and the World Health Organization. Contents iiiTables and Figures v Preface ix Acknowledgements xi Executive Summary xiii 1 Introduction 12 Definitions and Measurement Problems 33 Data and Methodology 54 Results 94.14.1.1Fertile Pregnancies 114.1.2Discussion 114.2Primary Infertility 124.2.1Sexual Experience 124.2.2Pregnancy among Sexually Experienced Women 144.2.3 Births among Sexually Experienced Women 144.2.4Observed Primary Infecundity 174.2.5Women Who Do Not Want Children 174.2.6 Self-reported Infecundity 194.3Secondary Sterility 224.3.1 Prevalence of Secondary Infecundity 224.3.2Estimates of the Number of Infertile Women in Developing Countries 245 Trends in Infertility 275.1Trends in No Surviving Children and No Live Birth Based on Data Sets 20 Years Apart 27 5.2Trends in Primary Infertility Based on DHS Data from Two or More Surveys 31 5.3Trends in Secondary Infertility 416 Consequences of Infertility 437 Coping with Infertility through Adoption 518 Conclusions 53References 55 Tables and Figures Table 1 Characteristics of surveys included in the report 6Table 2 Childlessness and infertility among women age 40-44 and 25-49 10Table 3 Primary infertility (1): No sex 13Table 4 Primary infertility (2): Sex but no pregnancy 15Table 5 Primary infertility (3): Sex but no birth 16Table 6 Women who do not want children 18Table 7 Self-reported infecundity 20Table 8 Secondary infecundity 23Table 9 Regional estimates of childlessness, primary infertility, and secondary infertility 25Table 10 Trends in the proportion of women who have never had sex 33Table 11 Trends in the proportion of currently married women who have no living children and who have had no fertile pregnancies 37Table 12 Divorce and separation by childlessness and sterility status 44Table 13 Primary sterility among never-married women 45Table 14 Remarriage by childlessness and sterility status 47Table 15 Polygynous first union by childlessness and primary sterility 48Table 16 Monogamous first union by childlessness and sterility status 49Table 17 Adoption of children by childlessness and sterility status 52 Tables and Figures Figure 1 Percentage of women who reported themselves infecund, by age group and region, DHS surveys 1994-2000 21Figure 2 Percentage of women age 25-49 with secondary infecundity, by region, DHS surveys 1994-2000 24Figure 3 Percentage of currently married women age 40-44 who have been married for at least five years but have no living children, WFS and DHS surveys 1975-2000 28Figure 4 Percentage of currently married women age 40-44 who have been married for at least five years but have not had a live birth, WFS and DHS surveys 1975-2000 29Figure 5 Percentage of currently married women age 25-49 who have been married for at least five years but have no living children, WFS and DHS surveys 1975-2000 30Figure 6 Percentage of currently married women age 25-49 who have been married for at least five years but have not had a live birth, WFS and DHS surveys 1975-2000 31Figure 7 Changes in the percentage of women age 25-49 who have never had sex, most recent DHS survey compared with previous DHS survey 32Figure 8 Changes in the percentage of women age 25-49 who have had sex but have not been pregnant, most recent DHS survey compared with previous DHS survey 34Figure 9 Changes in the percentage of women age 25-49 who have had sex but have not had a live birth, most recent DHS survey compared with previous DHS survey 35Figure 10 Changes in the percentage of women age 25-49 who have been married for the past five years but have had no live births, most recent DHS survey compared with previous DHS survey 36Figure 11 Changes in the percentage of women age 25-49 who have been married for the past five years but have no living children, most recent DHS survey compared with previous DHS survey 38Figure 12 Changes in the percentage of women age 40-44 who have been married for the past five years but have had no live births, most recent DHS survey compared with previous DHS survey 39 Tables and Figures viiFigure 13 Changes in the percentage of women age 40-44 who have been married for the past five years but have no living children, most recent DHS survey compared with previous DHS survey 40Figure 14 Changes in the percentage of noncontracepting, sexually experienced women age 15-49 who have been married for the past five years but have had no live births or pregancies, most recent DHS survey compared with previous DHS survey 41Figure 15 Changes in the percentage of currently married noncontracepting women who have had no live births or pregnancies in the past five years, most recent DHS survey compared with previous DHS survey 42 Preface One of the most significant contributions of the MEASURE DHS+ program is the creation of an internationally comparable body of data on the demographic and health characteristics of populations in developing countries. The DHS Comparative series examines these data across countries in a comparative framework. The Analytical Studies series focuses on specific topics. The principal objectives of both series are to provide information for policy formulation at the international level and to examine individual country results in an international context. Whereas parative Reports are primarily descriptive, Analytical Studies take a more analytical ap-Comparative Reports series covers a variable number of countries, depending on the availability of data sets. Where possible, data from previous DHS surveys are used to evaluate trends over time. Each report provides detailed tables and graphs organized by region. Survey-related issues such as questionnaire comparability, survey procedures, data quality, and methodological approaches are addressed as needed. The topics covered in Comparative Reports are selected by MEASURE staff in conjunction with the MEASURE Scientific Advisory Committee and USAID. Some reports are updates and expansions of reports published previously. It is anticipated that the availability of comparable information for a large number of developing countries will enhance the understanding of important issues in the fields of international population and health by analysts and policymakers. Project Director Acknowledgements The authors would like to express their appreciation to Elisabeth Åhman, Paul F.A. Van Look, Sidney Moore, and Justine Faulkenburg for reviewing and editing the manuscript. All remaining errors are the responsibility of the authors alone. Executive Summary The inability to bear children is a tragedy for many couples, bringing a sense of loss, failure, and exclusion. Infertility also has important demographic and health implica-tions. This study utilizes data from 47 Demographic and Health Surveys in develop-ing countries to examine levels, trends, and differentials in women’s inability to bear children. Five principal measures were used in the analysis on infertility: childless-ness, primary and secondary infertility, self-reported infecundity, and indications of secondary infecundity. In addition, levels of sexual experience, pregnancy, and live births were measured. Overall, by age 45 to 49, only 3 percent of sexually experienced women have not had a birth. Countries with more than 5 percent of sexually experi-enced women age 45 to 49 without a birth include the Central African Republic, Cameroon, Mozambique, Niger, Haiti, Colombia, and Brazil. Some women do not desire to have children. For women with no living children and whose ideal is to have no children, the countries with the highest percentages are Brazil, Ethiopia, Bolivia, Colombia, Turkey, and Nicaragua (4 to 6 percent). Self-reports of infecundity include women who say they have never menstruated, women who have not menstruated for five or more years, women who are postmeno-pausal, and women who have had a hysterectomy. Seventeen percent of women age 15 to 49 report themselves as infecund. Secondary sterility is the inability to have fur-ther children after a woman has given birth to one or more children. Its measurement is complicated by the use of contraception. In this study, a woman is considered sec-ondarily sterile if she has not had a child in the past five years, although she was con-tinuously married and did not use contraception during that period. Secondary steril-ity is most common in sub-Saharan Africa. For women age 25 to 49, all eight countries except one (Cambodia) with more than 30 percent of women secondarily sterile are in sub-Saharan Africa. The study estimates that in 2002, more than 186 million ever-married women of reproductive age (15 to 49) in the developing countries (excluding China) were infer-tile because of primary or secondary infertility. This number represents more than one-fourth of the ever-married women of reproductive age in these countries. How-ever, using comparable data, the study shows that infertility, both primary and secon-dary, has declined in most countries. There is no obvious pattern to changes in the levels of infertility in the countries most affected by HIV. Finally, the study examines some of the consequences and coping mechanisms of couples affected by infertility. Women who have never had a child are more likely to be divorced or separated, and childless women are more likely to have been married more than once. Adoption is an important means of coping with childlessness, and childless women are 15 percent more likely to live in households with adopted chil-dren than are women with children of their own. In five West African countries, more than half of childless couples live in households with adopted children. Introduction Introduction or many couples, the inability to bear children is a tragedy. The conflux of per-sonal, interpersonal, social, and religious expectations brings a sense of failure, loss, and exclusion to those who are infertile. Relationships between couples can be-come very strained when children are not forthcoming. One partner may seek to blame the other as being defective or unwilling. Socially, most sociespecially in the developing countries, such that children are necessary for care and maintenance of older parents. Even in developed countries with social support sys-tems, children and family are expected to provide much of the care for the elderly. Childless couples are also excluded from taking leading roles in important family functions and events such as birthdays, christenings, confirmations, bar mitzvahs, and weddings of their children. Moreover, many religions assign important ceremonial tasks to the couple’s children. The incidence of infertility in a population has important demographic and health implications as well. Because high infertility has a dampening effect on overall fertil-ity and the rate of population growth, improvements in the ability to bear children may impede efforts to lower the fertility rate. For example, it has been estimated that a reduction in infertility in sub-Saharan Africa to “normal” levels would increase fer-tility in that region by 15 percent (Frank, 1983). Similarly, Bongaarts, Frank, and Lesthaeghe (1984) found that infertility accounts for 60 percent of the variation in total fertility in 18 sub-Saharan countries and that fertility decreases by one birth for each increase in 9 percentage points in the proportion of women age 45 to 49 who have no children. In Cameroon, a country with an unusually high level of infertility, Larsen and Menken estimated that the then current total fertility rate of 5.5 children would rise to 7.3 in the absence of sterility (Larsen and Menken, 1989). Reports from Demographic and Health Surveys (DHS) data have provided up-to-date measurements of levels and trends in fertility in conjunction with data on impor-tant fertility determinants, such as first marriage and union, first birth, cobreastfeeding, and infant and child mortality. Outside of sub-Saharan Africa, no ma-jor attention has been paid to the DHS data relating to infecundity, although there is no doubt that infecundity is also an important determinant of fertility there. in a population has and health implications. urement Problems Definitions and Measurement Problems he terms infertility, sterility, and infecundity are often used loosely, without re-gard to precise definition. Moreover, definitions of these terms may differ sub-stantially between demographic and medical usage and between languages. In Eng-lish demographic terminology, primary infertility (also called primary sterility) is de-fined as the inability to bear any children, either due to the inability to conceive or the inability to carry a pregnancy to a live birth. In medical studies, however, infertil-ity is usually defined only as the inability to conceive. In English demographic lan-guage, the term “infecundity” refers to the inability to conceive after several years of exposure to the risk of pregnancy. Inability to conceive within two years of exposure to pregnancy is the epidemiological definition recommended by the World Health Organization (WHO, 1975; WHO, 2001). Clinical studies often use a one-year pe-riod of exposure. It is common in demographic studies to use a period of five years. The term “infecundity” is sometimes preferred to “infertility” because in English demographic language, “fertility” is the term used to describe the quantity of off-spring rather than the physiological ability to reproduce. Both terms will be used in-terchangeably in this report. Secondary infertility, which has been shown to have a high geographical correla-tion with primary infertility (Mammo and Morgan, 1986), is the inability to bear a child after having an earlier birth. There are practical measurement problems no matter which definition is used. It is difficult to measure continuous exposure to the risk of pregnancy over a period of years. A comprehensive measure of exposure requires data on marital status, absti-nence, coital frequency and timing, contraceptive use, and the partner’s presence or absence for all women for the entire period under consideration. Some but not all of these data are provided by the DHS reproductive calendar. However, the calendar has been used only in DHS surveys of countries with high contraceptive prevalence. Infertility measured on the basis of currently married women may underestimate infecundity if couples who are unable to have children are more likely to dissolve their marriage or union than are couples with children (see Mtimavalye and Belsey, 1987; Sherris and Fox, 1983). However, in countries where there is a high rate of remar-riage, Vaessen (1984) states that there would not be a strong bias.Use of contraception complicates the estimation of infertility and infecundity. On the one hand, if couples are using contraception, then the lack of fertility and concep-tion is explained. On the other hand, more fertile couples are more likely to use con-traception than are less fertile couples. Including couples who have used contracep-tion during the measurement period, with the assumption that all such couples are fecund, biases infertility estimates downward because there is probably some degree The percentage of women of reproductive age (15 to 49) at risk of pregnancy (not pregnant, sexually active, noncontracepting, and nonlactating) who report The authors believe there still may be such a bias even where the rate of remarriage is high. Use of contraception and infecundity. Definitions and Measurement Problems of infertility among them, although it may be lower than for couples who have not used contraception. Excluding couples who used contraception biases infertility esti-mates upward because the most fecund are likely to be excluded. These biases become important when use of contraception is substantial, especially if use of sterilization is Other biases arise because women who have borne a child during the period of measurement may have subsequently become infecund or because women who have not borne a child during that period may have had an unreported miscarriage or an temporarily separated from their partner, been ill, failed to report contraceptive use, or stopped having intercourse (Vaessen, 1984). One of the more serious problems with infertility measures that are based on the fertility of cou-ples at the end of the childbearing period is that these measures do not reflect recent trends in infertility. Moreover, most sample surveys include a relatively small number of women over age 40 and, therefore, high sampling errors result. Larsen and Men-ken (1989) have identified two further problems with some of the infecundity meas-ures that were used in the World Fertility Survey: The ages to which the measures refer are not specified, and the sensitivity of the estimators to different age patterns of sterility is not tested. Larsen and Menken (1989) propose a new measure of subsequent infertility that can be calculated from incomplete birth histories and that yields information on current infecundity. This measure cannot be used to analyze DHS data because it is appropriate only for countries with negligible contraceptive Data and Methodology 5 3 he data for this report come from 47 surveys conducted in developing countries under the Demographic and Health Surveys (DHS) program. These surveys were the latest available in each of the countries at the time of tabulation of the data in this report. Fieldwork in these surveys took place between 1995 and 2000. This report extends similar work for 29 DHS surveys in sub-Saharan Africa by Larsen and Raggers (2001) but uses differing measures of infertility. The surveys interviewed women between the ages of 15 and 49 and are nationally and subnationally representative. Relative to infertility, women are asked about each one of their live births, their past and current use of contraception, their marital status, and their breastfeeding and abstinence from sexual relations, as well as a host of other reproductive health and background information. In 15 of the surveys, in-formation is available from a month-to-month reproductive calendar. The calendar was used principally in countries with high contraceptive prevalence. The reproduc-tive calendar collected information on birth dates, pregnancies, non-live-birth preg-nancy terminations, use of contraceptive methods, and periods when the woman was in a marital union (including informal consensual unions). The surveys examined in this report and the number of women in each survey are shown in Table 1. The re-port includes data from more than 495,000 women. Several different measures of infertility are used in this report. The definition of the measures depends on whether the reproductive calendar was used in the survey. Unless otherwise indicated, the term “married” includes formal and informal consen-sual unions. In surveys with reproductive calendars, women are considered to have been married for the past five years if they were continuously married (or in a consen-sual union) for each of the 60 months before the date of interview or for the length of time for which the calendar has information, whichever is shorter. In surveys without reproductive calendars, women are considered to have been married for the past five years if they are currently married and their first marriage occurred five or more years before the interview. An alternative would be to consider only women who have had one marriage. This restriction was thought to be too strict because older women may have been married for at least five years in second or subsequent marriages. The use of contraception also varies according to whether a reproductive calendar was used. In surveys with a calendar, nonuse of contraception refers to no current use and no use during the past 60 months or the length of time covered by the calendar, whichever is shorter. In surveys without a calendar, nonuse refers to never having used contraception. definition of measures of infertility depends on reproductive calendar was used in the survey. 6Data and Methodology Table 1 Characteristics of surveys included in the report Region and Country Survey date Number of respondents Type of respondent reproductive calendar Sub-Saharan Africa Benin 5,491 All women No Burkina Faso 1998/99 6,445 All women No Cameroon 5,501 All women No Central African Republic 1994/95 5,884 All women No Chad 7,454 All women No Comoros 3,050 All women No Côte dIvoire 1998/99 8,099 All women No 5,054 All women No 4,843 All women No Guinea 6,753 All women No Kenya 7,881 All women Yes Madagascar 7,060 All women No 13,220 All women No 9,704 All women No Mozambique 8,779 All women No 7,577 All women No 8,206 All women No Senegal 8,593 All women No 4,029 All women No Togo 8,569 All women No Uganda 7,070 All women No 8,021 All women No Zimbabwe 5,907 All women Yes North Africa/West Asia 14,779 Ever married 5,548 Ever married 4,753 All women Yes 8,576 Ever married 10,414 Ever married Central Asia/South and Southeast Asia Bangladesh 8,982 Ever married Cambodia 15,351 All women No 90,303 Ever married Indonesia 28,810 Ever married Kazakhstan 4,800 All women No Kyrgyz Republic 1997 3,848 All women No 8,429 Ever married Philippines 13,983 All women Yes Turkmenistan 7,919 All women No Uzbekistan 4,415 All women No 5,664 All women Yes Latin America/Caribbean Bolivia 11,817 All women No 12,612 All women Yes Colombia 11,585 All women Yes Dominican Republic 1996 8,422 All women Yes Guatemala 6,021 All women Yes 5,356 All women No Nicaragua 13,634 All women No 27,843 All women Yes 497,054 In the measures described below, the definitions refer to surveys with calendars. The alternate definitions for marriage and contraception, as given above, are used for surveys without calendars. Although the difference in these definitions means that the measures are not totally comparable, they are the most precise for the data avail-able for each country. We do not feel that the differences in definition invalidate intercountry comparisons. Percentage of women who are currently married, have been so for at least five years, and who have no living children. Primary infertility Percentage of women who have been married for the past five years, who have ever had sexual intercourse, who have not used contraception during the past five years, and who have not had any births. Self-reported infecundity Percentage of women who report having had a hysterectomy, or say they have gone through menopause, or report not having had a menstrual period in the past five years, or have never had a menstrual period. Secondary infertility Percentage of women with no births in the past five years but who have had a birth at some time, among women who have been married for the past five years and did not use contraception during that period. Secondary infecundity Percentage of women with no births and no pregnancies in the past five years but who have had a birth or pregnancy at some time, among women who have been married for the past five years but did not use contraception during that period. Results hildlessness at the end of the reproductive years is most effectively studied by using women in the oldest age cohort: women 45 to 49 years. However, there are well-known reporting problems with this age group that involve both the deter-mination of age and of fertility (for example, see Arnold, 1990; Goldman, 1985; Rut-stein, 1985; and Rutstein and Bicego, 1990). Therefore, Table 2 presents data on women in the next younger age cohort (40 to 44 years) to measure lifetime childless-ness. Using this age cohort instead of the oldest cohort should have little effect be-cause fertility is very low in the oldest age group and first births are rare. The term “childless” in this report is defined as having no living children at the time of the sur-vey. Childlessness can be the result of having had no live births or having had all children die by the time of the survey. The lowest levels of childlessness among women age 40 to 44 who have been mar-ried for at least five years occurs in four countries: Kyrgyz Republic (0.5 percent) and Uzbekistan (0.9 percent) in Central Asia, Vietnam in Southeast Asia (0.9 percent), and Peru in South America (0.9 percent). Thirteen countries have childlessness rates between 1.0 and 1.9 percent. In only six countries, all in sub-Saharan Africa, is the childless rate 4.0 percent or higher for women age 40 to 44 years (Chad and Niger, 4.4 percent; Madagascar, 4.7 percent; Comoros, 5.5 percent; Cameroon, 7.3 percent; and the Central African Republic, 10.5 percent). Childlessness among women age 40 to 44 has declined substantially from the lev-els reported by the World Fertility Survey (Vaessen, 1984). In his overview, Vaessen found no countries with less than 1 percent childless and only two with 1.0 to 1.9 percent childless, compared with 17 countries with less than 2 percent childless among current DHS surveys. At the same time, Vaessen found that the level of childlessness exceeded 4.0 percent in 43 percent of the WFS survey countries (12 of 28). By comparison, a 4.0 percent level of childlessness was reached in only 13 per-cent of DHS survey countries (6 of 24). The second column of Table 2 shows the level of childlessness among women age 25 to 49. Vaessen (1984) recommends using this age group as an indicator of child-lessness because of the problems associated with age-specific data. Specifically, small sample size for women in some countries can lead to large sampling errors and omis-sion of children by some of the older women. Comparing two age groups (women 40 to 44 and 25 to 49) gives an idea of the trends in childlessness. Such trends reflect improving or deteriorating health conditions that impact both potential parents and Childlessness among from the levels reported by the World Fertility Table 2 Childlessness and infertility among women age 40-44 and 25-49 Among currently married women age 40-44 and 25-49 who have been married for at least five years, percentage who have no living children and percentage who have had no fertile preg- nancies, Demographic and Health Surveys 1994-2000 No living children No fertile pregnancies Country Age 40-44 Age 25-49 Age 40-44 Age 25-49 Sub-Saharan Africa Benin Burkina Faso 1.4 Cameroon Central African Rep. 10.5 Chad Comoros Côte dIvoire 3.7 Guinea Kenya Madagascar Mozambique Senegal Togo Uganda Zimbabwe North Africa/West Asia Central Asia/South and Southeast Asia Bangladesh Cambodia Indonesia Kazakhstan Kyrgyz Republic 0.5 Philippines Turkmenistan Uzbekistan Latin America/Caribbean Bolivia Colombia Dominican Republic 3.7 Guatemala Nicaragua Results On average, childlessness rates are higher by 0.7 percent for women age 25 to 49 than for those age 40 to 44. In 16 countries, childlessness is greater by 1 percent or more for the 25 to 49 age group. Eleven of these are in sub-Saharan Africa. The three countries with the greatest differences are Nigeria (7.3 percent higher for age 25 to 49), Bangladesh (4.2 percent higher), and Mozambique (2.9 percent higher). It is unlikely that some of these large differences are due to understatement of child-lessness among women age 40 to 44 because omission of births among these older women would make their proportions higher than those of the broader age group. In three countries (Central African Republic, Chad, and Comoros) the broader age group has a percentage of childlessness that is lower by 1 percent or more. These dif-ferences may be due to improving health conditions and the lower exposure to chil-dren’s mortality in the broader age group. Some of the smaller differences in child-lessness between the two groups could be due to sampling error. 4.1.1 Fertile Pregnancies A more refined measure of the inability to produce offspring is the percentage of women who have not had a fertile pregnancy. A fertile pregnancy is a pregnancy that ended in a live birth or a current pregnancy that is presumed to end in a live birth, on average about 85 percent (Singh, 1989). In columns 3 and 4 of Table 2, the percent-ages of women without a fertile pregnancy are shown for women 40 to 44 and women 25 to 49, respectively. This measure eliminates the effect of children’s mortal-ity on the data. Fifty-seven percent of the countries (26 of 46) have percentages of no fertile preg-nancies for women 40 to 44 that are below 2 percent. Comoros, at 4.4 percent, and the Central African Republic, at 7.3 percent, are the only two countries above 4 per-cent. Removing the effect of mortality reduces the percentage of childlessness by 0.8 percent on average. In 16 countries, the reduction is 1 percent or more, but only 2 of these 16 countries, Haiti and Nepal, are outside of sub-Saharan Africa. Although the effect of mortality is greatest in the Central African Republic and Cameroon, these two countries have the highest levels of childlessness at age 40 to 44, even when this effect is removed. For the broader age group 25 to 49, removing the effect of mortality reduces the estimation of childlessness by 1 percent or more in most of sub-Saharan Africa, but does so in only three countries outside this region: Bangladesh, Nepal, and Haiti. The percentage with no fertile pregnancies among the broader age group is the child-less measure that is probably closest to primary infertility. The country with the low-est percentage is Bolivia (0.8 percent), and Bangladesh (4.0 percent), Cameroon (4.4 percent), Nigeria (5.2 percent) and the Central African Republic (6.4 percent) are the countries with the highest percentages in the broader age group. Among currently married women age 40 to 44 who have been married for at least five years, about 96 percent have one or more surviving children in the majority of coun-tries (40 out of 46). In more than half of the countries (29 of 46), 97 percent or more women have at least one surviving child. Of the same women, at least 92 percent have had at least one fertile pregnancy, and in 40 countries this proportion is 97 per-cent or higher. Among currently married have been married for at 96 percent have one or more surviving children in the majority of countries. Among currently married women age 25 to 49 who have at least five years’ expo-sure to the risk of pregnancy, a similar pattern emerges. In 38 countries, 97 percent or more of these women have had one or more pregnancies, and only in the Central Af-rican Republic does this level drop below 94 percent. 4.2 Primary Infertility Primary infertility is measured among women who have engaged in regular sexual intercourse for five or more years, have not used contraception for that period of time, and have not had a live birth. Primary infecundity is measured among the same women, but the women have had neither a pregnancy nor a birth in the specified pe-riod. We will examine each of the conditions in turn. 4.2.1 Sexual Experience Table 3 shows the proportion of women who have never had sex by five-year age groups, for age group 25 to 49, and for all women age 15 to 49 and age 25 to 49 standardized on the age distribution of Peru. In several countries in North Africa and Asia, only ever-married women were interviewed, and questions on sexual activity were not asked. In Nepal, the survey was based on ever-married women, but sexual activity questions were asked. The percentage of women who have not had sexual intercourse in the age group 15 to 19 ranges from 27 percent in Côte d’Ivoire to 94 percent in Turkmenistan. Overall, 59 percent of women in this age group have not had sexual intercourse. By age 20 to 24, the mean percentage who are still sexually inexperienced drops to 18 percent and by age 25 to 29 to 6 percent. By age 45 to 49, only 1 percent of women report not having had sexual intercourse at some time in their life. To smooth the effects of sampling variation caused by small numbers, women age 25 to 49 are grouped together. To further comparability, we have calculated age-standardized per-centages for this age group, on the basis of the age distribution of Peru, as shown in the last column of Table 3. Overall, only 2.6 percent of women age 25 to 49 have not had sexual intercourse. The highest percentage of women with no sexual experience is in the Philippines (12.4 percent), where even by age 45 to 49, 6.3 percent have still not had intercourse. Other countries with a high proportion of sexually inexperienced women age 25 to 49 are Cambodia (9.1 percent), Comoros (6.9 percent), and Peru (6.7 percent). The lowest levels occur in sub-Saharan Africa, where 17 of 23 coun-tries have less than 0.6 percent of women age 25 to 29 who have never had sexual intercourse. In the Central Asian republics, the percentage of women age 25 to 49 with no sexual experience ranges from 2.2 to 5.7 percent. In the Latin Amer-ica/Caribbean region, the percentage is about 4 to 5 percent, except in Peru. The overall means and the regional mean for Asia are affected by the lack of in-s in North Africa, West Asia, and South Asia, where cultural tradition makes it difficult to ask questions about sexual activity. The percentage of women who have not had sexual intercourse in the age group 15 to 19 ranges from 27 percent in Côte dIvoire to 94 percent in Results Table 3 Primary infertility (1): No sex Percentage of women age 15-49 who have never had sexual intercourse, by age group, Demographic and Health Surveys 1994-2000 Country standardized standardized Sub-Saharan Africa Benin 47.0 0.1 11.0 0.1 Burkina Faso 50.9 0.1 11.5 0.1 Cameroon 34.9 0.1 8.0 0.1 Central Afr. Rep. 38.0 0.4 8.8 0.3 Chad 45.2 0.4 10.7 0.3 Comoros 83.2 7.5 29.9 6.9 Côte dIvoire 27.3 0.0 6.3 0.0 62.4 3.6 19.3 3.8 62.2 0.6 15.1 0.5 Guinea 40.2 0.3 9.8 0.3 Kenya 56.4 0.6 14.3 0.5 Madagascar 43.5 1.6 11.7 1.6 42.7 0.3 10.0 0.3 34.0 0.3 7.9 0.3 Mozambique 30.5 0.1 6.9 0.0 36.5 0.6 9.7 0.6 56.9 1.7 15.9 1.5 Senegal 65.1 3.9 21.3 3.6 47.4 0.6 11.5 0.5 Togo 39.3 0.2 9.3 0.2 Uganda 38.4 0.5 9.0 0.4 41.7 0.3 10.0 0.3 Zimbabwe 67.7 1.1 17.9 1.0 North Africa/West Asia Central Asia/South and Southeast Asia Bangladesh Cambodia 87.1 8.6 32.1 9.1 Indonesia Kazakhstan 82.5 3.2 25.1 3.5 Kyrgyz Rep. 85.7 2.1 23.0 2.2 Philippines 90.9 12.2 36.7 12.4 Turkmenistan 94.1 5.6 33.0 5.7 Uzbekistan 87.0 2.3 24.0 2.3 Latin America/Caribbean Bolivia 80.3 4.3 25.7 4.4 67.2 5.1 22.3 5.3 Colombia 59.9 4.0 18.6 4.1 Dominican Rep. 67.3 4.6 21.8 4.4 Guatemala 72.6 5.1 23.3 5.1 71.0 3.9 22.1 3.9 Nicaragua 63.7 4.8 20.5 4.6 77.8 6.5 26.8 6.7 u = Unknown (not available for ever-married samples) 4.2.2 Pregnancy among Sexually Experienced Women Once sexual relations are begun on a regular basis, pregnancy soon follows for the majority of women unless contraception is used. Table 4 shows the proportion of women who have had sexual relations (any marital status for all-women surveys and non-single women for ever-married surveys) but have not had a pregnancy. There is a clear decline with increasing age from an overall average of about 40 percent with no pregnancy at age 15 to 19 to 16 percent at age 20 to 24 to 7 percent at age 25 to 29. This rapid decline is probably due to three factors: some adolescent subfecundity for sexually active women, particularly at age 15 to 17, a delay in establishing regular sexual relations even though a first experience of intercourse occurred, and some use of contraception among young women in order to delay the first pregnancy. By age 30, almost all sexually experienced women have had a pregnancy; the percentage without a pregnancy at age 35 to 49 is about 2.5 percent. At age 15 to 19, the countries with the smallest proportion of women who are sexually experienced but have not had a pregnancy are the Philippines and Guatemala t, respectively). It is interesting that the Philippines has the sec-ond highest proportion of women without sexual experience in this age group (Table 3). At 93 percent and 89 percent, respectively, Turkey and Morocco are the countries with the highest proportions of sexually experienced women age 15 to 19 who have not had a pregnancy. These percentages are unrealistically high and may indicate omission of some pregnancies, or perhaps, more sporadic sex on the part of respon-dents. These countries also have the highest proportions of sexually experienced women without a pregnancy at ages 20 to 24, 25 to 29, and 30 to 34. Among women age 25 to 49, the highest proportion of sexually experienced women who have not had a pregnancy is in Morocco (17.8 percent, age stan-dardized). Morocco is followed by Turkey (8.9 percent), and Brazil and Colombia (both 7.7 percent). In six countries, less than 2 percent of sexually experienced women age 25 to 49 have not had a pregnancy: Guatemala (1.2 percent), Vietnam (1.7 percent), Burkina Faso (1.8 percent), and Bangladesh, Malawi, and Uzbekistan (all 1.9 percent). 4.2.3 Births among Sexually Experienced Women Table 5 shows the proportion of women who have had sexual relations but have not had a birth. The data indicate that, overall, 18.8 percent of women age 15 to 49 who are sexually experienced have not had a birth. This percentage consists of 13.9 per-cent who have not had a pregnancy and 4.9 percent who have had at least one preg-nancy but who have not brought this pregnancy to term. Some of these women have lost the pregnancy through miscarriage and stillbirth, some have had an induced abortion, and others are currently pregnant for the first time. By age 25, however, most women would have completed their first pregnancy, allowing comparison be-tween countries using the age group 25 to 49 years. Overall, 5.0 percent of sexually experienced women age 25 to 49 have not had a birth, compared with 4.0 percent who have not had a pregnancy. The countries with the highest proportions of sexually experienced women with-out a birth are Morocco, Turkey, Colombia, Brazil, and the Central African Repub-lic, all over 8 percent; Morocco is highest at 19.1 percent. As with pregnancies, the countries with lowest proportions of sexually experienced women without a birth are Guatemala, Bangladesh, Burkina Faso, and Malawi, all under 3 percent. not had a birth, compared with 4.0 percent who have not had a Results Table 4 Primary infertility (2): Sex but no pregnancy Percentage of women age 15-49 who have had sexual intercourse but have never been pregnant, by age group, Demographic and Health Surveys 1994-2000 Country standardized standardized Sub-Saharan Africa Benin 51.0 3.3 Burkina Faso 48.2 1.8 Cameroon 47.9 3.5 Central Afr. Rep. 35.2 4.8 Chad 29.8 3.1 Comoros 45.8 6.9 Côte dIvoire 51.9 3.7 37.7 4.0 57.6 4.1 Guinea 37.8 3.4 Kenya 50.9 2.5 Madagascar 35.6 5.2 41.1 1.9 34.1 2.3 Mozambique 42.5 4.6 32.1 2.9 46.5 5.6 Senegal 36.1 3.5 51.6 3.2 Togo 68.0 4.4 Uganda 30.4 3.6 47.4 3.1 Zimbabwe 32.2 2.8 North Africa/West Asia 26.8 3.6 23.1 3.5 92.5 17.8 89.3 8.9 39.1 2.5 Central Asia/South and Southeast Asia Bangladesh 26.9 1.9 Cambodia 36.0 2.6 37.3 2.9 Indonesia 30.2 3.4 Kazakhstan 49.9 4.1 Kyrgyz Rep. 31.2 2.0 41.6 2.2 Philippines 20.2 2.9 Turkmenistan 25.1 2.1 Uzbekistan 24.9 1.9 26.1 1.7 Latin America/Caribbean Bolivia 30.3 4.1 41.3 7.7 Colombia 49.4 7.7 Dominican Rep. 25.6 4.0 Guatemala 20.3 1.2 48.9 5.6 Nicaragua 23.7 2.5 39.0 5.8 Table 5 Primary infertility (3): Sex but no birth Percentage of women age 15-49 who have had sexual intercourse but have never had a birth, by age group, Demographic and Health Surveys 1994-2000 Country standardized standardized Sub-Saharan Africa Benin 9.3 3.7 Burkina Faso 58.9 4.1 2.0 Cameroon 9.4 6.4 Central African Rep. 54.2 10.7 8.1 Chad 3.5 3.3 Comoros 12.9 7.2 Côte dIvoire 60.7 6.8 3.8 9.3 4.8 16.1 6.4 Guinea 6.7 3.6 Kenya 5.7 3.1 Madagascar 9.3 6.1 3.3 2.5 5.8 3.4 Mozambique 6.7 4.7 3.8 3.1 15.0 7.1 Senegal 8.3 3.7 7.0 3.9 Togo 11.3 4.7 Uganda 6.0 3.8 7.6 3.2 Zimbabwe 5.4 3.7 North Africa/West Asia 8.4 5.2 7.3 5.0 43.0 19.1 22.8 10.3 5.4 3.3 Central Asia/South and Southeast Asia Bangladesh 4.8 2.5 Cambodia 5.0 3.3 6.3 3.9 Indonesia 7.4 4.5 Kazakhstan 12.6 6.3 Kyrgyz Rep. 55.7 6.0 3.2 4.3 2.9 Philippines 7.7 4.3 Turkmenistan 7.3 3.3 Uzbekistan 6.4 2.8 5.1 2.6 Latin America/Caribbean Bolivia 10.0 4.5 18.0 9.3 Colombia 17.7 9.6 Dominican Rep. 43.9 10.2 5.9 Guatemala 3.0 1.8 16.0 7.6 Nicaragua 6.0 3.1 14.5 7.4 Results Even though the results may be based on small numbers, it is interesting to con-sider the group of women at the upper limits of the reproductive age span, 45 to 49 years. Overall, 3.0 percent of sexually experienced women in this age group have not had a birth. The proportions with no births range from 0.6 percent (Tanzania) to 8.4 percent (Central African Republic). Three other sub-Saharan countries have percent-ages higher than 5 percent: Cameroon (7.9 percent), Mozambique (5.7 percent), and Niger (5.5 percent). In the Latin America/Caribbean region, there are three countries in which more than 5 percent of sexually experienced women age 45 to 49 have not had a birth: Colombia and Brazil (both 5.4 percent) and Haiti (5.6 percent). 4.2.4 Observed Primary Infecundity The measurement of primary infecundity is complicated by contraceptive use and women’s fertility preferences. The determination of infecundity depends on a certain amount of exposure to the risk of pregnancy. In demographic studies, the period of risk is five years. A woman who fails to give birth during this period, while engaging regularly in sexual intercourse and not using any form of contraception nor induced abortion, is considered infecund. Marital union is considered to be the indicator of regularly engaging in sexual intercourse. Where contraceptive use is low, excluding women who have ever used contraception does not substantially bias the estimation of infecundity. Where contraceptive use is high, however, exclusion of women who use or who have ever used a contraceptive method is selective for infecund women, especially if most women use contraception for limiting the number of births. In these countries, the estimation of infecundity may be highly biased if contraceptive users are excluded from the denominator in calculating the percentage of women who are infecund. However, including contraceptive users in the denominator implies that they all are fecund and biases the estimate of infecundity downward. Moreover, there may be a difference between voluntary and involuntary infecundity. Some women do not desire to have any children and use contraception to achieve this desire. Other women want children but use contraception to postpone their first and/or subsequent births. When some of these latter women are ready to have children, some find that they cannot and so are involuntarily infecund. Tabulations that do not take into ac-count the desire for a child may underestimate the level of involuntary infecundity. 4.2.5 Women Who Do Not Want Children The desire for children is not universal. In every region there are countries where a considerable number of women do not want to have a child. Table 6 shows this nega-tive desire for children in two ways. Column one shows the percentage of women who do not want a child (or another child) among those who have no living children. The percentages reach as high as 3.3 percent in North Africa/West Asia, 6.0 percent in sub-Saharan Africa, 7.8 percent in Central Asia/South and Southeast Asia, and 12.0 percent in Latin America/Caribbean. Some of these women have had children who died, and may consider themselves too old to have additional children. The measurement of primary infecundity is contraceptive use and womens fertility preferences. Table 6 Women who do not want children Percentage of women who want no (more) children and percentage who are sterilized among women with no living children, and percentage of women whose ideal number of children is zero among women with no living children and among all women, Demographic and Health Surveys 1986-2001 Women with no living children Ideal number of children is zero Country and Survey Wants no (more) Sterilized Number Among women with no living children Among all Sub-Saharan Africa Benin 1996 1.0 Botswana 1988 1.9 Burkina Faso 1998/99 0.3 Cameroon 1998 0.2 Central African Rep. 1994/95 0.9 Chad 1996/97 0.1 Comoros 1996 4.0 Côte dIvoire 1998/99 1.1 Eritrea 1995 1.4 Ethiopia 2000 5.4 Gabon 2000 1.1 Ghana 1998 0.8 Guinea 1999 1.7 Kenya 1998 1.7 Liberia 1986 1.7 Madagascar 1997 1.3 Malawi 2000 3.2 Mali 1995/1996 0.9 Mozambique 1997 1.0 Namibia 1992 6.0 Niger 1998 0.8 Nigeria 1999 2.0 Rwanda 1992 1.4 Senegal 1997 0.8 Tanzania 1996 0.4 Togo 1998 1.5 Uganda 1995 1.6 Uganda 2000/01 1.0 Zambia 1996 1.5 Zimbabwe 1999 4.2 North Africa/West Asia Armenia 2000 3.3 Egypt 1995 1.0 Egypt 2000 1.1 Jordan 1997 1.1 Morocco 1992 1.3 Turkey 1998 2.2 Yemen 1997 2.6 Central Asia/South and Southeast Asia Bangladesh 1996/97 1.8 Bangladesh 1999/2000 0.8 Cambodia 2000 2.8 India 1992/1993 1.8 India 1998/1999 1.2 Indonesia 1997 2.3 Kazakhstan 1995 1.1 Kazakhstan 1999 1.7 Kyrgyz Republic 1997 1.2 Nepal 1996 1.1 Nepal 2001 1.2 Philippines 1998 1.4 Thailand 1987 7.8 Turkmenistan 2000 2.7 Uzbekistan 1996 2.2 Vietnam 1997 0.4 Latin America/Caribbean Bolivia 1998 8.2 Brazil 1996 9.8 Colombia 2000 6.6 Dominican Republic 1996 2.3 Guatemala 1998/99 12.0 Haiti 1994/95 1.5 Haiti 2000 0.4 Nicaragua 1997/98 4.3 Peru 1996 4.3 Peru 2000 3.6 Results The last two columns of Table 6 show another way to look at women’s desire for no children. In the next-to-last column are women whose ideal number of children is zero among those who have no living children. For several countries the proportion is more than 2.0 percent. From lowest to highest, they are Yemen (2.6 percent), Peru (2.9 percent), Nicaragua (4.0 percent), Turkey (4.2 percent), Colombia (4.7 percent), Bolivia (5.0 percent), Ethiopia (5.6 percent), and Brazil (6.3 percent). Most of the countries with high percentages among women with no living children whose ideal number of children is zero are in the Latin America/Caribbean region. The last col-umn shows the percentage of all women whose ideal number of children is zero, irre-spective of the number of children they have. The pattern tends to follow that of the women with no living children. 4.2.6 Self-reported Infecundity In the DHS surveys, women are not asked direct questions about fecundity or the capacity to reproduce. Rather, the information is interpreted from responses to ques-tions on the time since the last menstrual period, reason for not using contraception in the future, and desire for the next child. Additionally, women may report that they 1) have never menstruated, 2) have not menstruated for five or more years, 3) are postmenopausal, or 4) have had a hysterectomy. The five-year period is used to assure that lack of childbearing is not due to the postpartum effects of amenorrhea. These self-reports of infecundity are shown by age in Table 7. There is a curvilin-ear relationship between age and self-reported infecundity. In the youngest age group (15 to 19), an average of 7 percent of women are infecund. The majority of this infe-cundity is related to not having had their first menstruation (menarche). The lowest level of reported infecundity occurs at age 20 to 24 and rises thereafter, slowly at first and then more rapidly, until reaching an average of 57 percent among women age 45 to 49, mostly due to menopause. The overall and regional averages are shown in Fig-ure 1. Among all women age 15 to 49, 17.0 percent reported being infecund. The differences between regions are diminished by the overall pattern by age. However, there is still substantial variation by country. The highest levels of self-reported infe-cundity at age 15 to 19 occur in sub-Saharan Africa, where in 14 of 23 countries 10 percent or more of girls reported that they were infecund. In the other regions, only in Cambodia does the percentage who reported themselves infecund at age 15 to 19 exceed 10 percent. The age-adjusted percentages for women age 25 to 49 who re-ported themselves infecund vary from a low of 5.4 percent in Senegal to a high of 35.4 percent in Cambodia. The reader is cautioned that some of the variation be-tween countries may be due to differences in the available information, because direct questions were not asked. Most of the countries with high percentages among women with no living children whose Table 7 Self-reported infecundity Percentage of women who report they have not menstruated in the past five years, have never menstruated, are postmenopausal, or have had a hysterectomy, by age group, Demographic and Health Surveys 1994-2000 Country standardized standardized Sub-Saharan Africa Benin Burkina Faso 22.2 Cameroon Central African Rep. 16.1 Chad Comoros Côte dIvoire 4.2 Guinea Kenya Madagascar Mozambique Senegal Togo Uganda Zimbabwe North Africa/West Asia Central Asia/South and Southeast Asia Bangladesh Cambodia Indonesia Kazakhstan Kyrgyz Republic 5.9 Philippines Turkmenistan Uzbekistan Latin America/Caribbean Bolivia Colombia Dominican Republic 3.5 Guatemala Nicaragua Results Percentage of women who reported themselves infecund, by age group and region, DHS surveys 1994-2000 15…1920…2425…2930…3435…3940…4445…49Percentage of women infecund Total Sub-Saharan Africa Near East/North Africa Asia Latin America/Caribbean 4.3 Secondary Sterility Among women who have had one or more live births, the inability to have another child is called secondary sterility. Secondary infertility is used to estimate the preva-lence of secondary sterility. Secondary infertility is measured by the lack of a birth (or a current pregnancy) among women who were married for the past five years and did not use contraception during that period. In countries with low contraceptive preva-lence where the reproductive calendar was not used, there is no information on non-live birth pregnancies, marriage, or contraceptive use in the past five years. In these countries, time since first marriage greater than five years for currently married women is taken as the substitute. Women who have never used contraception are taken as the substitute for women who have not used contraception in the past five years. Because countries without a reproductive calendar are principally those with low contraceptive prevalence, the biases created by excluding women who have used contraception are small. Moreover, only secondary infertility can be determined for these countries. Secondary infecundity is measured by the lack of any pregnancy, whether ending in a live birth or not, among these women and includes women who reported themselves as infecund. 4.3.1 Prevalence of Secondary Infecundity Table 8 shows the prevalence of secondary infecundity by five-year age groups, for women age 25 to 49 (actual and standardized by age), and for all women age 15 to 49. In this table, the percentages of women without a birth are calculated from women who have been married for the past five years or longer and who did not use contraception during this time. Women who used contraception during the past five years and currently married women who have been married for less than five years are excluded from the numerator but are included in the denominator, implying that they are considered fecund during the whole time period. Also included are women who reported themselves to be infecund at the time of the survey. Averaging the countries together, we see that secondary infecundity increases sharply with age, from about 5 percent at age 20 to 24 to about 62 percent at age 45 to 49, following more or less the pattern of self-reported infecundity, but a little bit higher, especially at the older ages. At age 20 to 24, the country with the lowest per-centage of women with secondary infecundity is Colombia (0.8 percent) and the country with the highest is Uganda (21.6 percent). Although we exclude women who presumably are not exposed to the risk of preg-nancy, we have not controlled for regularity of sexual intercourse, which may slow or stop at longer durations of marriage, at older ages, and after a certain number of chil-dren are reached. Terminal abstinence may vary by culture and thus affect compari-sons at the higher ages. At age 45 to 49, the countries with the highest levels of sec-ondary infecundity are Chad, Côte d’Ivoire, and the Central African Republic, where 80 percent or more of all women are secondarily infecund. In many countries, values for secondary infecundity at age 15 to 19 should be ignored because of the small number of women in the age group who have had a live birth. These small numbers are likely to be selective and may not represent the majority of women that age in the country. Averaging the countries together, we see that secondary infecundity from about 5 percent at age 20 to 24 to about 62 percent at age 45 to 49. Results Table 8 Secondary infecundity Percentage of women who either report themselves as infecund or who, being continuously married for the five years preceding the survey and not using contraception during that period, did not have a live birth in the past five years, by age group, Demographic and Health Surveys 1994-2000 Country standardized standardized Sub-Saharan Africa Benin 8.7 22.0 Burkina Faso 22.7 23.2 Cameroon 7.2 26.4 Cent. African Rep. 16.5 35.8 Chad 16.2 32.8 Comoros 3.7 24.7 Côte dIvoire 4.8 37.3 15.2 26.9 11.1 24.3 Guinea 7.1 33.1 Kenya 14.3 24.0 Madagascar 10.7 26.3 11.5 24.1 10.5 27.9 Mozambique 12.1 35.2 15.6 26.6 13.7 30.7 Senegal 0.7 20.3 16.0 24.1 Togo 8.9 18.1 Uganda 23.3 37.7 9.6 22.0 Zimbabwe 5.1 19.5 North Africa/West Asia 0.7 17.0 1.5 13.5 0.2 15.2 4.2 18.9 8.0 24.5 Central Asia/South and Southeast Asia Bangladesh 3.7 22.7 Cambodia 14.9 38.4 4.9 27.5 Indonesia 2.4 26.1 Kazakhstan 1.5 15.7 Kyrgyz Republic 6.2 17.0 6.1 26.9 Philippines 2.6 19.8 Turkmenistan 6.0 18.7 Uzbekistan 2.8 16.6 0.0 9.3 Latin America/Caribbean Bolivia 1.3 17.5 1.0 12.6 Colombia 0.7 10.3 Dominican Republic 3.5 18.1 Guatemala 2.6 20.2 7.7 24.5 Nicaragua 3.3 17.7 2.3 15.7 Note: Women who were not married for the entire five years preceding the survey or who used contraception during that period and who did not declare themselves as infecund are considered fecund. As an indicator of overall secondary infecundity, we use the age-standardized per-centages for women age 25 to 49. It is interesting to note that neighboring countries in Southeast Asia have both the lowest and highest percentages with secondary infe-cundity of all countries surveyed: Vietnam at 9.3 percent and Cambodia at 38.4 per-cent, respectively. Other countries with more than 30 percent of women secondarily infecund are all in sub-Saharan Africa: Central African Republic, Chad, Côte d’Ivoire, Guinea, Mozambique, and Nigeria. Figure 2 shows secondary infecundity by subregional average for women age 25 to 49 (age-adjusted). Middle and Eastern Africa have the highest average levels of sec-ondary infecundity. These subregions are followed by Western Africa, Southern Af-rica, and South Asia, which have similar levels. The lowest levels of secondary infe-cundity are in South America. However, there may be some bias in these estimates because of the inclusion of contraceptive users in the denominator (implying fecun-dity). Three of the South American countries—Brazil, Colombia, and Peru—have high rates of contraceptive sterilization. Percentage of women age 25-49 with secondary infecundity, by region, DHS surveys 1994-2000 Percent4.3.2 Estimates of the Number of Infertile Women in Developing Countries As of mid-2002, it was estimated that more than 186 million ever-married women age 15 to 49 in developing countries (excluding China) were infertile because of pri-mary or secondary infertility (Table 9). This number represents more than one in four ever-married women of reproductive age in these countries. Some 18 million were involuntarily primarily infertile without having experienced a birth (about 2.5 estimated that more than infertility. Results Table 9 Regional estimates of childlessness, primary infertility, and secondary infertility Regional estimates of the number and percentage of women age 25-49 who are childless, primarily infertile, and secondarily infe Ever-married women Childless women age 25-49 Women with involuntary primary infertility Women with secondary infertility Women with primary or secondary infertility Region Women 15-49 in 2002 Percent Number (thousands) Percent Number (thousands) Percent Number (thousands) Percent Number (thousands) Percent Number (thousands) 1,592,006.6 More developed 147,064.8 Less developed 1,294,195.1 China 354,398.4 LDC…China 939,796.7 77.2 725,192.1 2.7 19,569.3 2.5 18,360.7 23.8 168,190.9 25.7 186,551.6 Africa 196,852.4 North Africa 46,924.9 Sub-Saharan Africa 149,927.5 76.8 115,089.1 3.2 3,670.8 2.6 2,953.0 28.2 31,609.8 30.0 34,562.8 East Africa 60,349.6 75.2 45,355.3 2.3 1,056.8 2.4 1,087.7 27.5 12,178.3 29.2 13,266.0 Middle Africa 22,068.3 76.1 16,788.3 4.7 795.6 2.9 481.3 30.2 4,922.9 32.2 5,404.2 Southern Africa 13,374.2 78.8 10,535.7 2.6 270.5 2.8 293.2 26.7 2,736.7 28.8 3,029.9 West Africa 54,115.9 78.1 42,279.4 2.0 847.9 2.1 877.3 26.7 11,072.5 28.3 11,949.8 Asia 980,017.1 South Central Asia 380,440.2 80.2 305,060.0 2.6 8,019.6 2.6 7,852.2 26.4 78,595.4 28.3 86,447.6 Southeast Asia 145,203.3 70.6 102,557.8 2.2 2,215.8 1.9 1,988.4 22.0 22,149.1 23.5 24,137.5 West Asia 48,613.1 74.6 36,268.6 1.5 547.8 1.5 545.1 16.5 5,910.5 17.8 6,455.6 China 354,398.4 Asia…China/ Japan/West Asia 599,406.7 77.8 466,347.6 2.5 11,764.9 2.4 11,332.6 25.4 115,694.5 27.2 127,027.1 Near East/North Africa 65,071.5 68.4 44,512.5 2.8 1,260.9 2.8 1,262.6 18.1 7,815.2 20.4 9,077.9 Middle East 18,146.6 North Africa 46,924.9 Latin America/ Caribbean 144,376.3 68.7 99,243.0 2.9 2,872.8 2.8 2,812.4 13.6 13,071.4 16.0 15,883.8 South America 96,796.0 68.2 66,031.0 3.0 1,976.1 2.9 1,924.6 12.7 8,130.7 15.2 10,055.3 Caribbean & Central America 47,580.1 73.1 34,761.4 2.1 743.4 2.2 767.9 20.2 6,880.0 22.0 7,648.0 Note: Primary and secondary infertility excludes voluntary infertility (women who do not want children). United Nations Medium Projection (United Nations, 2003) interpolated by the authors. Includes Niger and Nigeria Includes Mexico percent of ever-married women) and 168 million were secondarily infertile (24 per-cent of ever-married women). Table 9 uses the number of women projected by five-year age groups for each developing country for the years 2000 and 2005, according to the United Nations Population Division (United Nations, 2003). For countries with DHS surveys, the proportions ever married at age 15-29 were tabulated and weighted by the number of women age 15-49 to obtain weighted averages of proportions ever married for world subregions. A country with no DHS survey was assumed to have the same proportion ever married as the weighted average for its subregion. The number of women age 15-49 in the subregions was then multiplied by the weighted average for the subregion to get the estimated number of ever-married women. Similarly, weighted averages for subregion proportions of women who were childless, involun-tarily primarily infertile, or secondarily infertile, were calculated using the estimated number of ever-married women for the countries with DHS surveys. Again, non-DHS countries in the subregion were assumed to have the subregion average value. To get the number of childless and infertile women, the estimated proportions who were childless and infertile were multiplied by the total number of ever-married women in the subregion. The subregion numbers were then totaled to get the developing coun-infertile women (excluding China). Trends in Infertility rends in infertility, especially in view of the advent and spread of HIV and ad-vances in assisted reproductive technologies, are of considerable importance. Questions are often raised about whether levels of infertility—primary or secon-dary—have risen because of sexually transmitted infections including HIV, environ-mental factors, or changes in sexual and reproductive behaviors. A decline may be expected with an upsurge in treatment-seeking behavior and increased use of modern technologies of assisted reproduction. A valid comparison of information at two or more points in time, however, requires common approaches and instruments for data collection and analysis. This section reviews levels of infertility from two main data sets. First, we compare the percentage of currently married women (age 25 to 49 and 40 to 44), who have been married for at least five years and report no living children, in surveys conducted under the auspices of the World Fertility Survey (WFS) Pro-gramme roughly 20 years before the Demographic and Health Surveys included in this report. WFS undertook nationally representative surveys of ever-married women in the reproductive age range 15 to 49, using questions on fertility similar to those used in the DHS surveys. We also consider the trends in the percentage of currently married women age 25 to 49 and 40 to 44, who have been married for at least five years and reported no live birth (also termed as “fertile pregnancy”). Comparable in-formation was available for 11 countries that participated in both the WFS and DHS Second, we consider trends using data from the surveys conducted under the aus-pices of DHS in different countries. Of the 47 countries included in this report, 17 countries had two surveys, seven had three, and three had four; therefore, trends in infertility can be ascertained for 27 countries. Comparison across DHS surveys is relatively straightforward but the timeframe is shorter than when DHS and WFS surveys are compared. 5.1 Trends in No Surviving ChAmong currently married women age 40 to 44 who have been married for at least five years and who can be assumed to have completed their reproductive life, the propor-tion reporting no living children in the WFS surveys ranged from 2 percent in the Philippines (1978) to about 7 percent in Indonesia (1976) (Figure 3). In the DHS surveys about 20 years later in the same set of countries, the proportion ranged from 1 percent in Peru (2000) to 4 percent in Haiti (1994). In all countries except Jordan, the proportion of women age 40 to 44 with no living children declined substantially over the 20-year period, especially in Senegal, Indonesia, the Dominican Republic, and Haiti. In these countries, women age 40 to 44 with no living children exceeded 6 percent in the WFS surveys, but dropped to 3-4 percent in the DHS surveys. Coun-tries with 3-4 percent of married women agIn all countries except Jordan, the proportion of no living children declined substantially over the 20- Trends in Infertility WFS surveys also witnessed major declines in the DHS surveys. Having at least one living child by age 40 to 44 implies that at least one live birth survived to the time the mother reached this age. Therefore, the effect of the prevailing mortality patterns cannot be isolated from infertility (that is, not having any pregnancy or live birth). Significant gains have been made in mortality reduction since the period when the WFS surveys were conducted. Percentage of currently married women age 40-44 who have been married for at least five years but have no living children, WFS and DHS surveys 1975-2000 012345678Kenya 19781998Senegal 19781997Jordan 19761997Bangladesh 19751999Indonesia 19761997Nepal 19761996Philippines 19781998Colombia 19762000Dominican Republic 19751996Haiti 19771994Peru 19772000PercentWhile comparing women who have no living children is a useful measure of infer-tility, comparing women who have not had a live birth by age 40 to 44 is a more meaningful measure for examining changes in infertility. Figure 4 shows a decline over the 20-year period covered by the WFS and DHS surveys (all countries except Jordan) in the proportion of currently married women age 40 to 44 who have been married for at least five years but have had no live births. The trends are consistent with those in Figure 3, but the levels are lower because mortality effects are excluded. Trends in Infertility Around 5 percent of women in Indonesia and the Dominican Republic report having had no live birth by age 40 to 44 in the WFS surveys. In the DHS surveys, the per-centage is about 1-2 percent, with the highest levels in Indonesia and the Dominican Republic (3 percent each). Percentage of currently married women age 40-44 who have been married for at least five years but have not had a live birth, WFS and DHS surveys 1975- 0123456Kenya 1978Senegal 1978Jordan 1976Bangladesh 1975Indonesia Nepal 1976Philippines 1978Colombia 1976Dominican Republic 1975Haiti 1977Peru 1977PercentBetween the 1970s and the 1990s there was a decrease in the number of women age 40 to 44 reporting no surviving children (Figure 3) and no live births (Figure 4). The WFS data show that in 7 of 11 countries, 3 percent or more of women reported having had no live birth compared with only two countries (Indonesia and the Do-minican Republic) in the DHS data. When the percentages reporting no surviving children or no live births are compared, the decline is more detectable for women age 40 to 44 than for women age 25 to 49 because the former group represents women who have completed childbearing. Between the 1970s and the 1990s there was a decrease in the number of reporting no surviving children and no live births. Trends in Infertility Figures 5 and 6 show similar comparisons for women age 25 to 49. In four coun-tries (Bangladesh, Colombia, Jordan, and the Philippines), there is no decline in the percentage of women reporting no surviving child or no live birth over time. Instead, some rises are seen, especially in Bangladesh where the proportion of women report-ing no surviving child doubled from 3 to 6 percent between 1975 and 1999. The pro-portion of women reporting no live birth also doubled, from about 2 percent in 1975 to 4 percent in 1999. In many other countries, the proportion of women reporting no surviving child or no live birth declined, except in Colombia, Haiti, Peru, and the Philippines where either no change or only modest changes occurred. Percentage of currently married women age 25-49 who have been married for at least five years but have no living children, WFS and DHS surveys 1975-2000 012345678Kenya 1978Senegal 1978Jordan 1976Bangladesh 1975Indonesia 1976Nepal 1976Philippines 1978Colombia 1976Dominican Republic 1975Haiti 1977Peru 1977Percent Trends in Infertility Percentage of currently married women age 25-49 who have been married for at least five years but have not had a live birth, WFS and DHS surveys 1975- 0123456Kenya 19781998Senegal 19781997Jordan 19761997Bangladesh 19751999Indonesia 19761997Nepal 19761996Philippines 19781998Colombia 19762000Dominican Republic 19751996Haiti 19771994Peru 19772000Percent5.2 Trends in Primary InfertilityIn 27 countries with two or more surveys conducted under the DHS program, it is possible to compare data from the most recent survey with data from the previous survey (if there were only two surveys), or with data from the first survey (if there were more than two surveys). The interval between surveys varies, so the percentages for age groups 15 to 49 and 25 to 49 are age-standardized. Trends in Infertility For most countries, there was no consistent trend in the percentage of women age 25 to 49 who reported never having had sex (Figure 7 and Table 10). In Colombia, the Dominican Republic, and Peru, fewer women reported never having had sex in the last survey than in the first survey—23 percent versus 29 percent; 22 percent ver-sus 25 percent; and 27 percent versus 29 percent, respectively. In Bolivia, Nigeria, Senegal, and Ghana, however, a greater proportion of women reported never having Changes in the percentage of women age 25-49 who have never had sex, most recent DHS survey compared with previous DHS survey -8-6-4-20246Burkina FasoCameroonGhanaKenyaMadagascarMaliNigerNigeriaSenegalTanzaniaTogoUgandaZambiaZimbabweIndonesiaKazakhstanPhilippinesBoliviaColombiaDominican RepublicGuatemalaPeruPercent difference (recent estimate minus previous estimate) Trends in Infertility Table 10 Trends in the proportion of women who have never had sex Percentage of women age 15-49 who have never had sex, by age, Demographic and Health Surveys 1986-2000 Country survey standardized Sub-Saharan Africa Burkina Faso 1992/93 45.9 Burkina Faso 1998/99 50.9 Cameroon 1991 31.5 Cameroon 1998 34.9 Ghana 1988 50.1 Ghana 1993 41.0 Ghana 1998 62.2 Kenya 1989 53.7 Kenya 1993 53.9 Kenya 1998 56.4 Madagascar 1992 46.8 Madagascar 1997 43.5 Mali 1987 26.7 Mali 1995/96 34.0 1992 39.1 1988 36.5 Nigeria 45.6 Nigeria 56.9 Senegal 1992/93 64.6 Senegal 1997 65.1 Tanzania 51.5 Tanzania 47.4 Togo 1988 35.6 Togo 1998 39.3 Uganda 1988 37.7 Uganda 1995 38.4 Zambia 1992 39.5 Zambia 1996 41.7 Zimbabwe 1988 67.5 Zimbabwe 1994 70.3 Zimbabwe 1999 67.7 Asia Kazakhstan 1995 82.5 Kazakhstan 1999 79.5 Philippines 1993 91.9 Philippines 1998 90.9 Latin America/ Caribbean Bolivia 1989 74.7 Bolivia 1994 77.1 Bolivia 1998 80.3 Brazil 1986 80.2 * 7.6 * Brazil 1996 67.2 Colombia 1986 79.8 Colombia 1990 79.0 Colombia 1995 59.9 Colombia 2000 70.4 Dominican Rep. 1986 75.8 Dominican Rep. 1991 73.0 Dominican Rep. 1996 67.3 Guatemala 71.0 * 4.8 * Guatemala 75.0 Guatemala 72.6 Peru 1986 82.2 Peru 1992 81.4 Peru 1996 77.8 Peru 2000 79.7 * Less than 25 cases Trends in Infertility had sex in the most recent survey than in the earlier survey. In other countries, the differences were less than two percentage points. Among women who had sex but reported no pregnancy, there were no trends in 22 of the 27 countries (Figure 8). In Turkey, Morocco, and Togo, the percentage who reported having had sex but no pregnancy increased, while in Senegal and Malawi the proportion declined between the first and last survey. A similar trend can be seen for the percentage of women who had sex but no live birth (Figure 9). Changes in the percentage of women age 25-49 who have had sex but have not been pregnant, most recent DHS survey compared with previous DHS survey -15-10-5051015202530Burkina FasoCameroonGhanaKenyaMadagascarMalawiMaliNigerNigeriaSenegalTanzaniaTogoUgandaZambiaZimbabweEgyptJordanMoroccoTurkeyBangladeshIndonesiaKazakstanPhilippineBoliviaColombiaDominican RepublicGuatemalaPeruPercent difference (recent estimate minus previous estimate) Trends in Infertility Changes in the percentage of women age 25-49 who have had sex but have not had a live birth, most recent DHS survey compared with previous DHS survey -10-5051015202530Burkina FasoCameroonGhanaKenyaMadagascarMalawiMaliNigerNigeriaSenegalTanzaniaTogoUgandaZambiaZimbabweEgyptJordanMoroccoTurkeyBangladeshIndonesiaKazakhstanPhilippinesBoliviaColombiaDominican RepublicGuatemalaPeruPercent difference (recent estimate minus previous estimate)Among currently married women age 25 to 49 who have been married for five years, fewer women reported no live birth in the most recent survey compared with the previous survey. Figure 10 shows relatively modest changes, except in Senegal, Nigeria, Cameroon, and Burkina Faso, where the change is one to two percentage points. In Senegal, 98 percent reported having had at least one live birth in the last Trends in Infertility survey, compared with 97 percent in the first survey (Table 11). In Burkina Faso, 99 percent reported having had at least one live birth compared with 97.5 percent in the previous survey. In Nigeria, on the other hand, 95 percent reported having had at Changes in the percentage of women age 25-49 who have been married for the past five years but have had no live births, most recent DHS survey compared with previous DHS survey -1.5-1-0.500.511.522.5Burkina FasoCameroonGhanaKenyaMadagascarMalawiMaliNigerNigeriaSenegalTanzaniaTogoUgandaZambiaZimbabweEgyptJordanMoroccoBangladeshIndonesiaKazakhstanBoliviaBrazilColombiaDominican RepublicGuatemalaPeruPercent difference (recent estimate minus previous estimate) Trends in Infertility Table 11 Trends in the proportion of currently married women pregnancies Among currently married women age 40-44 and 25-49 who have been married for the past five years, percentage who have no living children and percentage who have had no fertile pregnancies, Demographic and Health Surveys 1986-2000 No living children No fertile pregnancies No living children No fertile pregnancies Country survey Age 40-44 Age 25-49 Age 25-49 Country survey Age 40-44 Age 25-49 Age 25-49 Sub-Saharan Africa Benin 1996 3.2 2.3 2.1 1.4 Burkina Faso 1992/93 2.1 3.5 1.5 2.5 Burkina Faso 1998/99 1.4 2.2 1.0 1.3 Cameroon 1991 7.0 7.4 5.1 5.4 Cameroon 1998 7.3 6.6 3.7 4.4 Central Afr. Rep. 1994/95 10.5 9.3 7.3 6.4 Chad 1996 4.4 3.4 3.0 2.0 Comoros 1996 5.5 4.2 4.4 3.2 Côte dIvoire 1998/99 3.7 3.8 2.0 2.2 Eritrea 1995 1.2 3.3 0.9 1.8 Ghana 1988 1.6 2.7 0.6 1.6 Ghana 1993 2.8 2.6 2.5 1.9 Ghana 1998 1.1 2.5 0.6 2.0 Guinea 1999 3.0 4.5 1.9 2.6 Kenya 1989 2.1 2.2 1.9 1.6 Kenya 1993 2.1 1.7 1.9 1.4 Kenya 1998 1.5 1.6 1.5 1.3 Madagascar 1992 7.5 6.0 4.4 4.2 Madagascar 1997 4.7 4.8 3.3 3.4 Malawi 1992 2.8 4.1 1.8 2.3 Malawi 2000 2.8 3.8 1.6 1.7 Mali 1987 5.5 6.3 3.8 3.3 Mali 1995/96 3.3 4.3 1.7 2.5 Mozambique 1997 3.1 6.0 1.9 3.3 Níger 1992 5.6 5.8 4.4 3.2 Níger 1998 4.4 4.2 2.7 2.4 Nigeria 1990 5.4 4.5 4.6 3.3 Nigeria 1999 2.1 9.4 1.8 5.2 Senegal 1986 5.5 5.2 2.6 3.3 Senegal 1992/93 4.0 3.8 2.5 2.5 Senegal 1997 3.8 2.9 2.1 2.0 Tanzania 1996 2.5 3.5 1.3 2.0 Tanzania 1999 2.8 4.0 2.0 2.8 Togo 1988 1.7 2.7 0.4 1.7 Togo 1998 1.4 2.5 0.9 1.7 Uganda 1988 7.0 4.9 5.1 3.1 Uganda 1995 3.2 4.2 1.9 3.0 Zambia 1992 1.3 2.7 0.9 1.9 Zambia 1996 2.3 3.6 1.5 1.9 Zimbabwe 1988 2.4 2.0 1.2 1.4 Zimbabwe 1994 3.2 2.2 1.9 1.2 Zimbabwe 1999 2.7 2.7 2.3 1.6 North Africa/ West Asia Egypt 1992 3.1 3.5 2.5 2.9 Egypt 1995 2.8 3.1 2.6 2.7 Jordan 1990 0.8 2.0 0.8 1.9 Jordan 1997 2.4 2.8 2.4 2.7 Morocco 1987 Morocco 1995 Turkey 1993 Turkey 1998 Yemen 1997 Central Asia/ South and Southeast Asia Bangladesh 1996/97 Bangladesh 1999/2000 Cambodia 2000 India 1998/99 Indonesia 1987 Indonesia 1991 Indonesia 1994 Indonesia 1997 Kazakhstan 1995 Kazakhstan 1999 Kyrgyz Rep. 1997 Nepal 1996 Philippines 1993 Philippines 1998 Turkmenistan 2000 Uzbekistan 1996 Vietnam 1997 Latin America/ Carribean Bolivia 1989 Bolivia 1994 Bolivia 1998 Brazil 1986 Brazil 1996 Colombia 1986 Colombia 1990 Colombia 1995 Colombia 2000 Dominican 1986 Dominican 1991 Dominican 1996 Guatemala 1997 Guatemala 1995 Guatemala 1998/99 Haiti 1994/95 Nicaragua 1997/98 Peru 1986 Peru 1992 Peru 1996 Peru 2000 Trends in Infertility least one live birth in the most recent survey, compared with 97 percent in the previ-ous survey. More women reported having at least one living child in the latest survey compared with the previous survey in most countries except Nigeria (Figure 11). De-clining percentages of women reporting no live births or no surviving children are more pronounced when we consider women age 40 to 44, who have largely com-pleted childbearing (Figures 12 and 13). Only in Jordan did more women report no live birth or no living children (2.4 percent) in the latest survey compared with the previous survey (0.8 percent). Changes in the percentage of women age 25-49 who have been married for the past five years but have no living children, most recent DHS survey compared with previous DHS survey -3-2-10123456Burkina FasoCameroonGhanaKenyaMadagascarMalawiMaliNigerNigeriaSenegalTanzaniaTogoUgandaZambiaZimbabweEgyptJordanMoroccoBangladeshIndonesiaKazakhstanBoliviaBrazilColombiaDominican RepublicGuatemalaPeruPercent difference (recent estimate minus previous estimate) Trends in Infertility Changes in the percentage of women age 40-44 who have been married for the past five years but have had no live births, most recent DHS survey compared with previous DHS survey -4-3-2-1012Burkina FasoCameroonGhanaKenyaMadagascarMalawiMaliNigerNigeriaSenegalTanzaniaTogoUgandaZambiaZimbabweEgyptJordanMoroccoBangladeshIndonesiaKazakhstanBoliviaBrazilColombiaDominican RepublicGuatemalaPeruPercent difference (recent estimate minus previous estimate) Trends in Infertility Changes in the percentage of women age 40-44 who have been married for the past five years but have no living children, most recent DHS survey compared with previous DHS survey -5-4-3-2-1012Burkina FasoCameroonGhanaKenyaMadagascarMalawiMaliNigerNigeriaSenegalTanzaniaTogoUgandaZambiaZimbabweEgyptJordanMoroccoBangladeshIndonesiaKazakhstanBoliviaBrazilColombiaDominican RepublicGuatemalaPeruPercent difference (recent estimate minus previous estimate)Among currently married women age 15 to 49 years who are sexually active, not using contraception, and have been married for the past five years, the percentage reporting no live birth or pregnancy has changed little except in seven countries (Fig-ure 14). In Kazakhstan, the percentage with no live birth or pregnancy declined by six percentage points, and in Burkina Faso the decline was five percentage points. In-creases of 5 percentage points or more were noted for Peru, the Dominican Republic, Colombia, Jordan, and Zimbabwe. Trends in Infertility Changes in the percentage of noncontracepting, sexually experienced women age 15-49 who have been married for the past five years but have had no live births or pregnancies, most recent DHS survey compared with previous DHS -10-505101520Burkina FasoCameroonGhanaKenyaMadagascarMalawiMaliNigerNigeriaSenegalTanzaniaTogoUgandaZambiaZimbabweEgyptJordanMoroccoBangladeshIndonesiaKazakhstanBoliviaBrazilColombiaDominican RepublicGuatemalaPeruPercent difference (recent estimate minus previous estimate)5.3 Trends in Secondary Infertility Choosing an appropriate indicator to assess the trends in secondary infertility is not straightforward. Among the various indicators, we have selected the percentage of currently married noncontracepting women with at least one pregnancy or live birth who reported no birth or pregnancy in the five years preceding the survey. We as-sume that women who were using contraception or were married for less than five years are fecund. Major declines were noted in the percentage reporting no live birth or pregnancy in the most recent survey compared with the previous survey, except in Turkey, Togo, and Burkina Faso (Figure 15). Trends in Infertility Changes in the percentage of currently married noncontracepting women who have had no live births or pregnancies in the past five years, most recent DHS survey compared with previous DHS survey -12-10-8-6-4-202468Burkina FasoCameroonGhanaKenyaMadagascarMalawiMaliNigerNigeriaSenegalTanzaniaTogoUgandaZambiaZimbabweEgyptJordanMoroccoTurkeyBangladeshIndonesiaKazakhstanPhilippinesBoliviaColombiaDominican RepublicGuatemalaPeruPercent difference (recent estimate minus previous estimate)Note: Contraceptive users or those married for less than five years are assumed to be fecund. Consequences of Infertility he onus of infertility in most societies is placed on the woman. When the couple is unable to produce children, the couple may divorce or separate, or the man may take another wife if they live in a culture that permits polygyny. The breakup of the relationship is therefore both a coping strategy for men and an unfortunate con-sequence for women. In some cultures, the woman needs to “prove” her fertility be-fore entering into a formal union. In these societies, women may remain unmarried if they cannot bear children. Tables 12 to 15 present these relationship consequences for women age 30 or older in various subgroups, type of childlessness and infecun-Table 12 shows the percentage of women who were divorced or separated at the time of the survey by whether they were childless, primarily sterile, or secondarily sterile. The table also shows the difference in marital status between those who are and are not childless or sterile. Overall, women who have never had a child or are currently childless are more likely to be divorced or separated, 14 percent for primary sterility and 12 percent for childlessness. The increased likelihood of divorce or sepa-ration due to secondary sterility is 5 percent, much less than the increase for primary sterility. By region, the largest difference for primary sterility is in Latin America, where 21 percent of women are more likely to be divorced or separated than women who are not primarily sterile. This region also has the largest effect for secondarily sterile women, with 10 percent being divorced or separated. In three countries, Nica-ragua, the Dominican Republic, and Eritrea, more than 40 percent of primarily ster-ile women are divorced or separated. At the other extreme is Mali, where only 4 per-cent of primarily sterile women are divorced or separated. For women age 30 or older who have had sexual relations, Table 13 shows the percentage that never married, by primary sterility status. Overall, women who are primarily sterile are 7 percent more likely to have never married than other women. At 10 percent, Latin America is the region with the greatest percent difference in never marrying, by primary sterility status. In four countries, more than 20 percent of sexually experienced primarily sterile women have never married: Côte d’Ivoire (22 percent), Kenya (25 percent), South Africa (25 percent), and Guatemala (25 percent). Overall, women who have never had a child or are currently childless are or separated, 14 percent for primary sterility and 12 percent for Consequences of Infertility Table 12 Divorce and separation by childlessness and sterility status Percentage of women who were divorced or separated at the time of the survey, by whether they were childless, primarily sterile secondarily sterile, Demographic and Health Surveys 1994-2000 Childless (no living children) Primarily sterile (ever-married women) Secondarily sterile Country Sub-Saharan Africa Benin 3.5 16.8 13.3 3.5 15.5 12.0 3.6 3.8 0.2 Burkina Faso 0.7 6.9 6.2 0.8 (3.8) 1.1 0.8 -0.3 Cameroon 8.5 10.5 2.0 8.0 18.7 10.7 6.6 8.9 2.3 Central African Rep. 13.6 18.8 5.2 13.2 23.3 10.1 10.4 14.2 3.8 Chad 6.3 25.0 18.7 7.1 8.9 1.8 (1.6) 7.2 5.6 Comoros 9.7 19.6 9.9 9.9 16.0 6.1 2.5 11.1 8.6 Côte dIvoire 9.6 (29.5) 19.9 9.6 (28.1) 18.5 14.3 10.0 -4.3 Eritrea 10.1 34.2 24.1 9.6 41.3 31.7 0.0 11.4 11.4 Ghana 12.5 22.7 10.2 11.7 29.8 18.1 3.3 14.0 10.7 Guinea 1.7 4.4 2.7 1.6 8.2 6.6 4.3 1.7 -2.6 Kenya 6.7 28.9 22.2 6.9 18.9 12.0 5.1 8.1 3.0 Madagascar 14.2 26.9 12.7 14.0 30.1 16.1 5.7 16.1 10.4 10.0 13.0 3.0 9.9 16.4 6.5 6.2 11.1 4.9 1.1 5.3 4.2 1.2 3.9 2.7 1.6 1.3 -0.3 Mozambique 13.1 28.6 15.5 14.0 12.1 -1.9 16.2 13.9 -2.3 Niger 2.9 11.1 8.2 3.0 13.8 10.8 5.2 3.1 -2.1 Nigeria 2.9 11.1 8.2 2.9 10.8 7.9 2.7 3.2 0.5 S. Africa 13.0 15.3 2.3 12.6 18.4 5.8 11.0 14.4 3.4 Senegal 5.5 14.7 9.2 5.0 24.8 19.8 6.0 5.7 -0.3 Tanzania 10.3 (26.7) 16.4 10.2 21.9 11.7 6.5 11.5 5.0 Togo 7.1 27.4 20.3 7.0 23.0 16.0 7.3 7.7 0.4 Uganda 9.8 24.0 14.2 10.0 22.8 12.8 4.0 11.2 7.2 Zambia 12.6 25.4 12.8 12.3 28.4 16.1 4.6 14.2 9.6 Zimbabwe 8.6 24.6 16.0 8.0 28.3 20.3 3.5 11.2 7.7 Average 11.6 11.5 North Africa/West Asia Egypt 2.6 12.7 10.1 2.3 21.9 19.6 0.1 6.6 6.5 Jordan 1.2 12.3 11.1 1.3 13.2 11.9 0.0 3.7 3.7 Morocco 3.6 22.2 18.6 3.1 29.5 26.4 0.0 7.5 7.5 Turkey 2.3 10.4 8.1 1.9 10.7 8.8 0.0 6.9 6.9 Yemen 2.5 18.3 15.8 2.4 33.9 31.5 0.1 3.7 3.6 Average 12.0 16.7 Central Asia/South and Southeast Asia Bangladesh 2.5 23.7 21.2 2.3 21.9 19.6 0.4 6.0 5.6 Cambodia 4.3 12.3 8.0 3.6 20.8 17.2 0.0 5.4 5.4 India 1.4 18.8 17.4 1.6 9.7 8.1 0.0 4.9 4.9 Indonesia 3.0 11.2 8.2 2.8 8.9 6.1 0.0 4.8 4.8 Kazakhstan 11.3 23.1 11.8 8.3 29.8 21.5 5.7 14.8 9.1 Kyrgyz Republic 6.5 (42.6) 36.1 5.8 26.6 20.8 1.1 10.0 8.9 Nepal 1.8 12.5 10.7 1.5 17.2 15.7 0.0 3.6 3.6 Philippines 3.6 10.1 6.5 3.0 12.6 9.6 0.9 5.2 4.3 Turkmenistan 5.1 23.7 18.6 4.4 24.1 19.7 1.5 7.9 6.4 Uzbekistan 3.7 (33.6) 29.9 3.0 25.1 22.1 0.7 6.9 6.2 Vietnam 3.3 (21.4) 18.1 2.6 16.0 13.4 4.2 0.0 -4.2 Average 15.4 15.4 Latin America/Caribbean 8.7 10.5 1.8 7.8 26.2 18.4 3.1 11.5 8.4 Brazil 10.7 15.8 5.1 10.2 17.4 7.2 7.8 15.3 7.5 Colombia 20.2 28.4 8.2 18.4 37.8 19.4 13.1 30.0 16.9 Dominican Republic 19.3 22.6 3.3 17.5 43.1 25.6 15.4 22.5 7.1 Guatemala 8.2 17.5 9.3 7.0 39.2 32.2 3.9 9.7 5.8 12.2 15.2 3.0 11.2 27.6 16.4 6.3 13.3 7.0 Nicaragua 21.5 43.4 21.9 20.4 43.5 23.1 13.9 28.5 14.6 Peru 10.4 23.0 12.6 9.0 31.3 22.3 4.2 16.7 12.5 Average 20.6 10.0 Grand average 11.8 14.3 Note: Figures in parentheses are based on 25-49 unweighted cases. Includes infertile women and women who report themselves as infecund. Consequences of Infertility Table 13 Primary sterility among never-married women Percentage of women age 30 or older who have had sexual rela- tions but have never married, by primary sterility status (never given birth), Demographic and Health Surveys 1994-2000 Primary sterility (never-married women) Country No Sub-Saharan Africa Benin 0.5 9.2 8.7 Burkina Faso 0.2 (5.2) Cameroon 2.4 10.8 8.4 Central African Rep. 3.6 7.1 3.5 Chad 0.1 2.0 1.9 Comoros 0.5 0.0 -0.5 Côte dIvoire 3.4 25.8 22.4 Eritrea 0.3 2.3 2.0 Ghana 1.2 2.8 1.6 Guinea 0.4 0.0 -0.4 Kenya 2.6 27.8 25.2 Madagascar 2.7 12.1 9.4 0.2 2.8 2.6 0.4 2.4 2.0 Mozambique 1.4 3.7 2.3 Niger Nigeria 2.1 2.4 0.3 S. Africa 15.4 40.6 25.2 Senegal 0.8 8.2 7.4 Tanzania 1.9 7.4 5.5 Togo 0.9 9.4 8.5 Uganda 1.2 4.7 3.5 Zambia 1.1 7.4 6.3 Zimbabwe 1.5 10.6 9.1 Average North Africa/west Asia Egypt Morocco Jordan Turkey Yemen Central Asia/South and Southeast Asia Bangladesh Cambodia 0.1 0.3 0.2 India Indonesia Kazakhstan 2.6 4.6 2.0 Kyrgyz Republic u Nepal Philippines 0.1 3.9 3.8 Turkmenistan Uzbekistan Vietnam Average Latin America/Caribbean 2.0 18.1 16.1 Brazil 3.6 6.6 3.0 Colombia 6.2 20.3 14.1 Dominican Republic 1.1 5.8 4.7 Guatemala 0.6 25.3 24.7 0.7 3.3 2.6 Nicaragua 0.4 2.2 1.8 Peru 4.1 18.9 14.8 Average 10.2 Grand average Note: Figures in parentheses are based on 25-49 unweighted cases. u = Unknown (not available) Rather than remaining divorced or separated, women who were in an infertile un-ion may remarry and thus be in a second or later marriage at the time of the survey. Childless women are 13 percent more likely to have married more than once than women with children (Table 14). Primarily infertile and secondarily infertile women are 7 and 8 percent, respectively, more likely to be in a second or later marriage than are fertile women. By region, sub-Saharan Africa has the greatest difference in per-cent remarried between childless and nonchildless women (17 percent) and primarily and secondarily infertile women (10 percent each). In contrast, in Latin America and the Caribbean, childless and primarily infertile women are less likely to have had a second or later union than are other women, and the difference for secondarily infer-tile women is minimal. In nine sub-Saharan countries, the difference is 20 percent or more for women with a second or later union between childless women and women with children. Outside of sub-Saharan Africa, the difference is 20 percent or more only in Morocco, Indonesia, and Uzbekistan. For primary infertility, six countries have a difference of 20 percent or more. For secondary sterility, only three countries have that large a difference: Central African Republic, Madagascar, and Mozam-Instead of divorcing or separating from his wife when the union is infertile, a man may take another wife in those societies where polygyny is allowed. Questions about polygyny were only included in the surveys in sub-Saharan Africa and in Jordan, Mo-rocco, Nepal, and Yemen. Whether a man takes another wife if his first wife is child-less varies substantially among countries; however, he is much more likely to have another wife in Kenya, Jordan, Nepal, and Yemen, with differences by childless status of 20, 19, 19, and 15 percent, respectively (Table 15). In these countries, the percent-age of nonchildless wives in polygynous unions is relatively low. In some African countries, polygyny is quite high even among couples with children. For primary in-fertility, it is more likely that the fertile couple is polygynous than the infertile couple in most countries. This may be because men have divorced or separated from their first wife if she is primarily infertile. For Jordan and Nepal, however, primarily infer-tile couples are 10 percent more likely to take on another wife than fertile couples. Because couples and women can experience several competing consequences of childlessness and infertility, it is useful to have a summary indicator of the relation-ship effects. To this end, we tabulated women by whether or not they were living in a monogamous first union at the time of the survey, thus taking into account never marrying, divorce and separation, remarriage, and polygyny. Table 16 shows the re-sults according to childlessness and infertility status. For some countries, monoga-mous first union status could not be collected because only ever-married women were interviewed. In countries where the wife’s union rank (first wife, second wife, etc.) was not asked, it was assumed that there was no polygyny. Overall, sexually experienced childless and primarily infertile women are 18 per-cent less likely to be living in a monogamous first union than sexually experienced women with children. Women who have had a child but are unable to have more were 12 percent less likely to be living in a monogamous first union. A portion of the relationship between secondary sterility and monogamous first unionship may be due to the effects of age; older women are more likely to be secondarily sterile and to have had more exposure to divorce, separation, and polygyny. Instead of divorcing or separating from his wife when the union is infertile, a man may take another wife in those societies where polygyny Consequences of Infertility Table 14 Remarriage by childlessness and sterility status Percentage of women who have had more than one union, by whether they are childless, primarily sterile, or secondarily sterile, Demo- graphic and Health Surveys, 1994-2000 Childless (no living children) Primarily sterile (ever-married women) Secondarily sterile Country Sub-Saharan Africa Benin 31.0 51.0 20.0 31.1 44.5 13.4 23.1 31.3 8.2 Burkina Faso 20.7 38.6 17.9 21.0 (21.2) 14.6 21.3 6.7 Cameroon 23.6 59.4 35.8 24.6 48.6 24.0 14.5 26.3 11.8 Central African Rep. 37.0 65.9 28.9 38.5 53.0 14.5 17.5 39.0 21.5 Chad 26.7 39.0 12.3 26.9 39.6 12.7 (15.9) 27.3 11.4 Comoros 44.6 60.8 16.2 44.8 58.0 13.2 31.3 46.6 15.3 Côte dIvoire 26.6 (23.3) -3.3 26.9 (16.4) -10.5 17.1 25.9 8.8 Eritrea 23.8 27.1 3.3 23.5 32.7 9.2 13.2 24.5 11.3 Ghana 37.4 38.9 1.5 38.1 26.7 -11.4 29.5 37.0 7.5 Guinea 22.4 40.9 18.5 22.6 39.5 16.9 20.4 23.3 2.9 Kenya 7.8 21.9 14.1 8.0 10.8 2.8 4.1 9.5 5.4 Madagascar 35.6 63.6 28.0 36.5 48.1 11.6 14.9 38.9 24.0 34.8 66.5 31.7 34.8 64.4 29.6 25.5 38.1 12.6 18.3 43.3 25.0 18.7 35.7 17.0 15.7 19.2 3.5 Mozambique 37.0 49.5 12.5 36.8 58.4 21.6 16.0 38.6 22.6 Niger 37.2 63.7 26.5 37.6 60.6 23.0 Nigeria 14.1 31.7 17.6 14.6 16.6 2.0 4.2 16.1 11.9 S. Africa 10.5 17.7 7.2 10.8 10.6 -0.2 7.6 8.6 1.0 Senegal Tanzania 32.5 (42.3) 32.3 42.4 10.1 26.2 33.6 7.4 Togo 31.3 39.5 8.2 31.5 33.5 2.0 27.6 31.3 3.7 Uganda 31.6 55.0 23.4 32.1 45.9 13.8 26.0 33.1 7.1 Zambia 32.5 47.5 15.0 32.5 43.0 10.5 20.2 34.5 14.3 Zimbabwe 16.1 38.5 22.4 16.7 17.9 1.2 11.4 18.1 6.7 Average 17.1 10.3 North Africa/West Asia Egypt 5.0 18.7 13.7 5.2 12.6 7.4 Jordan 4.0 15.5 11.5 4.1 17.7 13.6 Morocco 15.3 39.2 23.9 15.8 27.4 11.6 Turkey 3.9 14.2 10.3 3.8 9.0 5.2 Yemen 13.8 23.3 9.5 13.9 19.1 5.2 Average 14.9 Central Asia/South and Southeast Asia Bangladesh 8.9 25.7 16.8 8.7 24.0 15.3 Cambodia 10.1 16.3 6.2 10.2 11.2 1.0 6.8 10.8 4.0 India 1.9 7.2 5.3 1.9 4.4 2.5 Indonesia 16.1 37.8 21.7 16.2 24.9 8.7 11.8 19.1 7.3 Kazakhstan 14.5 29.2 14.7 13.5 22.0 8.5 12.0 15.9 3.9 Kyrgyz Republic 13.3 (30.8) 17.5 11.9 37.2 25.3 8.3 15.5 7.2 Nepal 9.2 16.4 7.2 9.1 17.4 8.3 7.3 11.6 4.3 Philippines 7.9 9.6 1.7 8.1 5.9 -2.2 6.4 8.5 2.1 Turkmenistan 7.6 23.7 16.1 6.5 31.4 24.9 4.8 9.6 4.8 Uzbekistan 6.5 (48.2) 41.7 6.1 25.1 19.0 4.9 8.6 3.7 Vietnam 3.4 (1.6) -1.8 3.4 3.7 0.3 Average 11.9 10.3 Latin America/Caribbean 10.9 9.7 -1.2 11.0 8.8 -2.2 10.0 11.0 1.0 Brazil 15.2 16.8 1.6 15.6 11.2 -4.4 12.8 16.3 3.5 Colombia 21.9 14.2 -7.7 22.5 15.0 -7.5 18.6 20.5 1.9 Dominican Republic 40.4 46.9 6.5 41.2 33.6 -7.6 36.8 41.9 5.1 Guatemala 13.4 14.9 1.5 13.7 8.5 -5.2 14.2 13.0 -1.2 45.9 53.1 7.2 46.2 45.8 -0.4 36.1 46.8 10.7 Nicaragua 35.8 24.8 -11.0 36.4 23.9 -12.5 35.9 34.4 -1.5 Peru 11.8 7.6 -4.2 12.0 7.4 -4.6 10.3 11.1 0.8 Average -0.9 -5.6 Grand average 12.5 Note: Figures in parentheses are based on 25-49 unweighted cases. u = Unknown (not available) Consequences of Infertility Table 15 Polygynous first union by childlessness and primary sterility Percentage of women who are in a polygynous first union, by whether they are childless or pri- marily sterile, Demographic and Health Surveys 1994-2000 Childless (no living children) Primarily sterile (ever-married women) Country Sub-Saharan Africa Benin 52.3 61.5 9.2 52.5 55.2 2.7 Burkina Faso 61.6 58.1 -3.5 61.6 (58.9) -2.7 Cameroon 33.5 37.6 4.1 33.9 31.1 -2.8 Central African Rep. 27.5 25.4 -2.1 27.5 25.4 -2.1 Chad 41.9 34.5 -7.4 41.6 41.4 -0.2 Comoros 26.6 31.4 4.8 27.2 18.0 -9.2 Côte dIvoire 37.3 (21.5) -15.8 36.7 (37.1) Eritrea 7.4 10.6 3.2 7.7 5.4 -2.3 Ghana 24.4 22.3 -2.1 24.7 19.0 -5.7 Guinea 60.7 68.4 7.7 61.2 55.6 -5.6 Kenya 16.5 36.3 19.8 16.9 20.0 3.1 Madagascar 2.4 3.2 0.8 2.5 2.4 -0.1 18.1 22.6 4.5 18.1 21.6 3.5 51.2 57.1 5.9 51.4 51.5 0.1 Mozambique 26.0 16.0 -10.0 25.8 16.3 -9.5 Niger 44.0 45.3 1.3 44.0 48.7 4.7 Nigeria 35.9 43.7 7.8 36.3 31.4 -4.9 S. Africa 5.9 5.5 -0.4 5.9 5.3 -0.6 Senegal 52.5 56.8 4.3 53.0 42.0 -11.0 Tanzania 28.3 32.9 4.6 28.2 35.2 7.0 Togo 44.9 40.2 -4.7 45.1 36.4 -8.7 Uganda 29.7 29.4 -0.3 29.6 31.8 2.2 Zambia 18.2 17.9 -0.3 18.5 12.4 -6.1 Zimbabwe 13.2 15.7 2.5 13.5 9.1 -4.4 Average -2.2 North Africa/West Asia Egypt Jordan 7.3 26.2 18.9 7.7 17.3 9.6 Morocco 5.1 11.9 6.8 5.4 5.8 0.4 Turkey Yemen 7.6 23.0 15.4 8.0 6.9 -1.1 Average 13.7 Central Asia/South and Southeast Asia Bangladesh Cambodia India Indonesia Kazakhstan Kyrgyz Republic u Nepal 4.8 23.3 18.5 4.9 15.0 10.1 Philippines Turkmenistan Uzbekistan Vietnam Latin America/Caribbean Brazil Colombia Dominican Republic u Guatemala Nicaragua Peru Grand average -1.2 Note: Figures in parentheses are based on 25-49 unweighted cases. u = Unknown (not available) Consequences of Infertility Monogamous first union by childlessness and sterility status Percentage of women who are in a monogamous first union, by whether they are childless, primarily sterile, or secondarily steri Demographic and Health Surveys 1994-2000 Childless (no living children) Primarily sterile (sexually experienced) Secondarily sterile Country No Yes Yes Yes Sub-Saharan Africa Benin 29.6 (12.2) -17.4 29.4 22.0 -7.4 41.1 28.1 -13.0 Burkina Faso 28.7 22.0 -6.7 28.6 (28.0) -0.6 44.7 27.5 -17.2 Cameroon 38.5 12.4 -26.1 37.9 21.9 -16.0 47.6 35.4 -12.2 Central African Rep. 33.2 12.5 -20.7 32.7 17.5 -15.2 34.9 31.1 -3.8 Chad 36.2 13.9 -22.3 35.6 22.3 -13.3 (47.8) 35.1 -12.7 Comoros 36.0 18.0 -18.0 35.8 22.0 -13.8 48.7 33.4 -15.3 Côte dIvoire 35.6 (35.6) 36.4 22.5 -13.9 48.3 34.3 -14.0 Eritrea 59.1 25.1 -34.0 59.6 20.0 -39.6 78.3 57.1 -21.2 Ghana 37.8 (38.2) 38.0 35.0 -3.0 47.9 36.4 -11.5 Guinea 28.3 15.4 -12.9 27.9 26.0 -1.9 35.1 27.5 -7.6 Kenya 62.0 19.8 -42.2 61.9 40.6 -21.3 71.9 56.0 -15.9 Madagascar 49.5 24.1 -25.4 49.5 29.5 -20.0 66.5 45.5 -21.0 45.5 15.2 -30.3 45.4 19.3 -26.1 57.9 41.0 -16.9 38.4 21.5 -16.9 38.0 30.2 -7.8 47.9 37.3 -10.6 Mozambique 35.3 19.2 -16.1 34.9 24.5 -10.4 55.3 33.3 -22.0 Niger Nigeria 50.4 29.5 -20.9 49.6 52.2 2.6 62.2 48.2 -14.0 S. Africa 53.2 50.4 -2.8 55.4 37.0 -18.4 53.2 53.0 -0.2 Senegal Tanzania 52.8 (41.8) -11.0 53.7 31.5 -22.2 56.8 51.9 -4.9 Togo 30.6 16.4 -14.2 30.4 26.7 -3.7 34.2 29.6 -4.6 Uganda 34.8 12.6 -22.2 34.5 15.1 -19.4 40.2 33.0 -7.2 Zambia 42.1 23.9 -18.2 42.6 21.2 -21.4 63.2 38.2 -25.0 Zimbabwe 58.0 25.8 -32.2 58.1 40.8 -17.3 70.5 52.1 -18.4 Average -18.6 -14.1 -13.1 North Africa/West Asia Egypt Morocco Jordan Turkey Yemen Central Asia/South and Southeast Asia Bangladesh Cambodia 76.6 38.9 -37.7 77.5 41.7 -35.8 91.5 72.4 -19.1 India Indonesia 77.8 49.4 -28.4 78.0 62.4 -15.6 88.0 71.4 -16.6 Kazakhstan 68.5 48.2 -20.3 72.3 45.7 -26.6 73.8 64.9 -8.9 Kyrgyz Republic 77.8 (28.0) -49.8 79.9 37.1 -42.8 89.6 71.2 -18.4 Nepal 86.7 60.0 -26.7 86.9 59.5 -27.4 89.6 83.1 -6.5 Philippines 85.4 78.1 -7.3 86.1 74.3 -11.8 91.2 82.0 -9.2 Turkmenistan 81.6 52.1 -29.5 83.2 44.0 -39.2 90.3 75.7 -14.6 Uzbekistan 87.1 (17.7) -69.4 88.3 43.1 -45.2 94.4 79.6 -14.8 Vietnam Average -28.5 -28.5 -13.3 Latin America/Caribbean 76.5 76.8 0.3 78.1 54.2 -23.9 81.7 73.5 -8.2 Brazil 70.9 69.3 -1.6 71.3 67.0 -4.3 73.7 66.6 -7.1 Colombia 55.6 58.0 2.4 57.9 40.9 -17.0 61.7 47.3 -14.4 Dominican Republic 47.3 37.6 -9.7 48.5 29.1 -19.4 52.9 42.3 -10.6 Guatemala 74.3 62.9 -11.4 75.6 46.0 -29.6 77.2 73.1 -4.1 46.8 35.7 -11.1 47.3 34.1 -13.2 55.7 44.7 -11.0 Nicaragua 50.2 38.0 -12.2 51.1 34.6 -16.5 55.4 45.4 -10.0 Peru 72.8 70.4 -2.4 75.0 52.5 -22.5 78.0 67.6 -10.4 Average -5.7 -18.3 -9.5 Grand average -17.7 -17.7 -12.4 Note: Figures in parentheses are based on 25-49 unweighted cases. u = Unknown (not available The likelihood of being in a monogamous first union varies by region. Asia has the largest differences by childlessness and primary infertility (both 29 percent). In Latin America, there is a small difference by childless status (6 percent), but there is a much larger difference by primary infertility (18 percent). In sub-Saharan Africa, the differ-ence for being in a monogamous first union is greater for childless women (19 per-cent) than for women who are primarily infertility (14 percent). Seven countries have a difference in monogamous first unionship by childless status of 30 percent or more: Uzbekistan (69 percent), Kyrgyz Republic (50 percent), Kenya (42 percent), Cambodia (38 percent), Eritrea (34 percent), Zimbabwe (32 per-cent), and Malawi (30 percent). Eleven other countries have differences of 20 to 29 percent. For primary infertility, five countries have differences of 30 percent or more: Uzbekistan (45 percent), Kyrgyz Republic (43 percent), Eritrea (40 percent), Turk-menistan (39 percent), and Cambodia (36 percent). Ten other countries have differ-ences of 20 to 29 percent. For secondary sterility, four countries have differences in being in a monogamous first union that are 20 percent or more: Zambia (25 per-cent), Mozambique (22 percent), and Eritrea and Madagascar (both 21 percent). In summary, childlessness and infertility have consequences for a woman’s chances of being in a stable relationship, whether through lowering her chances of entering into marriage, raising her chances of being divorced or separated, or increasing the chances that her husband will take another wife. There was no information on the possibility that a woman in union who is childless may seek to obtain another husband or partner because her first husbanChildlessness and infertility have consequences for a being in a stable relationship. Coping with Infertility through Adoption he most important way for couples to cope with infertility is to adopt children. The information contained in the DHS surveys can give an insight into the ex-tent of this process. All family members are listed on the household schedule of the DHS household questionnaire. For persons under 15 years of age, the biological mother and father are identified if they are residing in the household. If not, then the survival status of each of the parents is ascertained. Thus, whether a household has children whose biological parents do not live in the household can be determined. We consider that these children are “adopted,” whether formally or informally. Table 17 shows the percentage of women living in a household with one or more adopted children according to childlessness and infertility status. We cannot definitely deter-mine whether the couple has adopted the child or children if there is more than one couple in the household; however, if childless or infertile couples live in households with adopted children, we assume that they adopted the children. Table 17 indicates that, overall, childless women are 15 percent more likely to live in households with adopted children than are women with their own children. The difference for women with primary infertility is 7 percent. Interestingly, women with secondary infertility are no more likely to live in a household with adopted children than are women who can have more children. By country, the difference in adoption rates by childlessness is greatest in Turk-menistan (41 percent) and Niger (33 percent). In sub-Saharan Africa, adoption is common even among couples that have no fertility impairment. However, childless-ness and infertility increase adoption rates on average by 17 and 11 percent, respec-tively. In five countries in West Africa, more than half of the couples who are child-less live in households with adopted children under age 15: Niger (61 percent), Guinea (59 percent), Benin (56 percent), Togo (56 percent), and Cameroon (53 per-Childless women are 15 percent more likely to live in households with adopted children than are women with their own Coping with Infertility through Adoption Table 17 Adoption of children by childlessness and sterility status Percentage of women living in households with one or more adopted children, by whether the women are childless, primarily ster- ile, or secondarily sterile, Demographic and Health Surveys 1994-2000 Childless (no living children) Primarily sterile (ever-married women) Secondarily sterile Country Sub-Saharan Africa Benin 38.0 56.2 18.2 37.9 61.0 23.1 40.4 38.1 -2.3 Burkina Faso u Cameroon 30.6 53.3 22.7 31.3 44.6 13.3 23.5 33.2 9.7 Central African Rep. 31.0 46.1 15.1 31.8 38.3 6.5 37.7 32.0 -5.7 Chad 22.2 38.5 16.3 22.3 42.5 20.2 (33.0) 22.7 -10.3 Comoros 26.0 51.0 25.0 26.5 42.0 15.5 36.0 25.6 -10.4 Côte dIvoire u Eritrea 24.4 16.0 8.7 15.6 6.9 9.2 9.0 -0.2 Ghana 20.5 43.4 22.9 21.1 21.1 0.0 19.0 21.4 2.4 Guinea 40.0 59.3 19.3 40.2 57.6 17.4 49.7 40.3 -9.4 Kenya 15.5 27.3 11.8 15.7 17.3 1.6 12.6 17.3 4.7 Madagascar 17.7 40.8 23.1 18.2 31.6 13.4 15.9 19.4 3.5 18.6 32.9 14.3 18.9 25.1 6.2 15.2 20.2 5.0 19.5 44.3 24.8 19.9 39.4 19.5 37.0 19.7 -17.3 Mozambique 27.3 39.9 12.6 27.3 43.8 16.5 28.5 27.9 -0.6 Niger 28.4 61.3 32.9 29.2 51.4 22.2 22.8 30.4 7.6 Nigeria 22.9 33.0 10.1 23.2 22.7 -0.5 20.4 23.7 3.3 S. Africa 18.8 31.4 12.6 19.2 18.4 -0.8 17.4 20.6 3.2 Senegal Tanzania 28.0 (41.8) 13.8 28.2 32.1 3.9 28.9 28.3 -0.6 Togo 35.0 55.5 20.5 34.9 51.0 16.1 37.2 35.2 -2.0 Uganda 30.3 47.2 16.9 30.4 48.5 18.1 37.5 30.2 -7.3 Zambia 29.7 32.7 29.2 44.4 15.2 30.5 29.7 -0.8 Zimbabwe 20.6 32.4 11.8 20.9 21.9 1.0 17.4 22.5 5.1 Average 17.3 11.2 -1.1 North Africa/West Asia Egypt 1.9 4.2 2.3 1.4 2.7 1.3 Jordan 1.8 5.1 3.3 1.6 2.2 0.6 Morocco 10.8 20.5 10.9 19.5 8.6 10.4 12.0 1.6 Turkey 2.0 2.1 0.1 2.0 2.0 0.0 Yemen 14.1 4.9 6.5 1.6 4.6 5.1 0.5 Average Central Asia/South and Southeast Asia Bangladesh Cambodia 30.8 24.0 7.3 12.3 5.0 10.2 6.7 -3.5 India Indonesia 21.3 16.8 4.9 8.2 3.3 3.5 6.0 2.5 Kazakhstan 10.0 3.0 4.8 1.8 2.6 3.7 1.1 Kyrgyz Republic 5.6 (14.3) 5.9 4.9 -1.0 2.2 7.6 5.4 Nepal Philippines Turkmenistan 43.7 40.6 3.7 9.2 5.5 3.1 4.5 1.4 Uzbekistan (9.3) 1.3 2.1 0.8 0.9 1.7 0.8 Vietnam Average 19.4 Latin America/Caribbean 21.3 14.4 6.9 10.4 3.5 7.1 7.0 -0.1 Brazil 21.6 13.6 8.6 6.3 -2.3 8.0 9.0 1.0 Colombia 14.9 9.5 9.0 -0.5 9.6 9.4 -0.2 Dominican Republic 19.2 25.7 19.5 18.1 -1.4 20.3 18.6 -1.7 Guatemala 22.4 14.3 8.3 8.1 -0.2 8.7 8.2 -0.5 24.3 39.6 15.3 24.3 34.6 10.3 25.8 24.8 -1.0 Nicaragua 15.1 20.9 15.0 18.5 3.5 14.3 16.1 1.8 Peru 15.9 7.0 7.9 0.9 6.7 7.4 0.7 Average 10.6 Grand average 14.9 -0.3 Note: Figures in parentheses are based on 25-49 unweighted cases u = Unknown (not available) Conclusions 8 Conclusions ive measures of fertility impairment are used in this report: childlessness, primary infertility, self-reported infecundity, secondary infertility, and secondary infecun-Childlessness varies from less than 1 percent among married women age 40 to 44 in the Kyrgyz Republic, Uzbekistan, and Vietnam to more than 10 percent in the Central African Republic. These levels are lower than those reported by the World Fertility Survey. In almost all of the countries included in this report, at least 96 per-cent of married women can expect to have one or more surviving children. Sexual intercourse begins early for most women. By age 25 to 29, 94 percent of women have had sexual relations at least once. For women age 25 to 49 (standard-ized), the Philippines has the lowest proportion of women with sexual experience (88 percent). The highest proportions occur in sub-Saharan Africa, where almost all women age 25 to 49 are sexually experienced. Among sexually experienced women age 25 to 49 (standardized), the proportion who have not had a pregnancy varies from 2 to 18 percent, with slightly higher per-centages for women who have not had a birth. Some women do not want to have any children. Among women with no living children, those whose ideal is to have no children varies from 3 to 6 percent. Self-reports of infecundity vary substantially by age, decreasing somewhat for ages 15 to 19 and then increasing especially for women over 30. Standardizing for age dis-tributions allows comparison across countries for the broad age group women 25 to 49. Senegalese women are the least likely to report themselves as infecund in this age group (5 percent) while Cambodian women are the most likely (35 percent). Women who have borne children can be subject to secondary infertility, indicated here by women who have not had a child in the past five years (excluding women who used contraception). Overall, secondary infertility increases sharply with age from 5 percent at age 20 to 24 to 62 percent at age 45 to 49 years. Vietnam (9 per-cent) and Cambodia (38 percent) are the countries with the lowest and highest age-standardized levels of secondary infecundity for women age 25 to 49. It is estimated that by the middle of 2002, about 186 million ever-married women age 15 to 49 were infertile, because of primary or secondary infertility, in developing countries, exclAssessing trends by using comparable data shows that infertility, whether primary or secondary, has declined in most countries. When comparing data on the percent-age of women reporting no live births at two points in time roughly 20 years apart, fewer women age 25 to 49 reported no live births in the DHS surveys compared with the WFS surveys for 11 countries that were included in both survey programs, except in Bangladesh. Comparing data from DHS surveys in the same country yields mixed results, but for most countries there has been a decline in the percentage of women reporting no pregnancy or no live birth in the past five years. Among the countries has been a decline in the percentage of women reporting no pregnancy or no live birth in the past most affected by the HIV pandemic, no pattern was seen for increases or declines in infertility. Overall, reductions in infertility were seen for several countries, but impor-tant exceptions were also noted. Infertility has consequences for women’s marital status. Women who have never had a child are much more likely to be divorced or separated. In Nicaragua, the Do-minican Republic, and Eritrea, more than 40 percent of women who have never had a child are currently separated or divorced. Childless women are also more likely to have married more than once. In some cultures a woman needs to prove her fecundity in order to marry. Overall, for women age 30 or older who have had sexual relations, those who are primarily sterile are 7 percent more likely to have never married or lived in a consensual union. This percentage rises to 10 In cultures where polygyny is allowed, a man may take another wife if his first wife is childless. Differences in polygyny by childless status of the first wife vary substan-tially. In four of the countries discussed, women are at least 15 percent more likely to be in a polygynous union if they are childless than if they have a child. An important way of coping with infertility is adoption. Childless women are 15 percent more likely to live in households with an adopted child than are women with their own children. In five West African countries more than half of childless couples live in households with adopted children. An important way of coping with infertility is adoption. In five West African countries more than half of childless couples live in households with adopted children. References Arnold, F. 1990. Assessment of the quality of birth history data in the Demographic and Health Surveys. In An assessment of DHS-I data quality. DHS Methodological Reports No. 1. Columbia, Maryland: Institute for Resource Development/Macro Systems Inc. 83-110. Bongaarts, J., O. Frank, and R. Lesthaeghe. 1984. The proximate determinants of fertility in sub-Saharan Africa.[Unpublished]. Paper prepared for the World Bank. Frank, O. 1983. Infertility in sub-Saharan Africa: Estimates and implications.lation and Development Review 9(1): 137-144. Goldman, N. 1985. Assessment of fertility data collected in WFS individual surveys. Assessment of the quality of data in 41 WFS surveys: A comparative approach. WFS Comparative Studies No. 44. Voorburg, The Netherlands: International Statistical Institute. 7-20. Gregson, S., B. Zaba, and S.C. Hunter. 2002. The impact of HIV 1 on fertility in sub-Saharan Africa: Causes and consequences. Presented at the Expert Group Meet-ing on Completing the Fertility Transition, March 11-14, 2002. New York: United Nations Population Division. Larsen, U., and J. Menken. 1989. Measuring sterility from incomplete birth histories. 26: 185-201. Larsen, U., and H. Raggers. 2001. Levels and trends of infertility in sub-Saharan Women and infertility in sub-Saharan Africa: A multi-disciplinary perspectiveed. J. Boerma and Z. Mgalla. Amsterdam: The Netherlands: Royal Tropical Insti-tute. 25-70. Mammo, A., and S.P. Morgan. 1986. Childlessness in rural EthiopiaPopulation and 12(3): 533-46. Mtimavalye, L.A., and M.A. Belsey. 1987. Infertility and sexually transmitted dis-ease: Major problems in maternal and child health and family planningPaper pre-sented at International Conference on Better Health for Women and Children through Family Planning, Nairobi, Kenya, October 5-9, 1987. Rutstein, S. 1985. Assessment of the quality of age reports for eligibility and analysis. Assessment of the quality of data in 41 WFS surveys: A comparative approach. WFS Comparative Studies No. 44. Voorburg, The Netherlands: International Statistical Institute. 38-61. Rutstein, S., and G. Bicego. 1990. Assessment of the quality of data used to ascertain eligibility and age in the Demographic and Health Surveys. In An assessment of DHS–I data quality. DHS Methodological Reports No. 1. Columbia, Maryland: In-stitute for Resource Development/Macro Systems. 5-37. Sherris, J.D., and G. Fox. 1983. Infertility and sexually transmitted disease: A public health challengePopulation Reports, Series L, No. 4. Population Information Pro-gram, The Johns Hopkins University, Baltimore, Maryland. Singh, V.K. 1989. Estimation of fecundability and risk of foetal wastage from data on straddling birth intervals.Population transition in India, Vol. 1, ed. S.N. Singh, M.K. Premi, P.S. Bhatia, and A. Bose. Delhi, India: B.R. Publishing. 401-9. United Nations. 2003. World population prospects: The 2002 revision. Vol. 2, Sex and age distribution of populations. New York: United Nations Population Division (ST/ESA/SER.A/223). Vaessen, M. 1984. Childlessness and infecundity. WFS Comparative Studies No. 31. Voorburg, The Netherlands: International Statistical Institute. Vayena, E., P. Rowe, and P.D. Griffin, eds. 2002. Current practices and controversies in assisted reproduction: Report of a WHO meeting. Geneva: World Health Organiza-tion. World Health Organization. 1975. The epidemiology of infertility. Report of WHO Sci-entific Group on the Epidemiology of Infertility. Technical Report Series No. 582. Ge-neva: World Health Organization. World Health Organization. 2001. Reproductive health indicators for global monitoring: Report of the second interagency meetingGeneva: World Health Organization.WHO/RHR/01.19. Westoff, Charles F. 2001. Unmet Need at the End of the CenturyWestoff, Charles F. and Akinrinola Bankole. 2002. Reproductive Preferences in Developing Countries at the Turn of the CenturyRutstein, Shea O. 2002. Fertility Levels, Trends, and Differentials 1995-1999Mahy, Mary. 2003. Childhood Mortality in the Developing World: A Review of Evidence from Westoff, Charles F. 2003. Trends in Marriage and Early Childbearing in Developing CountriesRutstein, Shea O. and Kiersten Johnson. 2004. The DHS Wealth IndexYoder, P. Stanley, Noureddine Abderrahim, and Arlinda Zhuzhuni. 2004. Female Genital Cutting in the Demographic and Health Surveys: A Critical and Comparative AnalysisStallings, Rebecca. 2004. Rutstein, Shea O. and Iqbal H. Shah. 2004. Infecundity, Infertility, and Childlessness in DHS Comparative Re ports Infecrnaitv, Infeotiiitv, ana Ceiiaieppnepp in Deseioming Corntoiep