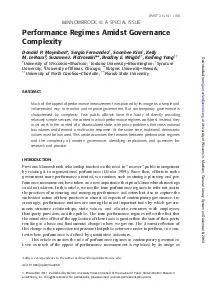
/
Figure 1. Smith, et al (1984) mapped soil temperature regimes in the N Figure 1. Smith, et al (1984) mapped soil temperature regimes in the N

Figure 1. Smith, et al (1984) mapped soil temperature regimes in the N - PDF document

karlyn-bohler
karlyn-bohler . @karlyn-bohler
Follow
401 views
Uploaded On 2016-12-21

Figure 1. Smith, et al (1984) mapped soil temperature regimes in the N - PPT Presentation

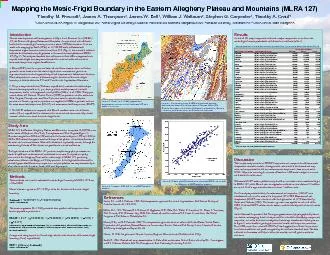
Figure 3 Location of MLRA 127 and NWS weather stations ReferencesCarter BJ and EJ Ciolkosz 1980 Soil temperature regimes of the central Appalachians Soil Science Society of America Journal ID: 504324

Figure Location MLRA

Share:

Link:

Embed:

Download Presentation from below link

Download Pdf The PPT/PDF document "Figure 1. Smith, et al (1984) mapped soi..." is the property of its rightful owner. Permission is granted to download and print the materials on this web site for personal, non-commercial use only, and to display it on your personal computer provided you do not modify the materials and that you retain all copyright notices contained in the materials. By downloading content from our website, you accept the terms of this agreement.


Presentation Transcript

Figure 1. Smith, et al (1984) mapped soil temperature regimes in the Northeast U.S. at a scale 1:2,500,000. Figure 3. Location of MLRA 127 and NWS weather stations. ReferencesCarter, B.J. and E.J. Ciolkosz. 1980. Soil temperature regimes of the central Appalachians. Soil Science Society of America Journal. 44: 1052-1058.Miller, D.A., W.J. Waltman, E.J. Ciolkosz, K. Eggleston, B.W. Bills, R.A. White, S. Crawford, J.L. Sloan, J. Voortman, T.M. Prescott, S.W. Waltman. July, 2006.Soil climate Poster Presentation, 18World Congress of Soil ScienMount, H.R., and R.F. Paetzold. 2002. The temperature tegimefor selected soils in the United States. United States Department of Agriculture, Natural Resources Conservation Service, National Soil Survey Center, Lincoln, Nebraska, Soil Survey Investigations Report No. 48.Olivier, H. 1964. Irrigation and Climate. London, England. Edward Arnold Publishers Ltd. 250 p. y = 0.8456x + 8.6826 = 0.795642.0044.0046.0048.0050.0052.0054.0056.0058.0042.044.046.048.050.052.054.056.058.0Observed MASTPredicted MAST Benchmark Soil SeriesTaxonomic SubgroupWaltmanMountCraulHazletonMESIC TYPIC DYSTRUDEPTS75916135327679673CookportMESIC AQUIC FRAGIUDULTS49168123764576390HartletonMESIC TYPIC HAPLUDULTS41333931004219395DekalbMESIC TYPIC DYSTRUDEPTS29396323055865418Leck KillMESIC TYPIC HAPLUDULTS24944116337114964GilpinMESIC TYPIC HAPLUDULTS23599714074723834BuchananMESIC AQUIC FRAGIUDULTS21565711697821390