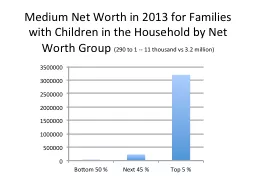
Jimmie R Alford LLD LHD Founder and Chair The Alford Group Percentage of High Net Worth Households Who Gave to Any Charity 2005 2011 Source The 2012 Study of High Net Worth Philanthropy ID: 594622
Download Presentation The PPT/PDF document "High Net-Worth Household Giving" is the property of its rightful owner. Permission is granted to download and print the materials on this web site for personal, non-commercial use only, and to display it on your personal computer provided you do not modify the materials and that you retain all copyright notices contained in the materials. By downloading content from our website, you accept the terms of this agreement.
Slide1
High Net-Worth Household Giving
Jimmie R. Alford, LL.D., LH.D.
Founder and Chair, The Alford GroupSlide2
Percentage of High Net Worth Households Who Gave to Any Charity, 2005 – 2011
Source:
The 2012 Study of High Net Worth Philanthropy
/ Bank of America 2012
2Slide3
Average Amount Given by High Net Worth Donor Households, 2007 and 2009
Source:
The 2012 Study of High Net Worth Philanthropy
/ Bank of America 2012
2009 Average Giving
2011 Average Giving
Percent Difference
Total$56,621 $52,770 -6.8%Religious$10,467 $10,144 -3.1%Secular$49,111 $46,216 -5.9%Education$13,374 $18,798 40.6%International$4,808 $5,831 21.3%Basic Needs$3,101 $3,643 17.5%Health$4,728 $5,102 7.9%Giving Vehicle$79,526 $77,150 -3.0%Youth/Family Services$8,009 $7,125 -11.0%Environment/Animal Care$3,574 $2,718 -24.0%Combination$5,493 $4,087 -25.6%Other$6,633 $4,810 -27.5%Arts$5,798 $3,952 -31.8%Values adjusted for inflation to 2011 dollars. Combined organizations include United Way, United Jewish Appeal, or Catholic Charities. 'Giving Vehicle' represents gifts to private foundations, charitable trusts, and donor-advised funds
3Slide4
Strong Commitment to Giving
Nearly $
300 billion given away in
2011More than 70% was given by individuals, of which roughly half was given by the wealthiest
3% of American households.Among wealthy households, average giving held steady at approximately
9% between
2009 and
2011.
Between 2007 and 2009, giving as percentage of household income declined 2%.4Source: The 2012 Study of High Net Worth Philanthropy/ Bank of America 2012Slide5
Wealthy Donor Charitable Giving Forecast for the Next 3-5 Years
Source:
The 2012 Study of High Net Worth Philanthropy
/ Bank of America 2012
5Slide6
Volunteerism on the Rise
Generally
, high net worth individuals who volunteer tend to also give financial gifts, and those who volunteer more tend to give more
.Last year, those who volunteered more than 100 hours gave more than $78,000 on average, roughly twice the average gift among those who volunteered fewer than 100 hours, which was approximately $39,000.
Increasingly, high net worth individuals are giving their contributions to organizations where they both volunteer and believe their gift will have the largest impact.Average gifts to these organizations grew
40% between
2009 and 2011 (from $73,301 to $102,642
).
6Source: The 2012 Study of High Net Worth Philanthropy/ Bank of America 2012Slide7
Volunteerism on the Rise
The
most common volunteer
activities for high net worth individuals last year:Serving on a nonprofit board of
directors 61%Event planning 48%Fundraising activities 48%Providing financial services (business/marketing) 40%
67%
of wealthy donors reported that they give more to organizations where they serve on a board or are in an oversight role
.
7Source: The 2012 Study of High Net Worth Philanthropy/ Bank of America 2012Slide8
Volunteerism on the Rise
43% volunteer
because they feel passionate about the cause supported by the organization and therefore approached them about opportunities to get
involved31% indicated that it was the organization that approached them to volunteer.
8
Source:
The 2012 Study of High Net Worth Philanthropy
/ Bank of America 2012Slide9
Percentage of High Net Worth Individuals Who Volunteered in 2007, 2009, 2011
Source:
The 2012 Study of High Net Worth Philanthropy
/ Bank of America 2012
9Slide10
Distribution of Hours Volunteered by High Net Worth Individuals, 2011
Source:
The 2012 Study of High Net Worth Philanthropy
/ Bank of America 2012
10Slide11
Percentage of Hours High Net Worth Individuals Volunteered, 2007, 2009, 2011
Source:
The 2012 Study of High Net Worth Philanthropy
/ Bank of America 2012
11Slide12
Donors Give Strategically
The
majority of wealthy donors gives strategically and has a plan for their
giving71% had a specific strategy in place to guide their charitable giving last year
61% had a budget set aside for their philanthropic activities81% of donors apply a certain level of focus to their charitable activity, giving to organizations based on geography or a specific cause or issue.
16% give
with no particular focus to a large number of organizations
.
5% have a formal mission statement to guide their giving12Source: The 2012 Study of High Net Worth Philanthropy/ Bank of America 2012Slide13
Donors Give Strategically
19% using giving vehicles in
2011,
up from 16% in 2009.On average, the dollar amount given to these vehicles was greater than average giving to any specific nonprofit subsector last year
.13
Source:
The 2012 Study of High Net Worth Philanthropy
/ Bank of America 2012Slide14
Donors Give Strategically
26% of
wealthy donors reported having a private foundation or donor-advised
fund5% planned to establish one during the next three years18% have
an endowment fund with a particular organization16% use a charitable remainder trustAmong all giving vehicles, the 43% of wealthy donors still primarily utilize charitable provisions in a
will
14
Source:
The 2012 Study of High Net Worth Philanthropy/ Bank of America 2012Slide15
Donors Give Strategically
40% of
wealthy donors consulted at least one type of outside advisor about their charitable giving in 2011
.Among those donors who sought advice from at least one source last year, most consulted accountants (53%), followed by financial or wealth advisors (
37%) and nonprofit personnel (33%).
15
Source:
The 2012 Study of High Net Worth Philanthropy
/ Bank of America 2012Slide16
High Net Worth Households Who Consulted Others When Making Charitable Giving Decisions by Type of Person Consulted
Source:
The 2012 Study of High Net Worth Philanthropy
/ Bank of America 2012
16Slide17
Giving Distribution and Objectives
In
2011, the greatest percentages of high net worth households gave
to:Educational 80%Basic Need 79%
Arts 69%Health 65%Religious 65%
17
Source:
The 2012 Study of High Net Worth Philanthropy
/ Bank of America 2012Slide18
Giving Distribution and Objectives
The
three areas receiving the largest proportion of gift dollars from wealthy donors last year
were:Education 28%Giving Vehicles 23%
Religious Organizations 13%These three areas received the largest proportion of gift dollars in 2009 as well.
18
Source:
The 2012 Study of High Net Worth Philanthropy
/ Bank of America 2012Slide19
Giving Distribution and Objectives
The
average dollar amount gifted per high net worth household declined
7% between 2009 and 2011, from $56,621 to $52,770 (adjusted for inflation).Consistent
with their funding priorities from 2009, largest gifts went to the following objectives:general operations 61%particular program or
activity 30%
organizational expansion/ innovation 21%
19
Source: The 2012 Study of High Net Worth Philanthropy/ Bank of America 2012Slide20
Distribution of High Net Worth Giving by Subsector, 2011
Source:
The 2012 Study of High Net Worth Philanthropy
/ Bank of America 2012
20Slide21
Giving Distribution and Objectives
Respondents
were asked whether the allocation of their contributions to fund nonprofits’ general operations and specific programs changed between 2010 and 2011 in light of the economic environment
.Compared to 2010, 32%
of high net worth households gave more to fund the general operations of an organization in 2011.30% of wealthy donors gave more in 2011 to fund special programs than they did in 2010.
21
Source:
The 2012 Study of High Net Worth Philanthropy
/ Bank of America 2012Slide22
What Motivates High Net Worth Households to Give?
Source:
The 2012 Study of High Net Worth Philanthropy
/ Bank of America 2012
22Slide23
Tax Motivations
32%
of donors cited tax advantages among their chief motivators for giving
.50% reported that they would maintain their current charitable giving levels even if income tax deductions for donations were eliminated.
95% would maintain or increase their bequest giving even if tax deductions for estate giving were permanently eliminated.
23
Source:
The 2012 Study of High Net Worth Philanthropy
/ Bank of America 2012Slide24
Change in Estate Plans if the Estate Tax were Permanently Eliminated, 2005, 2007, 2009, 2011
Source:
The 2012 Study of High Net Worth Philanthropy
/ Bank of America 2012
24Slide25
Giving Motivations
78% of wealthy donors enjoy a sense of fulfillment based on their philanthropic engagement (giving or volunteering).
75% gain satisfaction from the impact their charitable activities have on the people and world around them.
76% feel a sense of accomplishment when these activities produce positive results .18% feel the need for visibility or recognition based on these activities.
25
Source:
The 2012 Study of High Net Worth Philanthropy
/ Bank of America 2012Slide26
Ranking of Motivations for Giving to Charity,
2007, 2009, 2011
Source:
The 2012 Study of High Net Worth Philanthropy/ Bank of America 2012
"On a scale of 1 to 5, do you usually give because of [or to]…?"
2007
2009
2011
%Rank%Rank%RankMoved at How a Gift Can Make a Difference66.9%372.4%174.0%1Feeling Financially Secure65.3%471.2%270.8%2Support same Organizations/Causes Annually70.7%265.9%4
68.5%
3
Giving to an Efficient
Organization
N/A
N/A
71.0%
3
68.2%
4
Give Back to the Community
81.2%
1
64.7%
5
62.0%
5
Volunteer for the Organization
N/A
N/A
51.9%
7
53.4%
6
Political/Philosophical Beliefs
58.5%
5
52.1%
6
48.8%
7
Remedy Issues Affecting Me Personally
57.5%
6
43.8%
9
41.7%
8
Religious Beliefs
51.0%
7
38.8%
10
40.3%
9
Give Spontaneously to Support a Need
N/A
N/A
47.1%
8
39.8%
10
Tax Benefit
N/A
N/A
N/A
N/A
31.7%
11
Set Example for Young People
45.6%
9
27.1%
12
28.3%
12
Being Asked*
48.1%
8
31.1%
11
23.0%
13
Further Legacy of Others
18.2%
10
19.7%
13
19.8%
14
Other (e.g., social norms)
N/A
N/A
19.6%
14
10.3%
15
Business Interests
5.3%
11
4.9%
153.9%16
26Slide27
How Donors Gave…
And How They Plan to Give
Source:
The 2012 Study of High Net Worth Philanthropy/ Bank of America 2012
27Slide28
Factors Ranked as Important to High Net Worth Donors When Making a Charitable Gift, 2011
Source:
The 2012 Study of High Net Worth Philanthropy
/ Bank of America 2012
28Slide29
Donor
Expectations and
Why They Stop Giving
In 2011, 30% of wealthy donors stopped giving to at least one nonprofit organization they previously supported, among which
27% stopped giving to one organization and 32% stopped giving to two.
29
Source:
The 2012 Study of High Net Worth Philanthropy
/ Bank of America 2012Slide30
Reasons Why a High Net Worth Household Stopped Supporting an Organization They Previously Supported
Source:
The 2012 Study of High Net Worth Philanthropy
/ Bank of America 2012
30Slide31
Family Traditions and Preparing the Next Generation
Many
high net worth households have family traditions around giving (
41%), such as volunteering as a family and giving to charity during the holidays. 26% of
wealthy donors cited the joy they derive from engaging with family around charitable activities among the benefits of giving. 43% make more charitable contributions during the “giving season” than during the rest of the
year
44% spread
their giving evenly throughout the
year31Source: The 2012 Study of High Net Worth Philanthropy/ Bank of America 2012Slide32
Family Traditions and Preparing the Next Generation
33%
of high net worth donors who have children involve them and other younger relatives in their household’s charitable giving activities
.The 2012 study found that a family’s personal efforts and those of their network of friends or peers continue to be the leading sources by which children, grandchildren and other younger relatives learn about charitable giving (
51%), followed by religious organizations (34%) and nonprofits themselves (21%).
32
Source:
The 2012 Study of High Net Worth Philanthropy
/ Bank of America 2012Slide33
Family Traditions and Preparing the Next Generation
Given
the unprecedented intergenerational transfer of wealth in the coming years, advisors to the wealthy also have a significant opportunity to guide the current and next generation of philanthropists
.
33
Source:
The 2012 Study of High Net Worth Philanthropy
/ Bank of America 2012Slide34
Family Traditions and Preparing the Next Generation
Respondents
from
46% of high net worth households reported that they make decisions about their giving jointly with their spouse or partner – even when deciding where to give their largest gift (48%).
This is consistent with decision making about the broader management of their wealth, with 48% citing that wealth management decisions are made jointly.
34
Source:
The 2012 Study of High Net Worth Philanthropy
/ Bank of America 2012Slide35
Societal issues facing America and confidence in those working to address
them
Among
the leading societal and public policy issues that matter most to wealthy donors today are education (60%) and health care (45%),
followed by the economy (38%), poverty (34%) and the federal deficit (33%). Our 2012 study found that nearly one-third (
29%)
of wealthy donors changed their giving priorities last year in response to the economic downturn
.
35Source: The 2012 Study of High Net Worth Philanthropy/ Bank of America 2012Slide36
Percentage of High Net Worth Individuals' Confidence in Groups to Solve Societal or Global Problems
Source:
The 2012 Study of High Net Worth Philanthropy
/ Bank of America 2012
36Slide37
Political Giving
51%
of high net worth donors gave to political causes in 2011 for the purpose of electing or defeating a candidate
.According to an earlier American National Election Study 13% of the general population makes political
contributions.37
Source:
The 2012 Study of High Net Worth Philanthropy
/ Bank of America 2012Slide38
Questions?
Discussion!
38Slide39
Thank You !
39