/
Historical Corn Yields by County File A March  www Historical Corn Yields by County File A March  www

Historical Corn Yields by County File A March www - PDF document

karlyn-bohler
karlyn-bohler . @karlyn-bohler
Follow
475 views
Uploaded On 2014-11-11

Historical Corn Yields by County File A March www - PPT Presentation

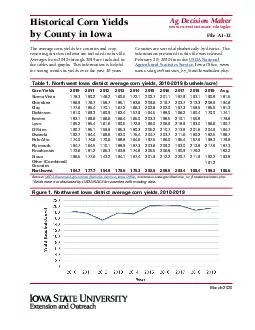
extensioniastateeduagdm Corn Yields 2004 2005 2006 2007 2008 2009 2010 2011 2012 2013 Avg Buena Vista 193 185 143 163 179 192 178 180 148 161 172 Cherokee 187 186 144 167 196 203 187 177 159 186 179 Clay 183 183 160 164 175 185 178 185 170 168 175 Di ID: 10301

extensioniastateeduagdm Corn Yields 2004 2005

Share:

Link:

Embed:

Download Presentation from below link

Download Pdf The PPT/PDF document "Historical Corn Yields by County File A ..." is the property of its rightful owner. Permission is granted to download and print the materials on this web site for personal, non-commercial use only, and to display it on your personal computer provided you do not modify the materials and that you retain all copyright notices contained in the materials. By downloading content from our website, you accept the terms of this agreement.


Presentation Transcript

Page 9 Table 9. Southeast Iowa district average corn yields, 2010-2019 (bushels/acre) Corn Yields 2010 2011 2012 2013 2014 2015 2016 2017 2018 2019 Avg. Davis 84.0 97.8 52.4 146.7 184.2 142.4 188.7 107.3 160.0 129.3 Des Moines 112.1 146.6 143.7 165.4 199.0 176.0 210.0 200.1 195.4 176.9 172.5 Henry 109.0 123.2 132.0 160.4 196.6 178.4 199.0 196.4 189.7 164.5 164.9 Jefferson 98.5 112.4 102.8 145.5 200.9 168.2 197.0 165.5 198.8 162.7 155.2 Keokuk 111.2 152.4 113.0 156.7 193.2 181.0 208.6 176.4 203.7 175.5 167.2 Lee 103.2 105.2 116.0 144.1 200.6 145.1 194.6 178.0 201.3 172.5 156.1 Louisa 125.1 148.9 162.9 158.5 188.2 181.7 200.2 216.6 196.5 174.6 175.3 Mahaska 116.6 165.0 133.0 168.6 189.9 190.3 204.7 177.2 207.7 189.9 174.3 Van Buren 90.8 100.9 110.3 144.1 192.2 158.3 189.0 128.2 180.9 171.0 146.6 Wapello 100.2 127.3 92.6 150.4 195.2 159.3 196.9 153.0 176.5 150.2 Washington 132.5 156.3 132.1 159.0 191.3 195.0 208.2 220.4 214.3 178.9 178.8 Other (Combined) Counties 176.9 Southeast 111.4 137.3 122.1 156.4 193.6 175.0 201.4 182.2 198.4 174.9 165.3 Source: USDA National Agricultural Statistics Service, Iowa Office , www.nass.usda.gov/Statistics_by_State/Iowa/index.php . * Yields were not disclosed by USDA NASS for counties with missing data. Figure 9. Southeast Iowa district average corn yields, 2010-2019 File A1-12, Historical Corn Yields by County in Iowa Page 8 Table 8. South Central Iowa district average corn yields, 2010-2019 (bushels/acre) Corn Yields 2010 2011 2012 2013 2014 2015 2016 2017 2018 2019 Avg. Appanoose 75.2 120.1 44.5 109.1 170.9 154.3 186.3 170.0 166.8 133.0 Clarke 84.5 107.7 76.7 126.5 162.2 152.4 163.9 161.8 129.5 Decatur 94.3 126.1 61.2 131.2 164.0 162.7 181.1 172.5 136.6 Lucas 71.2 114.9 85.3 117.9 153.7 154.8 174.6 124.6 Madison 124.6 145.1 101.4 140.9 171.4 169.6 185.5 173.1 167.8 175.7 155.5 Marion 112.7 152.6 115.1 156.4 171.6 178.1 198.0 185.7 190.2 170.7 163.1 Monroe 77.4 112.5 67.3 115.3 175.7 180.0 169.9 167.0 162.3 136.4 Ringgold 94.1 118.7 71.6 121.1 166.4 147.8 179.5 167.8 153.3 135.6 Union 113.2 132.6 87.3 137.0 176.1 183.0 147.9 155.8 168.9 144.6 Warren 102.4 129.1 103.5 146.7 169.9 170.3 184.6 183.2 163.6 150.4 Wayne 73.1 126.0 55.7 125.1 171.9 158.0 174.5 171.6 151.5 134.2 Other (Combined) Counties 164.0 129.7 142.6 152.3 147.2 South Central 98.0 129.6 84.8 133.5 169.5 163.2 182.8 159.9 165.3 161.0 144.8 Source: USDA National Agricultural Statistics Service, Iowa Office , www.nass.usda.gov/Statistics_by_State/Iowa/index.php . * Yields were not disclosed by USDA NASS for counties with missing data. Figure 8. South Central Iowa district average corn yields, 2010-2019 File A1-12, Historical Corn Yields by County in Iowa Page 7 Table 7. Southwest Iowa district average corn yields, 2010-2019 (bushels/acre) Corn Yields 2010 2011 2012 2013 2014 2015 2016 2017 2018 2019 Avg. Adair 139.1 152.8 104.4 137.8 169.3 176.5 190.3 175.2 149.5 176.6 157.2 Adams 139.3 151.7 109.8 147.6 169.9 169.6 187.4 179.9 171.6 158.5 Cass 155.1 175.2 120.4 159.5 173.7 193.7 195.9 197.4 169.5 200.3 174.1 Fremont 152.7 155.6 131.2 159.9 191.5 179.9 180.8 204.5 195.1 172.4 Mills 160.2 155.0 128.8 171.0 184.9 188.4 190.1 202.9 172.7 Montgomery 157.0 153.2 132.0 154.0 163.1 185.2 185.5 199.1 191.5 204.8 172.5 Page 150.1 136.2 116.2 154.5 182.4 165.8 185.8 193.1 188.1 191.4 166.4 Pottawattamie 164.8 170.9 131.9 179.4 169.1 204.0 210.4 195.8 208.0 181.6 Taylor 122.2 140.5 91.7 136.2 178.8 159.9 175.0 154.4 161.7 146.7 Other (Combined) Counties 172.4 196.7 189.6 186.2 Southwest 151.9 157.5 121.1 159.2 175.4 183.9 191.1 191.7 182.1 194.2 170.8 Source: USDA National Agricultural Statistics Service, Iowa Office , www.nass.usda.gov/Statistics_by_State/Iowa/index.php . * Yields were not disclosed by USDA NASS for counties with missing data. Figure 7. Southwest Iowa district average corn yields, 2010-2019 Page 6 Table 6. East Central Iowa district average corn yields, 2010-2019 (bushels/acre) Corn Yields 2010 2011 2012 2013 2014 2015 2016 2017 2018 2019 Avg. Benton 179.0 157.2 129.3 163.7 185.4 187.5 199.9 215.3 214.6 197.6 183.0 Cedar 174.4 184.9 158.9 169.7 184.1 188.8 215.3 222.3 222.3 193.7 191.4 Clinton 171.2 180.0 139.6 185.6 197.0 188.2 213.8 213.3 210.9 196.1 189.6 Iowa 158.5 171.6 135.7 165.9 192.1 199.3 210.6 216.7 211.7 190.6 185.3 Jackson 157.2 178.3 114.6 173.2 188.9 190.6 202.1 202.1 202.4 185.5 179.5 Johnson 150.9 171.9 132.4 181.1 184.6 187.1 189.0 213.1 212.3 181.3 180.4 Jones 168.9 171.4 127.3 179.3 180.1 186.6 201.3 217.0 208.9 203.0 184.4 Linn 170.3 169.1 124.2 178.6 176.1 189.2 200.3 217.4 215.4 223.7 186.4 Muscatine 144.8 164.6 152.6 158.3 188.1 177.7 203.0 206.8 209.6 173.2 177.9 Scott 151.9 174.2 131.7 167.8 194.5 195.9 216.0 220.0 214.0 189.3 185.5 East Central 165.3 172.3 134.7 173.2 186.9 189.1 205.5 214.9 212.6 195.5 185.0 Source: USDA National Agricultural Statistics Service, Iowa Office , www.nass.usda.gov/Statistics_by_State/Iowa/index.php . Figure 6. East Central Iowa district average corn yields, 2010-2019 Page 5 Table 5. Central Iowa district average corn yields, 2010-2019 (bushels/acre) Corn Yields 2010 2011 2012 2013 2014 2015 2016 2017 2018 2019 Avg. Boone 162.5 182.5 147.1 154.2 180.9 192.3 208.4 192.4 193.7 194.8 180.9 Dallas 141.9 172.1 129.0 145.3 195.5 182.4 204.0 187.2 174.0 195.0 172.6 Grundy 192.9 172.8 161.5 180.8 182.4 199.9 198.5 217.3 225.2 209.8 194.1 Hamilton 169.6 180.6 138.0 135.0 173.1 198.1 209.0 194.6 188.9 198.2 178.5 Hardin 185.8 186.7 163.6 156.6 166.3 199.3 208.0 213.7 216.6 200.2 189.7 Jasper 152.7 171.1 150.9 158.8 191.5 198.9 214.7 204.6 218.6 209.3 187.1 Marshall 183.3 166.3 157.6 163.2 190.5 194.9 211.3 222.4 226.0 221.9 193.7 Polk 139.4 160.6 149.1 143.6 181.4 187.0 199.8 200.3 186.2 196.7 174.4 Poweshiek 153.2 179.0 152.3 158.5 188.4 197.8 213.2 215.1 218.7 200.3 187.7 Story 163.9 163.2 157.6 137.2 169.9 188.0 211.9 200.3 192.3 189.3 177.4 Tama 176.7 162.0 160.2 158.7 182.7 189.5 208.4 220.6 224.3 204.8 188.8 Webster 168.4 190.6 149.2 137.6 190.0 201.0 200.8 197.9 188.1 202.9 182.7 Central 167.5 175.1 151.3 152.2 182.4 194.8 207.5 205.6 205.2 202.1 184.4 Source: USDA National Agricultural Statistics Service, Iowa Office , www.nass.usda.gov/Statistics_by_State/Iowa/index.php . Figure 5. Central Iowa district average corn yields, 2010-2019 Page 4 Table 4. West Central Iowa district average corn yields, 2010-2019 (bushel/acre) Corn Yields 2010 2011 2012 2013 2014 2015 2016 2017 2018 2019 Avg. Audubon 160.3 176.6 114.8 157.1 185.5 189.8 206.1 211.2 180.0 216.0 179.7 Calhoun 173.3 181.9 134.8 132.6 189.6 194.7 207.3 195.1 193.3 198.8 180.1 Carroll 182.0 180.2 105.3 136.5 188.6 195.4 203.1 211.3 208.4 219.7 183.1 Crawford 185.8 181.8 131.3 157.8 183.0 199.1 213.5 221.9 214.0 234.7 192.3 Greene 167.3 183.4 124.6 137.9 181.2 189.0 205.5 202.2 201.3 201.4 179.4 Guthrie 141.3 169.4 113.4 130.1 176.1 179.2 198.2 197.6 192.2 196.7 169.4 Harrison 159.4 169.9 130.9 177.1 161.1 189.5 204.6 193.2 176.0 173.5 Ida 191.8 182.9 151.4 177.7 189.9 203.1 216.0 215.7 222.2 194.5 Monona 168.7 158.3 115.1 175.2 156.6 169.0 184.5 196.0 181.4 203.9 170.9 Sac 189.7 183.4 130.7 142.6 179.8 204.8 214.3 194.5 213.5 220.6 187.4 Shelby 171.6 173.6 137.8 182.6 185.2 195.3 215.3 207.1 189.1 217.3 187.5 Woodbury 164.3 173.3 134.8 164.2 177.5 202.3 203.7 200.5 219.3 218.2 185.8 Other (Combined) Counties 210.0 West Central 172.1 176.3 127.4 156.8 179.2 193.1 206.2 203.9 199.9 213.1 182.8 Source: USDA National Agricultural Statistics Service, Iowa Office , www.nass.usda.gov/Statistics_by_State/Iowa/index.php . * Yields were not disclosed by USDA NASS for counties with missing data. Figure 4. West Central Iowa district average corn yields, 2010-2019 Page 3 Table 3. Northeast Iowa district average corn yields, 2010-2019 (bushels/acre) Corn Yields 2010 2011 2012 2013 2014 2015 2016 2017 2018 2019 Avg. Allamakee 175.8 173.3 153.6 162.1 175.6 175.4 205.1 190.5 198.4 187.2 179.7 Black Hawk 170.4 186.1 126.4 166.1 165.2 192.9 206.4 209.2 206.2 205.1 183.4 Bremer 174.6 196.5 133.3 175.1 159.0 203.1 210.6 212.7 212.4 212.5 189.0 Buchanan 167.5 187.0 140.4 168.8 169.3 191.6 205.6 221.3 207.1 218.9 187.8 Chickasaw 182.0 188.8 125.8 171.8 157.6 202.8 206.6 194.4 192.9 212.1 183.5 Clayton 176.9 186.8 152.9 181.2 176.7 193.2 210.3 213.6 201.5 197.5 189.1 Delaware 175.8 186.5 129.8 184.7 174.9 195.8 202.3 218.0 224.8 204.6 189.7 Dubuque 170.4 185.1 149.4 196.0 184.9 197.0 211.5 215.1 211.8 216.4 193.8 Fayette 166.5 186.6 151.0 181.2 170.9 191.8 202.5 207.6 200.1 200.5 185.9 Howard 191.4 185.8 137.8 159.1 164.4 202.1 202.2 201.7 185.5 194.2 182.4 Winneshiek 190.5 186.2 140.6 181.8 174.0 185.6 210.7 199.7 198.1 200.4 186.8 Northeast 175.9 186.6 139.6 176.6 170.2 194.0 206.5 208.9 204.3 205.4 186.8 Source: USDA National Agricultural Statistics Service, Iowa Office , www.nass.usda.gov/Statistics_by_State/Iowa/index.php . Figure 3. Northeast Iowa district average corn yields, 2010-2019 Page 2 Table 2. North Central Iowa district average corn yields, 2010-2019 (bushels/acre) Corn Yields 2010 2011 2012 2013 2014 2015 2016 2017 2018 2019 Avg. Butler 180.5 186.7 122.0 179.2 167.7 193.3 207.3 211.4 211.3 209.5 186.9 Cerro Gordo 173.0 169.3 124.8 163.1 168.3 196.9 193.6 208.9 184.4 191.8 177.4 Floyd 177.8 181.1 123.2 170.0 162.8 196.5 196.3 203.4 184.4 202.9 179.8 Franklin 168.0 189.7 150.0 179.6 165.8 200.2 204.8 206.1 204.3 202.7 187.1 Hancock 176.9 179.8 143.3 169.9 173.9 201.2 200.3 200.2 176.7 193.3 181.6 Humboldt 153.2 185.5 146.1 155.4 176.9 194.8 206.1 200.9 162.3 198.7 178.0 Kossuth 184.0 179.9 164.6 167.7 176.6 199.0 204.7 205.6 180.2 198.7 186.1 Mitchell 190.5 180.1 131.4 164.1 175.1 202.1 199.1 213.4 193.3 194.5 184.4 Winnebago 184.1 176.6 161.1 149.1 172.7 203.6 197.9 210.7 180.8 198.8 183.5 Worth 193.2 173.0 143.1 150.7 181.5 202.1 191.5 198.5 180.0 196.5 181.0 Wright 150.0 189.9 153.7 168.8 169.4 198.4 200.2 206.9 180.5 197.0 181.5 North Central 175.6 181.3 143.9 167.1 171.9 198.9 200.9 206.1 185.7 198.6 183.0 Source: USDA National Agricultural Statistics Service, Iowa Office , www.nass.usda.gov/Statistics_by_State/Iowa/index.php . Figure 2. North Central Iowa district average corn yields, 2010-2019 March 2020 Historical Corn Yields by County in Iowa The average corn yields for counties and crop reporting districts in Iowa are included in this file. Averages from 2010 through 2019 are included in the tables and graphs. This information is helpful for seeing trends in yields over the past 10 years. Counties are sorted alphabetically by district. The information presented in this file was released February 20, 2020 from the USDA National Agricultural Statistics Service , Iowa Office, www. nass.usda.gov/Statistics_by_State/Iowa/index.php. Table 1. Northwest Iowa district average corn yields, 2010-2019 (bushels/acre) Corn Yields 2010 2011 2012 2013 2014 2015 2016 2017 2018 2019 Avg. Buena Vista 178.3 180.2 148.2 160.5 172.1 202.7 201.1 187.9 193.1 190.8 181.5 Cherokee 186.9 176.7 158.7 185.1 183.6 209.6 219.7 203.7 213.3 208.9 194.6 Clay 177.6 185.4 170.1 167.2 166.3 202.8 202.0 197.3 158.5 185.5 181.3 Dickinson 181.0 169.3 160.9 162.4 157.9 194.5 188.0 196.2 160.4 170.0 174.1 Emmet 183.1 169.6 166.6 166.4 165.0 203.3 198.5 210.1 155.8 179.8 Lyon 195.2 185.4 161.6 190.5 172.9 196.0 206.9 218.9 193.0 186.6 190.7 O'Brien 190.7 185.1 159.8 195.3 180.3 205.2 210.7 213.8 201.6 204.9 194.7 Osceola 192.7 184.4 169.6 182.0 175.4 204.7 203.7 211.6 180.2 182.5 188.7 Palo Alto 174.0 174.6 170.6 168.8 164.6 197.5 196.0 195.4 157.9 198.3 179.8 Plymouth 184.7 164.5 110.1 188.9 187.3 203.6 209.2 193.0 213.8 217.8 187.3 Pocahontas 172.6 181.2 165.3 163.8 174.8 205.5 206.8 190.9 179.2 182.2 Sioux 196.5 177.6 143.2 194.1 187.4 201.9 212.2 220.7 211.9 192.2 193.8 Other (Combined) Counties 191.2 Northwest 184.7 177.7 154.8 178.6 175.3 202.5 205.5 203.4 188.4 195.3 186.6 Source: USDA National Agricultural Statistics Service, Iowa Office , www.nass.usda.gov/Statistics_by_State/Iowa/index.php . * Yields were not disclosed by USDA NASS for counties with missing data. Figure 1. Northwest Iowa district average corn yields, 2010-2019 Ag Decision Maker www.extension.iastate.edu/agdm File A1-12 Page 10 Table 10. Iowa crop reporting district average corn yields, 2010-2019 (bushels/acre) Corn Yields 2010 2011 2012 2013 2014 2015 2016 2017 2018 2019 Avg. Northwest 184.7 177.7 154.8 178.6 175.3 202.5 205.5 203.4 188.4 195.3 186.6 North Central 175.6 181.3 143.9 167.1 171.9 198.9 200.9 206.1 185.7 198.6 183.0 Northeast 175.9 186.6 139.6 176.6 170.2 194.0 206.5 208.9 204.3 205.4 186.8 West Central 172.1 176.3 127.4 156.8 179.2 193.1 206.2 203.9 199.9 213.1 182.8 Central 167.5 175.1 151.3 152.2 182.4 194.8 207.5 205.6 205.2 202.1 184.4 East Central 165.3 172.3 134.7 173.2 186.9 189.1 205.5 214.9 212.6 195.5 185.0 Southwest 151.9 157.5 121.1 159.2 175.4 183.9 191.1 191.7 182.1 194.2 170.8 South Central 98.0 129.6 84.8 133.5 169.5 163.2 182.8 159.9 165.3 161.0 144.8 Southeast 111.4 137.3 122.1 156.4 193.6 175.0 201.4 182.2 198.4 174.9 165.3 State Total 165.0 172.0 137.0 164.0 178.0 192.0 203.0 202.0 196.0 198.0 180.7 Source: USDA National Agricultural Statistics Service, Iowa Office , www.nass.usda.gov/Statistics_by_State/Iowa/index.php . Figure 10. Iowa average corn yields, 2010-2019 This institution is an equal opportunity provider. For the full non-discrimination statement or accommodation inquiries, go to www.extension.iastate.edu/diversity/ext . Prepared by Ann Johanns extension program specialist 641-732-5574, aholste@iastate.edu www.extension.iastate.edu/agdm www.extension.iastate.edu/agdm March 2020Historical Corn Yields Counties are sorted alphabetically by district. The information presented in this file was released February 20, 2020 from the USDA National , Iowa Office, www. Table 1. Northwest Iowa district average corn yields, 2010-2019 (bushels/acre)Corn Yields2010201120122013201420152016201720182019Avg.Buena Vista178.3180.2148.2160.5172.1202.7201.1187.9193.1190.8181.5Cherokee186.9176.7158.7185.1183.6209.6219.7203.7213.3208.9194.6Clay177.6185.4170.1167.2166.3202.8202.0197.3158.5185.5181.3Dickinson181.0169.3160.9162.4157.9194.5188.0196.2160.4170.0174.1Emmet183.1169.6166.6166.4165.0203.3198.5210.1155.8179.8Lyon195.2185.4161.6190.5172.9196.0206.9218.9193.0186.6190.7O'Brien190.7185.1159.8195.3180.3205.2210.7213.8201.6204.9194.7Osceola192.7184.4169.6182.0175.4204.7203.7211.6180.2182.5188.7Palo Alto174.0174.6170.6168.8164.6197.5196.0195.4157.9198.3179.8Plymouth184.7164.5110.1188.9187.3203.6209.2193.0213.8217.8187.3Pocahontas172.6 181.2165.3163.8174.8205.5206.8190.9179.2182.2Sioux196.5177.6143.2194.1187.4201.9212.2220.7211.9192.2193.8Other (Combined) Counties191.2Northwest184.7177.7154.8178.6175.3202.5205.5203.4188.4195.3186.6 Yields were not disclosed by USDA NASS for counties with missing data. Figure 1. Northwest Iowa district average corn yields, 2010-2019