PDF-Sprinkler and micro irrigated area
Author : karlyn-bohler | Published Date : 2015-08-19
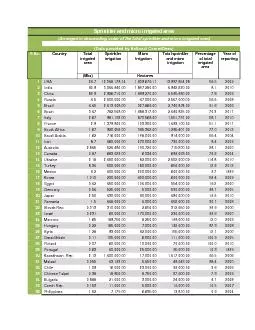
Arranged in descending order of the total sprinkler and micro irrigated area Data provided by National Committees Country Total irrigated area irrigation Irrigation
Presentation Embed Code
Download Presentation
Download Presentation The PPT/PDF document "Sprinkler and micro irrigated area" is the property of its rightful owner. Permission is granted to download and print the materials on this website for personal, non-commercial use only, and to display it on your personal computer provided you do not modify the materials and that you retain all copyright notices contained in the materials. By downloading content from our website, you accept the terms of this agreement.
Sprinkler and micro irrigated area: Transcript
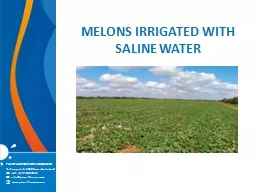
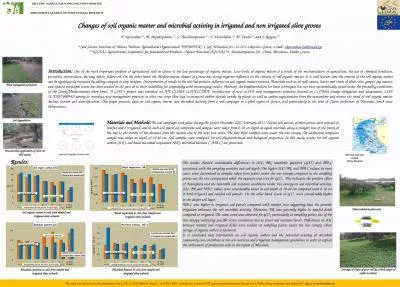
Arranged in descending order of the total sprinkler and micro irrigated area Data provided by National Committees Country Total irrigated area irrigation Irrigation Total sprinkler and micro ir. IS DELUGE AN OPTION? . Ing. J.C. (Johan) Hoogeweg. DGMR, Netherlands. Fire Sprinkler International 2014. Introduction. :. Objective:. To give an insight in the daily practice of a fire engineer regarding . in the . 2010 CA Codes. November . . 15, 2011. Why Sprinklers in Dwellings?. NFPA Report in 2005. “Fire Loss in the United States During 2005”. :. 25% of structure fires occurred . in residential structures. DISTR MEET-MKT-02-EN PATRICK ROSAT 08-09.01.2015. Agricola Famosa. 2. 3. Agricola Famosa. 4. PROTOCOL - EVALUATION PROCEDURE . Comparison of quantitative and qualitative production data between two identical plots irrigated without and with Aqua-4D with brackish water. Educational . Presentation. Introduction. Building Designers need to specify dead and live loads of both fire sprinkler systems and other load requirements imposed under the model building codes. . Truss Designers are responsible for incorporating the additional load from the fire sprinkler systems into the truss design. . . K.S. “Buck” Collier. NICET Level III Fire Protection Engineering Technology/Water Based Systems Layout.. Have worked in industry 28 years. . January 1986 to December 1999 . employed by . Commonwealth Sprinkler Company . Investigating Insectivores. PHOTO: Michael . Pennay. What is Habitat?. All animals have certain things that they need to survive.. Oxygen. . to breathe. Water. . to drink. Food. . for energy. Shelter. Overview. Revised 3/23/2017. SBCA. has been the voice of the structural building components industry since 1983, providing educational programs and technical information, disseminating industry news, and facilitating networking opportunities for manufacturers of roof trusses, wall panels and floor trusses. . Fire Detection, . Protection, and . Suppression . Systems. Firefighter One . Fire Fighter II Objectives. Identify . the four types of sprinkler heads. .. Identify the different styles of indicating valves.. GFSAD30m. Global Cropland Extent Products of . Australia Accuracies on irrigated croplands areas . . Pardhasaradhi Teluguntla, Prasad Thenkabail and Jun Xiong. 18. th. February, 2016. . K.S. “Buck” Collier. NICET Level III Fire Protection Engineering Technology/Water Based Systems Layout.. Have worked in industry 28 years. . January 1986 to December 1999 . employed by . Commonwealth Sprinkler Company . kindly visit us at www.nexancourse.com. Prepare your certification exams with real time Certification Questions & Answers verified by experienced professionals! We make your certification journey easier as we provide you learning materials to help you to pass your exams from the first try. t. he. . most. . important. . problem. of . agricultur. al soils. . in. . Greece . is. . the. . low. . percentage. of . organic. . matter. . Low. . levels. of . organic. . matter. . is. Overview of Micro Irrigation in India. Potential . area for micro irrigation as estimated by the Task Force on Micro Irrigation during 2017-18 was 69.5 million . ha; only . 10 m ha (14%) . was covered . Presented by. Triranga. . Bharatiya. Borah. Director of Horticulture & Food Processing, Govt. of Assam. Basic. . Information. . Assam is the gateway of entire North East except . Sikkim. All the North East States are Hilly origin except Assam which has a mixture of Plain areas as well as hilly terrain.
Download Document
Here is the link to download the presentation.
"Sprinkler and micro irrigated area"The content belongs to its owner. You may download and print it for personal use, without modification, and keep all copyright notices. By downloading, you agree to these terms.
Related Documents