/
ESTIMATION OF ESTIMATION OF

ESTIMATION OF - PowerPoint Presentation

kittie-lecroy
kittie-lecroy . @kittie-lecroy
Follow
376 views
Uploaded On 2016-03-14

ESTIMATION OF - PPT Presentation

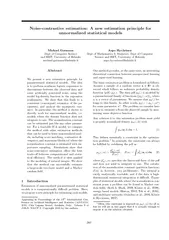
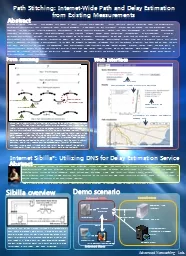
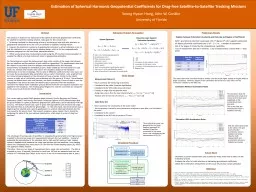
EARTHQUAKE DAMAGE FROM AERIAL IMAGES BY PROBABILISTIC METHOD Shota Izaka Hitoshi Saji Shizuoka University Introduction Backgrounds After largescale earthquake Urban areas are seriously damaged ID: 255200

damaged regions high undamaged regions damaged undamaged high result undetermined probability detection buildings rate image classification human roads decisions road answer method

Share:

Link:

Embed:

Download Presentation from below link

Download Presentation The PPT/PDF document "ESTIMATION OF" is the property of its rightful owner. Permission is granted to download and print the materials on this web site for personal, non-commercial use only, and to display it on your personal computer provided you do not modify the materials and that you retain all copyright notices contained in the materials. By downloading content from our website, you accept the terms of this agreement.


Presentation Transcript

Slide1

ESTIMATION OFEARTHQUAKE DAMAGEFROM AERIAL IMAGESBY PROBABILISTIC METHOD

Shota

Izaka

, Hitoshi

Saji

(Shizuoka University)Slide2

IntroductionSlide3

BackgroundsAfter large-scale earthquakeUrban areas are seriously damagedMany people require rescuing and aidFor effective rescue and victim supportRapid action is neededA wide range of information is important

Aerial images are suitable

for disaster observationSlide4

Conventional methodMatching analysisComparing pre-disaster and post-disaster imagesDifficulty of matching analysisDifficult to obtain pre-disaster imagesAffected by shooting conditions and timeChanges of shadowsConstruction and destruction of buildingsSlide5

Our goalsRapid analysis of damageUse only post-disaster aerial imagesNot using the training dataAssisting various rescue and victim support activities

Providing information available for various purposes

Assisting human decisionsSlide6

Ways of assisting human decisionsRemaining undetermined regionsWe don’t force to classify all regionsThe final decision is left to the people in the fieldShowing the likelihood of damagesThe result available for various purposesTarget area estimation of rescue activity

Determination of the road passable for emergency vehiclesSlide7

MethodSlide8

OverviewAerial Image

Segmentation

Feature

extraction

Result

for buildings

Digital

map

Region

classification

Result

for roads

Road mask creationSlide9

Road mask creationCreating road mask from digital mapRoads change little over time Our method is not affected by the time when the map is created

Digital map

Road maskSlide10

SegmentationInitial SegmentationSegment into small basic regionsUnification of similar regionsConsidering color and texturesAvoiding to unify roads and buildings

Before segmentation

After segmentationSlide11

Feature extractionCollapsed buildingsSegmented into small regionsHaving short random edges Extracting short edges as a feature of damages

Collapsed buildings

Segmented regions

EdgesSlide12

Feature extractionUndamaged buildingsMaintaining their shapesHaving a large area Extracting building regions

as a feature of undamaged

Undamaged buildings

Segmented regions

EdgesSlide13

Region classificationUsing the probabilistic relaxation methodLabeling method using the probability We use the method to classify each region by damage probabilitySlide14

Defining initial probabilityConsidering extracted featuresThe proportion of short edgesThe area of regionBuilding region or not

Large

area

Building

High short edge rate

Probability definitionsSlide15

Probability updateUpdate using similarityConsidering the region similar to damaged region as damaged region

Probability update model

Low

High

High

High

High

High

High

High

High

High

High

High

High

High

High

HighSlide16

Extracting undamaged regionsRegions are converged high or low probabilityExtracting low probability regions as undamaged regionsConsidering regions not converged as undetermined regions

High probability

Result of extraction

Low probability

UndeterminedSlide17

Extracting damaged regionsExtracting damaged regions from high probability regions

High

probability

Damaged regions extraction model

Low

probability

Undetermined

Damaged

UndeterminedSlide18

Redefining initial probabilityRedefining probability by randomness of edgesUsing variance of edge angles

Edge model of

undamaged buildings

Edge model of

collapsed buildingsSlide19

Result of classification■:Undamaged regions■:Undetermined regions 1Low risk of damage■:Undetermined regions 2

High risk of damage

:Damaged regions

Result of classification

Undetermined

Damaged

Undetermined

UndamagedSlide20

Image divisionDividing a result image into buildings and roadsResult of buildingsEstimation of building damagesResult of roadsDetermination of road passableSlide21

ExperimentSlide22

DataAerial imagesGreat Hanshin EarthquakeCaptured on January 18, 1995Provided by PASCO Corp.Digital mapA topographic map of Kobe cityProvided by Kobe City Urban Planning BureauSlide23

Result of classification for buildings

Input image

Result image

:Undamaged regions

:Undetermined regions 1

:Undetermined regions 2

:Damaged regionsSlide24

Result of classification for roads

Input image

Result image

:Undamaged regions

:Undetermined regions 1

:Undetermined regions 2

:Damaged regionsSlide25

Evaluation of accuracyCreating answer imagesUsing visual judgmentComparing with results

Result of classification

Undetermined

Answer

Damaged

Undamaged

Damaged

Undamaged

UndeterminedSlide26

Detection rateEvaluating pixels in same category

Result of classification

Answer

Damaged

Undamaged

Damaged

Undamaged

Damaged

Undamaged

Damaged

UndamagedSlide27

Detection ratewith human decisionsEstimating rate after human decisionsAdding undetermined regions

Result

Damaged

Undamaged

Answer

Damaged

Undamaged

Damaged

Undamaged

Damaged

UndamagedSlide28

False detection rateEvaluating pixels in wrong categoryVisual judgment

Considered undamaged regions

Damaged

Undamaged

Considered damaged regions

Result of classification

Damaged

UndamagedSlide29

Answer for buildingsResult image

Answer image

:Undamaged regions

:Undetermined regions 1

:Undetermined regions 2

:Damaged regionsSlide30

Answer for roadsAnswer image

Result image

:Undamaged regions

:Undetermined regions 1

:Undetermined regions 2

:Damaged regionsSlide31

Result of accuracy evaluation in buildingsUndamaged regionsDetection rate:77.2%With human decisions:93.1%False detection rate:10.1%Damaged regionsDetection rate:74.0%With human decisions:87.0%

False detection rate:17.7%Slide32

Result of accuracy evaluation in roadsUndamaged regionsDetection rate:85.5%With human decisions:93.4%False detection rate:19.0%Damaged regionsDetection rate:65.3%With human decisions:79.6%

False detection rate:14.6%Slide33

Review of resultsObtained high detection ratesExcept for damaged regions in roadsFeatures of damage on roads are unclearMany regions classified into “Undetermined” Requiring human decisions

Road image

Result of classificationSlide34

Review of resultsObtained low false detection ratesRoads have more errors than buildingsCaused by objects on roadsCars, roofs, shadows of buildings

Roof and car

Error

Shadow

and car

ErrorSlide35

ConclusionOur results can be used for various rescue and victim support activityEstimation of building damagesDetermination of road passableOur future directionsImproving building detectionDetecting objects on roadsSlide36

EndSlide37

The Sendai earthquakeMost of the damage was caused by the TsunamiMost of the buildings are flooded outOur method aim to detect collapsed buildingsHuge area of damageNot possible to capture by aerial images

Applying to the earthquake is future works