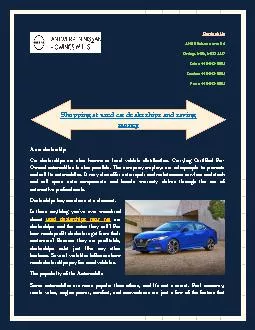
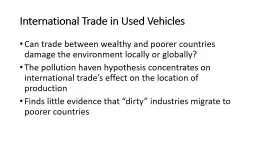
/
International Trade in Used Vehicles International Trade in Used Vehicles

International Trade in Used Vehicles - PowerPoint Presentation

kittie-lecroy
kittie-lecroy . @kittie-lecroy
Follow
372 views
Uploaded On 2018-03-20

International Trade in Used Vehicles - PPT Presentation

Can trade between wealthy and poorer countries damage the environment locally or globally The pollution h aven h ypothesis concentrates on international trades effect on the location of production ID: 658405

mexico cars total vehicles cars mexico vehicles total trade emissions number 2008 2005 change tons countries car policy traded thousands million net

Share:

Link:

Embed:

Download Presentation from below link

Download Presentation The PPT/PDF document "International Trade in Used Vehicles" is the property of its rightful owner. Permission is granted to download and print the materials on this web site for personal, non-commercial use only, and to display it on your personal computer provided you do not modify the materials and that you retain all copyright notices contained in the materials. By downloading content from our website, you accept the terms of this agreement.


Presentation Transcript

Slide1

International Trade in Used Vehicles

Can trade between wealthy and poorer countries damage the environment locally or globally?

The pollution

h

aven

h

ypothesis concentrates on international trade’s effect on the location of production

Finds little evidence

that “dirty” industries migrate to poorer

countriesSlide2

Could changes in consumption (as opposed to production) induced by trade affect the environment?

North American Free Trade Agreement (NAFTA) went into effect in1994

Immediately lowered or eliminated US tariffs for many goods from Mexico (and Canada)

Set timetable for elimination of tariffs for other goods

Pre NAFTA, Mexico did not allow importation of used passenger vehicles from USSlide3

NAFTA mandated Mexico to allow gradual increase in used cars manufactured in US

From 2005 to 2008, Mexico allowed importation of used US and Canadian cars that were 10-15 years old

The allowance was ahead of schedule of what NAFTA called for

Political pressure in Mexico effectively ended the importation policy in 2008Slide4

Differences in income and cost of maintaining vehicles generates market between relatively poor and wealthy countries

Poorer countries may purchase used cars from richer

Due to technology differences and wear, used

cars

generally

more polluting than newer

Paper looks at whether the trade in used cars increased greenhouse gas emissions, and affected local air qualitySlide5

Vehicles

that entered Mexico 2005 - 2008

Stock of Vehicles

in US in 2005

Stock

of Vehicles in Mexico in 2008

Total

Number of vehicles (millions)

2.45

232

24.8

Mean Vehicle Age (years)

11.4

8.8

13.7Slide6

Top ten traded vehicles

Ford Explorer (SUV)

Chevrolet S-10 (truck)

Dodge Caravan (minivan)

Ford Ranger (truck)

Ford Windstar (minivan)

Chevrolet Silverado (truck)

Ford F-150 (truck)

Plymouth Voyager (minivan)

Jeep Cherokee (SUV)

Ford Taurus (car)Slide7

Were US cars traded in Mexico more polluting than the average vehicle in the US?

Knowledge on the VIN of traded cars allowed researchers to know the make and model year of each car

Used data from California emissions testing to calculate weighted average emissions for all cars in US, and used cars exported to MexicoSlide8

Stock

of Vehicles in US in 2005

Vehicles that Entered

Mexico 2005-2008

Stock

of Vehicles in Mexico in 2008

Local Pollutants

Hydrocarbons (ppm)

39.9

44.4

50.7

Carbon Monoxide

(percent)

0.147

0.153

0.215

Nitrogen Oxide (ppm)

248

309

321

Global Pollutants

Miles per Gallon

23.8

23.5

22.3

Vehicle

Weight (pounds)

3,516

3,708

3,460

Engine

Size (liters)

3.47

3.70

3.45Slide9

The effect of the trade policy on total emissions across the two countries reflects

Change in total number of cars across countries induced by policy

Total number of

vehicles

operating

in US estimated to have decreased only slightly

Total number of vehicles in Mexican may have

grown

Effect on composition of cars in two countries

Cars entering Mexico on average emitted more local pollutants than cars in the US but less than cars in Mexico

Cars entering Mexico were heavier and had larger engines than cars in the US or those in Mexico

.Slide10

Change in total number

of cars

used in the

two

countries induced by policy

Mexico

imported 2.5 million used vehicles between 2005 and 2008

Was the number of registered vehicles in the US at the end of the period 2.5 million less than it would have been if not for the trade

?

Vehicles exit from use yearly due to age, accidents etc. Slide11

The 2.5 million

exported vehicles

represented roughly 1% of the total stock of registered cars in US

Paper finds vehicle exit rate largely unaffected by used car trade

Concludes many of the vehicles traded to Mexico would have

been or

already had been retiredSlide12

Effect of policy on total cars in Mexico

Did

the flood of used cars in the country

substitute for new car purchases?

Sp

- supply of cars in Mexico before policy

Sa – supply while policy in

place

D – demand for autos

Total change in number of cars in Mexico depends partially on shape of demand curveSlide13

In the period immediately prior to 2005, roughly one million new cars were sold in Mexico yearly

Equal to number of used cars entering the country from US over 2005-2008

One to one replacement of new cars for used would have eliminated all new car sales

Little evidence is found that new car sales changed once US used cars became availableSlide14

What is the net change in pollution caused annually by the trade in used cars and the total pollution over the lifetime of the cars traded?

Pollution went up in Mexico due

to

2.5 million cars

entering the

country

The composition of the cars also contributed to total annual emissions change

Pollution was slightly less in the US due to small measured decrease in total number of vehiclesSlide15

Total emissions caused by the used car trade calculated as:

Net change in number of cars in country by make/model

×

average miles driven by make/model

×

emissions per mile

Emission

Annual Estimate

(2008)

Carbon

Dioxide (millions of tons)

5.6

Hydrocarbons (thousands

of tons)

3.4

Carbon Monoxide

(thousands of tons)

41.3

Nitrogen

Oxide (thousands of tons)

7.9Slide16

Contribution to Greenhouse emission over lifetime of vehicles

Trade in used vehicles from US to Mexico represent a net increase in greenhouse gas emissions for two primary reasons

Evidence suggests many of the vehicles traded (roughly 9 out of 10) would have otherwise been retired in US (sent to scrapyard).

Vehicles are used in Mexico longer

The estimated yearly retirement rate for US vehicles that are 10 to 30 years of age is 12.2%

The corresponding retirement rate in Mexico is 3.8%Slide17

Estimates of the

net change in emissions over 30 year

profile of traded autos

Emission

Lifetime Estimate

Carbon

Dioxide (millions of tons)

83.9

Hydrocarbons (thousands

of tons)

50.9

Carbon Monoxide

(thousands of tons)

618.7

Nitrogen

Oxide (thousands of tons)

118.9Slide18

The net lifetime increase in greenhouse emissions due to trade represents roughly 1% of the Mexico’s total annual CO2 emissions

The social damage from change in local pollutants is hard to evaluate

Depends on local environment

Additional nitrogen dioxide emission

is more damaging in

Mexico City than in rural area