/
or years, golf course superinten-dents in the Paci or years, golf course superinten-dents in the Paci

or years, golf course superinten-dents in the Paci - PDF document

kittie-lecroy
kittie-lecroy . @kittie-lecroy
Follow
400 views
Uploaded On 2016-03-24

or years, golf course superinten-dents in the Paci - PPT Presentation

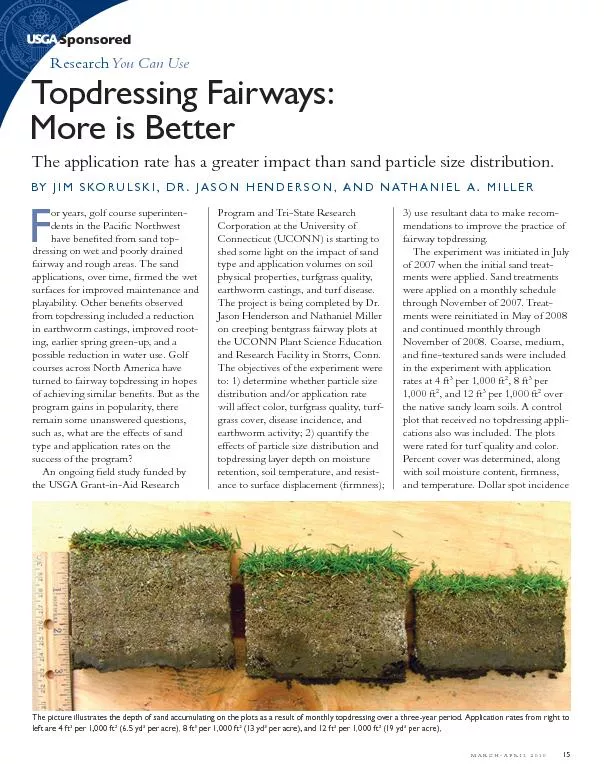
MARCHAPRIL 2010 15 Sponsored ResearchYou Can UseTopdressing FairwaysMore is BetterThe application rate has a greater impact than sand particle size distributionBY JIM SKORULSKI DR JASON HEN ID: 267731

MARCH-APRIL 2010

Share:

Link:

Embed:

Download Presentation from below link

Download Pdf The PPT/PDF document "or years, golf course superinten-dents i..." is the property of its rightful owner. Permission is granted to download and print the materials on this web site for personal, non-commercial use only, and to display it on your personal computer provided you do not modify the materials and that you retain all copyright notices contained in the materials. By downloading content from our website, you accept the terms of this agreement.


Presentation Transcript

or years, golf course superinten-dents in the PaciÞ c Northwest have beneÞ ted from sand top-dressing on wet and poorly drained fairway and rough areas. The sand applications, over time, Þ rmed the wet surfaces for improved maintenance and playability. Other beneÞ ts observed from topdressing included a reduction in earthworm castings, improved root-ing, earlier spring green-up, and a possible reduction in water use. Golf courses across North America have turned to fairway topdressing in hopes of achieving similar beneÞ ts. But as the program gains in popularity, there remain some unanswered questions, such as, what are the effects of sand type and application rates on the success of the program?An ongoing Þ eld study funded by the USGA Grant-in-Aid Research Program and Tri-State Research Corporation at the University of Connecticut (UCONN) is starting to shed some light on the impact of sand type and application volumes on soil physical properties, turfgrass quality, earthworm castings, and turf disease. The project is being completed by Dr. Jason Henderson and Nathaniel Miller on creeping bentgrass fairway plots at the UCONN Plant Science Education and Research Facility in Storrs, Conn. The objectives of the experiment were to: 1) determine whether particle size distribution and/or application rate will affect color, turfgrass quality, turf-grass cover, disease incidence, and earthworm activity; 2) quantify the effects of particle size distribution and topdressing layer depth on moisture retention, soil temperature, and resist-ance to surface displacement (Þ rmness); 3) use resultant data to make recom-mendations to improve the practice of fairway topdressing.The experiment was initiated in July of 2007 when the initial sand treat-ments were applied. Sand treatments were applied on a monthly schedule through November of 2007. Treat-ments were reinitiated in May of 2008 and continued monthly through November of 2008. Coarse, medium, and Þ ne-textured sands were included in the experiment with application rates at 4 ft per 1,000 ft, 8 ft per 1,000 ft, and 12 ft per 1,000 ft over the native sandy loam soils. A control plot that received no topdressing appli-cations also was included. The plots were rated for turf quality and color. Percent cover was determined, along with soil moisture content, Þ rmness, and temperature. Dollar spot incidence MARCH-APRIL 2010 15 Sponsored ResearchYou Can UseTopdressing Fairways:More is BetterThe application rate has a greater impact than sand particle size distribution.BY JIM SKORULSKI, DR. JASON HENDERSON, AND NATHANIEL A. MILLER The picture illustrates the depth of sand accumulating on the plots as a result of monthly topdressing over a three-year period. Application rates from right to left are 4 ft per 1,000 ft (6.5 yd per acre), 8 ft per 1,000 ft (13 yd per acre), and 12 ft per 1,000 ft (19 yd per acre), Monthly applications of three sands are applied from April through November at 4 ft per 1,000 ft8 ft per 1,000 ft, and 12 ft per 1,000 ft to compare the impacts of sand type and application rate in fairway topdressing.and earthworm castings also were measured as they occurred. The data were collected weekly through the 2008 growing season and biweekly through the 2009 season. Data from the 2008 season will be discussed, as the 2009 data are currently being collected and analyzed.TURF QUALITY, COLOR, AND COVERThe data analysis indicates that fairway topdressing positively inß uences turf quality, color, and cover. The increase in turfgrass quality appeared as an overall rate response, with plots receiving higher rates of topdressing generally getting higher quality ratings despite the type of sand applied. Top-dressing rate also had the largest impact on turfgrass color throughout the season, but it was most noticeable during initial spring green-up. Plots receiving the most sand had the greatest color response during the 2008 season. Turf cover data were collected just prior to the next topdressing application. Greater turfgrass cover was observed on plots topdressed at higher application rates. Sand type showed no effect on turfgrass cover when the data were collected at the end of the month.SOIL MOISTURESoil moisture content in the top two inches of the rootzone proÞ le was impacted by both sand type and appli-cation rate. Generally, the coarser the sand, the less water was retained. Similarly, the higher the topdressing application rate, the less water was retained in the upper proÞ le. The only exception to these trends was in September 2008 when moisture levels were very high and both the Þ ne- and medium-textured sands retained more moisture than the coarse sand and control plots.SURFACE FIRMNESSA primary reason fairway topdressing programs are implemented is to Þ rm the surfaces, improve playability, and minimize course closure following heavy rains. Surface Þ rmness was measured in this study using a proving ring penetrometer. A sand type and application rate effect was observed in April and May. The rate effect showed that treatments receiving higher rates of topdressing were Þ rmer than the lower rate and control treatments. The rate effect was not signiÞ cant from June through October. The sand type effect continued into June, with the ne sand and USGA sands showing greater Þ rmness than the coarse sand treatments. The sand type effect from July and August showed that the Þ ne 16 GREEN SECTION RECORD Table 1Particle size analyses of sand types Soil Separate % % Retained No. 10 No. 18 No. 35 No. 60 No. 100 No. 140 No. 270 Gravel VCS CS MS FS VFS VFS Treatment Sand Silt Clay 2mm 1mm 0.5mm 0.25mm 0.15mm 0.10mm 0.05mm Fine Sand (Desiato Mason) 97.3 1.3 0.6 0.8 4.4 11.0 31.6 31.1 12.1 7.1Medium Sand (Holliston #40) 99.3 0.1 0.5 0.1 2.6 20.2 52.3 20.6 2.7 0.9Coarse Sand (AA Will Mat. 2mm) 99.5 0.0 0.4 0.1 11.0 31.5 42.0 13.0 1.6 0.4USGA Recommendations for 3% Gravel 5% 3% 60% 20% Putting Green Construction 10% CombinedUSGA Recommendations for Putting Green Construction are included for reference only. and USGA sands were not signiÞ cantly different from the control. The coarse sand treatment was less Þ rm than the control, Þ ne sand, and USGA sand treatments from July through October.EARTHWORM CASTINGS AND DOLLAR SPOT INCIDENCESand topdressing did reduce earthworm castings on a measurement date in November 2008. SigniÞ cant differences were observed based on application rates. The plots receiving the 8 ft and 12 ft per 1,000 ft had signiÞ cantly lower earthworm castings than plots receiving the low application rate and the control. Plots receiving the low application rate of 4 ft per 1,000 fthad signiÞ cantly lower castings than the control.SigniÞ cant differences in dollar spot incidence were recorded on the plots in October 2007 and June 2008. The severity of the infection was reduced by sand topdressing. The highest appli-cation rate of 12 ft per 1,000 ft had signiÞ cantly lower dollar spot counts than plots receiving the low and medium application rates and the control.The results of this short two-year eld study are preliminary, but none-theless they are encouraging and sup-port the beneÞ ts of fairway topdressing programs. Fairway topdressing is not for every golf course. It requires a long-term commitment and investment that, over time, can improve playing conditions. Dr. Henderson sums up the initial Þ ndings well in the follow- ing quote: ÒThe good news is that the majority of responses appear to be related to application rate rather than sand type, which could result in a signiÞ cant cost saving associated with sand purchases.Ó Additional information regarding this study can be found at http://www.turf.uconn.edu and http://usgatero.msu.edu/.KORULSKI is a senior agronomist for the Green Section’s Northeast Region; ASONENDERSON.D., is assistant professor, turfgrass and soil sciences; and ATHANIELILLER is an M.S. candidate, department of plant science, University of Connecticut. MARCH-APRIL 2010 17 Analysis of 2008 data shows fairway topdressing treatments positively inß uence turf quality, color, and cover ratings. Plots receiving the highest volume of sand were generally rated the highest, regardless of the type of sand applied.