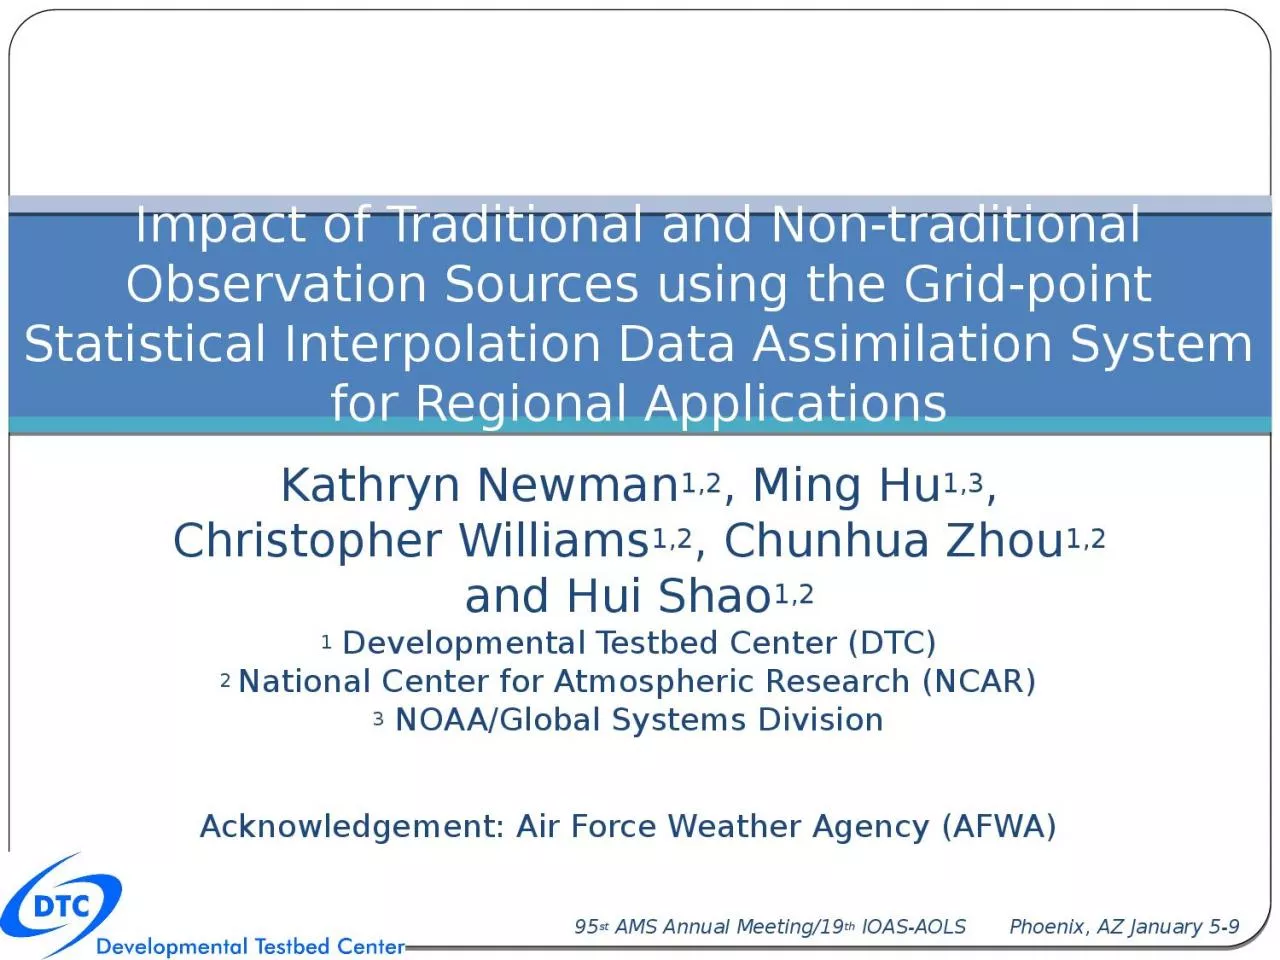
/
Kathryn Newman 1,2 , Ming Hu Kathryn Newman 1,2 , Ming Hu

Kathryn Newman 1,2 , Ming Hu - PowerPoint Presentation

lam
lam . @lam
Follow
28 views
Uploaded On 2024-02-09

Kathryn Newman 1,2 , Ming Hu - PPT Presentation

13 Christopher Williams 12 Chunhua Zhou 12 and Hui Shao 12 Impact of Traditional and Nontraditional Observation Sources using the Gridpoint Statistical Interpolation Data Assimilation System for Regional Applications ID: 1046158

era hpa model ctl02 hpa era ctl02 model sbuv gome ozone analysis consistent top impact verification ctl10 improvements forecast

Share:

Link:

Embed:

Download Presentation from below link

Download Presentation The PPT/PDF document "Kathryn Newman 1,2 , Ming Hu" is the property of its rightful owner. Permission is granted to download and print the materials on this web site for personal, non-commercial use only, and to display it on your personal computer provided you do not modify the materials and that you retain all copyright notices contained in the materials. By downloading content from our website, you accept the terms of this agreement.


Presentation Transcript

1. Kathryn Newman1,2, Ming Hu1,3, Christopher Williams1,2, Chunhua Zhou1,2 and Hui Shao1,2Impact of Traditional and Non-traditional Observation Sources using the Grid-point Statistical Interpolation Data Assimilation System for Regional Applications1 Developmental Testbed Center (DTC)2 National Center for Atmospheric Research (NCAR)3 NOAA/Global Systems DivisionAcknowledgement: Air Force Weather Agency (AFWA)95st AMS Annual Meeting/19th IOAS-AOLS Phoenix, AZ January 5-9

2. Overview As new sources of traditional/non-traditional data become available for GSI, the DTC tests the utility of the new dataset(s) by conducting sensitivity tests for regional scale model forecastsProvide recommendations to AFWA concerning:GSI DA configurations that optimize the utility of these data Datasets that best enhance GSI performanceImpact on operational observation suite for proposed increase in model topSensitivity testing for non-traditional data sources:NOAA-16/17/19 SBUV/2 (Ozone)METOP-A GOME-2 (Ozone)

3. Experiment DesignGSI v3.3 (3d-var) coupled with WRF-ARW v3.6.1Partial cycling scheme – cold start 06/18, warm start 12/00 Testing period: 2014 August 1-31Observations assimilated: AFWA conventional observations, GPS RO, satellite radiances (AMSU-A, MHS, AIRS, HIRS4, IASI, CrIS)continuously cycled BC coefficients15 km horizontal resolution, 62 (57) vertical levels, 2 mb (10 mb) model top48-hr deterministic forecasts initialized at 00/12Verification against ERA-Interim reanalysis using Model Evaluation Tools (MET)Atlantic Domain – GOMEE. Pacific Domain – SBUV

4. Experiment DesignEnd-to-end system configured to closely match AFWA operational suiteModel top testMotivation: determine improvement/degradation from increasing model top in current operational suite from 10 to 2 hPa. CTL10: control (AFWA operational configuration*) w/ 10 hPa model topCTL02: CTL10 with increased model top to 2 hPav3.6.1 updates for stratospheric lapse rate appliedOzone AnalysisMotivation: explore use of ozone data in GSI/ARW for regional applicationsCaveat: O3 not forecast variable in ARW, therefore testing indirect effect on radiances through CRTM calculationSBUV: CTL02 with Solar Backscatter Ultraviolet (SBUV/2; v8) profile O3NOAA 19GOME: CTL02 with Global Ozone Monitoring Experiment (GOME-2) total O3Metop-a, Metop-b GFS ozone used for background* RRTMG used rather than AFWA operational radiation (rrtm/Dudhia)

5. Model Top TestCTL 02 vs. CTL 10Verification using ERA-I5

6. Model top test: analysis increment6O-A for high peaking AMSU-A channels2 hPa run assimilates minimally more radiances relative to 10 hPa runAdditional channel selection for 2 hPa2 hPa O-A has smaller bias than 10 hPa

7. Model top test: verification against ERA-I2 hPa upper and lower level T field consistent improvement over 10 hPa runSS improvements still present for 24-h forecastU field sporadic SS improvements, few SS degradationsAnalysis24 h forecastTTUUCTL02 CTL10 CTL02-CTL10 (pairwise)

8. 24-hr forecast verification against ERA-ICTL02 – ERA-ICTL10 – ERA-I150 hPa Temperature500 hPa Zonal Wind700 hPa Specific HumiditycoolerLess coolwarmerMore westerly

9. Model top test: verification against ERA-ICTL02 CTL10 CTL02-CTL10 (pairwise)Improvements consistent out to 30 hrs for TemperatureZonal wind field SS improvement for longer leads: 24-48 hr150 hPa T500 hPa URMSE

10. Ozone analysis testsSBUV vs. CTLGOME vs. CTL10

11. SBUV: verification against ERA-I11Analysis:Strong signal for improved T fieldSmall mixed improvements for U (V)24 hr Forecast:Most SS differences washed outOzone limited to analysis …SBUV CTL02 CTL02-SBUV (pairwise)Analysis24-hr forecastTTUU

12. 12Select levels with SS improvements show consistent SS improvementsT: Impact limited to ~18 hrsU: Impact present longer in forecastSBUV CTL02 CTL02-SBUVSBUV: verification against ERA-IRMSE400 hPa T50 hPa U

13. SBUV Ozone analysis: 12hr 400 hPa Temperature13Model runs against ERA: CTL too warm, SBUV impact cools (more consistent w/ ERA)Pairwise SS for each grid point: SBUV cooling pattern SSCTL02-ERASBUV-ERAwarmer

14. GOME: verification against ERA-I14Analysis: Consistent T impact to GOMENeutral U (exp. 50 hPa SS)24 hr Forecast:Consistent results to GOME, impact lost by 24 hrsSmall SS degradation signal in 24-hr U GOME CTL02 CTL02-GOMEAnalysis24-hr forecastUUTT

15. 15T improvement diminishes by 18 hrU RMSE reduction present for all forecast times, SS out to 18 hrGOME: verification against ERA-IGOME CTL02 CTL02-GOME150 hPa T50 hPa URMSE

16. GOME Ozone analysis: 12hr 150 hPa Temperature16CTL02-ERAGOME-ERAModel runs against ERA: CTL too warm, GOME impact cools (more consistent w/ ERA)Pairwise SS for each grid point: GOME cooling pattern SSwarmer

17. Summary17Model Top:Increasing model top from 10 hPa to 2 hPa resulted in improved T, U (V), with neutral SPFHOzone Analysis:SBUV and GOME ozone were assimilated into GSI using GFS ozone for backgroundOnly analysis update, indirect impact on radiancesSBUV and GOME runs resulted in consistent (generally positive) changes over the control (CTL02)Improved T analysis with minor U (V) improvementsTemperature and wind benefits present for short term forecast (~18 hrs)Temperature improvements suggest ozone analysis run cooler (& more consistent with ERA-I) than controlOverall, SBUV showed more positive impact than GOME