/
Sensitivity Analysis of Arctic Sensitivity Analysis of Arctic

Sensitivity Analysis of Arctic - PowerPoint Presentation

lam
lam . @lam
Follow
83 views
Uploaded On 2023-08-25

Sensitivity Analysis of Arctic - PPT Presentation

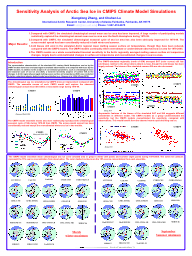
Sea Ice in CMIP5 Climate Model Simulations Xiangdong Zhang and Chuhan Lu International Arctic Research Center University of Alaska Fairbanks Fairbanks AK 99775 Email xdziarcuafedu ID: 1014332

sea ice models cmip5 ice sea cmip5 models model climatological cmip3 simulated area compared 1979 sia sensitivity arctic biases

Share:

Link:

Embed:

Download Presentation from below link

Download Presentation The PPT/PDF document "Sensitivity Analysis of Arctic" is the property of its rightful owner. Permission is granted to download and print the materials on this web site for personal, non-commercial use only, and to display it on your personal computer provided you do not modify the materials and that you retain all copyright notices contained in the materials. By downloading content from our website, you accept the terms of this agreement.


Presentation Transcript

1. Sensitivity Analysis of Arctic Sea Ice in CMIP5 Climate Model Simulations Xiangdong Zhang, and Chuhan LuInternational Arctic Research Center, University of Alaska Fairbanks, Fairbanks, AK 99775Email: xdz@iarc.uaf.edu; Phone: 1-907-474-2675Major Results:Compared with CMIP3, the simulated climatological annual mean sea ice area has been improved. A large number of participating models realistically captured the climatological annual mean sea ice area over the North Hemisphere during 1979-99.Compared with CMIP3, the simulated climatological seasonal cycle of sea ice area has also been obviously improved for 1979-99. The across-model spread has been considerably reduced in both winter and summer. Cold biases still exist in the simulated Arctic regional mean melting season surface air temperatures, though they have been reduced, compared with the CMIP3 models. The CMIP5 models continually either overestimate or underestimate observed sea ice area for 1979-2005.The CMIP5 models as a whole overestimated transient sensitivity to the Arctic regionally averaged melting season surface air temperature changes, largely due to underestimated changes in surface air temperatures and overestimated changes in sea ice areas. The representative characteristics of the simulated 20th century North Hemisphere sea ice by the CMIP5 models have been evaluated against available observations and compared with those by the CMIP3 models. In addition to the analysis of conventional parameters, such as climatological mean and seasonal cycle of sea ice area (SIA), a transient sensitivity analysis of summer SIA to the changes in Arctic regionally averaged melting season surface air temperatures (SAT) was conducted to better understand physics behind model uncertainties (e.g., Gregory et al. 2004; Zhang 2010).IntroductionThe CMIP5 model ensemble mean climatological sea ice cover (shaded area in grey) in winter (left panel) and summer (right panel) during 1979-2005. The solid red contours represent the 15% sea ice concentration from observation. The color dashed contours are the 15% sea ice concentration from each ensemble.The climatological sea ice simulations by CMIP5 show an improvement compared with CMIP3. The ensemble means of each CMIP5 model well capture the observed climatological annual mean SIA within a reasonable range during 1979-99. ACCESS1-0CanCM4CanESM2CNRM-CM5CSIRO-Mk3-6-0GFDL-CM3GFDL-ESM2GGFDL-ESM2MGISS-E2-HGISS-E2-RHadGEM2-CCHadGEM2-ESIPSL-CM5A-LRIPSL-CM5A-MRMIROC4hMIROC5ACCESS1-0CanCM4CanESM2CNRM-CM5CSIRO-Mk3-6-0GFDL-CM3GFDL-ESM2GGFDL-ESM2MGISS-E2-HGISS-E2-RHadGEM2-CCHadGEM2-ESIPSL-CM5A-LRIPSL-CM5A-MRMIROC4hMIROC5MIR-CGCM3NorESM1-MMIR-CGCM3NorESM1-MMarchwinter maximumSeptemberSummer minimumSea ice Concentration, %CMIP3CMIP5Zhang and Walsh 2006The CMIP5 model ensemble means also more realistically reproduced the climatological seasonal cycle of SIA during 1979-99 than CMIP3. The across-model spread has been considerably reduced except the overestimated winter sea ice in two models.Zhang and Walsh 2006The CMIP5-simulated regionally (north of 65N) averaged SAT (color curves) still has cold biases relative to the observations (black curves), though the cold biases has been largely reduced. The biases of the simulated summer SIA are also decreased. Asymmetric features of the biases of the simulated SAT and SIA suggests different sensitivities in different model. The CMIP3 models as a group underestimated the sensitivity, but the CMIP5 models overestimated the sensitivity, compared with observations. This would benefit from the obsered recent rapid declining sea ice.CMIP3CMIP5CMIP3CMIP3CMIP5CMIP5CMIP3CMIP5Zhang 2010Zhang 2010