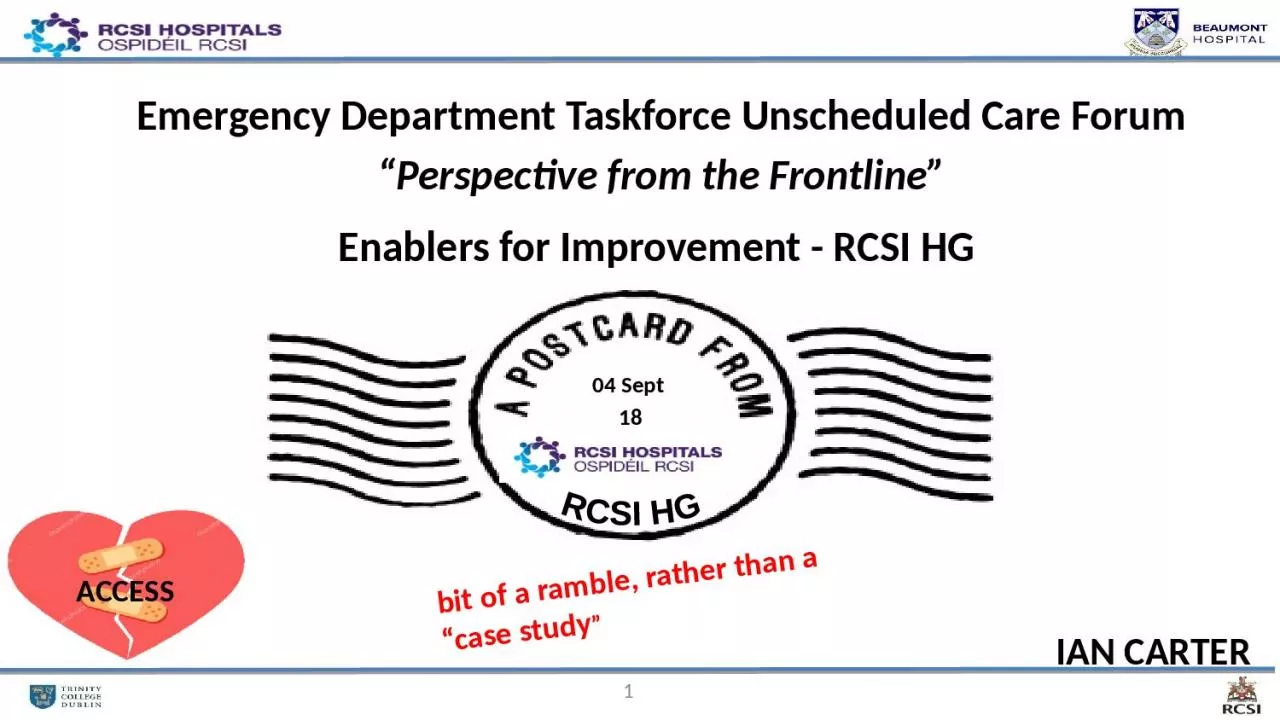
/
04 Sept  18 RCSI  HG  1 bit 04 Sept  18 RCSI  HG  1 bit

04 Sept 18 RCSI HG 1 bit - PowerPoint Presentation

lauren
lauren . @lauren
Follow
27 views
Uploaded On 2024-02-09

04 Sept 18 RCSI HG 1 bit - PPT Presentation

of a ramble rather than a case study Emergency Department Taskforce Unscheduled Care Forum Perspective from the Frontline Enablers for Improvement RCSI HG IAN CARTER ACCESS ID: 1045540

hospital 2018 2015 performance 2018 hospital performance 2015 reduction wait patients beaumont patient ave specialty access 2016 time increase

Share:

Link:

Embed:

Download Presentation from below link

Download Presentation The PPT/PDF document "04 Sept 18 RCSI HG 1 bit" is the property of its rightful owner. Permission is granted to download and print the materials on this web site for personal, non-commercial use only, and to display it on your personal computer provided you do not modify the materials and that you retain all copyright notices contained in the materials. By downloading content from our website, you accept the terms of this agreement.


Presentation Transcript

1. 04 Sept 18RCSI HG 1bit of a ramble, rather than a “case study”Emergency Department Taskforce Unscheduled Care Forum“Perspective from the Frontline”Enablers for Improvement - RCSI HG IAN CARTERACCESS

2. 2Cavan General HospitalMonaghan HospitalRotunda HospitalBeaumont HospitalLouth HospitalOLOL (Drogheda)Connolly Hospital + Academic Partner Royal College of Surgeonsjust in case anybody is unsure

3. 3CAPABILITYCULTURECLINICALQUALITYCLINICAL PERFORMANCECAPACITYMore with More  More with Less  Less with Less (continuum) Context - change factors (to be managed) to effect performance / quality improvement - 4 “C”s - with obvious overlapBUDGETCONTROLFocus - today Actions Outcomes what works / what doesn’t next steps

4. Historic (2015)poor ED access wait time / volumemultiple patients routinely waiting >24 hoursdiminished capacity to treat elective patients and resultant increasing long waiting timespoor patient experienceever increasing presentations / admissions4ContextClinical activity - (ED) - key impactorsCAPACITYCULTURECAPABILITYCONTROLPRESSURE COOKERActivity 2015 2016 2017 2015 /2016 2016 /2017 Jan - July 15 Jan - July 18 Jan - July 2015/2018Val Var% VarVal Var% VarVal Var% VarED New Attendances154,778167,306174,82112,5288%7,5155%88,989105,59416,60519%Emergency Admissions67,93672,88574,1644,9367%1,2792%38,75042,5628,81210%

5. usage of under utilised facilities, particularly theatre / diagnostics (endoscopy) capacityRaheny, Connolly, Louth, Cavanas such considering Hospital Group as an integrated singular capacity construct with limited barriers to patient flow / staff movement  1 empire not 7containing patient flow within a specialty control framework i.e. complex / simpledevelop ambulatory alternative and additional capacity across multiple sites (elective / non - elective)Gynae - Connolly Hospital (1140 attendances annually)Plastics (Trauma) - Connolly Hospital (769 attendances annually)Vascular - Louth (3-5 patients weekly)5CapacityActions to increase / maximise usage of all available capacityActions / Enablers (2016 - 2018)considered across the 4 dimensions: Capacity / Capability / Culture/ Control  more from a combined whole than separate parts

6. 6Actions to increase / maximise internal HG capabilityFocus Beaumont Hospitaladmission alternativesambulatory / OPD / FIT assessment / MIT enabling reduction in admission conversion (29%  26%)2018: 2.5% reduction in ED admissions despite 6% increase in ED attendancespatient processingadmission identification / alternative pathway - much consultant directly deliveredspecialty patient  specialty consultant  specialty ward  specialty alternative ambulatory  specialty OPDearly dischargeearly identification of PDD (however ALOS @ 7 days)twice weekly pan - hospital review of patients LOS > 7 / 10 daysenhanced ability to progress patients requiring LTC / HCP - but still delaysCapability

7. Capability7Actions to increase / maximise internal HG capabilityFocus on Hospital Groupdevelop of specialty provisions whereby sites provide complimentary and supportive service delivery rather than parallel segregated service delivery  Beaumont Hospital complex surgery .v. Louth / Cavan short stay simple surgery Connolly short stay surgeryConnolly trauma orthopaedic surgery .v. Cavan (bypass)OLOL trauma / complex surgery .v. Louth Day Care

8. Control8Actions to maximise performancecreation of formal specialty patient pathways across multiple sitescreation of formal movement of specialty surgical capability to across multiple sites capacityoverall control tight (not a democracy)bed access / usage function held centrally, actual service delivery held within directoratesaccess / wait time targets set by hospital seen as important in relationship to directorate / hospital performancetargets simple and realistic not desirable

9. Control9Actions to maximise performancefocus on target achievement rather than describing efforts and energies focus on access times rather than pure volume productivityInternal / external publication of performance - with clear accountability identification across all levelssingular approach to emergency and scheduled care rather than commonly exhibited segregated programmatic approach - requirement to achieve on both (each as important from a patient perspective)investment based on measurable performance metrics, maintenance of investment based on maintenance of performance

10. CULTURE10shift of paradigm of “all external problems requiring external solutions” to “external and internal problems, both requiring external and internal solution / correction” (assertive .v. passive)whilst innovative solutions ideas incorporated, not always following HSE corporate dictatesperformance of hospital held to be very importantopen disclosure internally, as to performance in terms of publication – (good or bad results)internal accountability (yes) but no finger pointing / report card writing / blaming / escalating - focus on identifying and solving rather than describing Actions to maximise performance

11. Performance 2015 / 2016 / 2017 / 2018 1117 / 15 57% reduction ED trolley wait 08:00 (n=5131)ave count 2017 11 / ave count 2015 25 - 56% reductionNon admitted wait time 2018 (ave) 5.42hrs (2015 – 6.02hrs) - 6% reduction Admitted wait time 2018 (ave) 12.42hrs (2015 – 21.3hrs) - 40% reduction Emergency Department - focus Beaumont Hospital16 / 15 - 23% reduction ED Trolley wait 08:00 (n=2064) ave count 2016 19 / ave count 2015 25 - 24% reduction18 / 15 74% reduction ED trolley wait 08:00 (n=3958)ave count 2018 7 / ave count 2015 25 – 74% reduction

12. 12PET> 24 hour ED breaches reported at 8am per monthPerformance - January - July 18/17Discharges from ED - PET > 24 hrsEmergency Department– focus Beaumont Hospitalfocused effort to reduce > 24 hour waits“zero tolerance” approachimprovement demonstratedfocused effort to admit + accommodate or discharge“zero tolerance” approachimprovement demonstrated, but problem not totally removed99% cumulative reduction YTD July - (2015 v’s 2018)- 94% cumulative reduction YTD July - (2015 v’s 2018)

13. 13PerformanceRCSI HG exceeding 2018 national target (improving on 2015)National Performance by Hospital Group ComparatorRCSI HG exceeding 2018 national performanceInpatient / Day Care Elective Access – RCSI HGfocused approach to minimise wait time experienced as apposed to simply increasing activity, but recognising additional treatment requirementtarget drive < 8 months - achieved through internal treatment additionality rather than external4.1% increase elective IP.DC treatments for Beaumont 18/17 YTD (n=1720)

14. Endoscopy - focus reduce wait time rather than treatment volume increase14Beaumont / OLOL / Connolly insourcing  Cavan / Connolly 5877 procedures - 2016 / 2017 / 2018 Performance

15. 15Rapid Access - Beaumont Hospital Cancer Clinics 2018Beaumont Hospital (100%) /National Performance (87.3%) Beaumont Hospital (100%) / National Performance (67.4%)Beaumont Hospital (100%) / National Performance (63.6%)Balance Score Card approach

16. 16PerformanceDelayed Discharges4% reduction 2018 / 2017 YTD (8% increase Jul-18 vs Jul-17)however 2018 monthly average 3640 acute bed days not available for acute patient occupancyequivalent to treatment of 607 patients monthly (based on 6 day ALOS) - 4249 ytd (14 days total activity equivalent for HG)

17. 17PerformancePercent ‘Did not attend’( DNA) of total OPD bookingsduring July 1,745 patients did not attend new scheduled appointmenttotal DNA value YTD = 43,086is there a corollary between DNAs and ED new attendances in regard to how patients access the health system?

18. 18Dis-enablers to improvementApplication of multi million euro fines (SDU) - €64.19m(2016)New laws to penalise hospitals for breaking waiting times (2018) “Punish poor performing HSE managers”(2017)Centralised & hierarchical control of operational policy / practise (2018)Over focus on process description and subsequent validation on whether “process” is being adhered to - rather than outcomes(2017)Deming (incorrect attribution )“you can't manage “it” unless you can measure it”Has become“If you can’t successfully manage “it’’ then measure very often and exhaustively“Heads Will Roll”(2015)“Are you Rounding twice a day”7 Themes belief that solution lies mainly in capability rather than capacity“crisis is not solely due to lack of money”

19. Ending thoughts19further performance improvement / maintenance not possible if ED activity continues to increase> 98% bed occupancy creates significant dysfunctionality by itselfperformance improvements have been achieved, however access times to bed remain too longgiven nature of patient presentation i.e. > 75% exacerbation of chronic disease, alternative management model to current (hospital centric) approach needed - this applies to both inpatient and OPD“standing still” capacity / capability investment needed, as well as parallel funding for a ‘alternative care model’ (community centric)- problem remains, no designed actual alternative model (in enough detail) that can be described, funded and implemented - continue to talk, but no meaningful algorithm No CDM DIY book in the HSE library

20. 20Winter Plan - Statusplans relating to “Winter” requiring “approval” - still not approved additional funding, where identified, still not agreed / rejected - bed opening has a lead in time any target must be realistic, rather than desirableneed consistency in community provision in relationship to LTC / HCP - already examples of services curtailment short term reactive planning to specific periods of the year, cannot continue to be the solution, (Q1 2018 would be the proof of this)is the Task Force the ongoing appropriate control solution no real new practices or ideas, beyond a recognition for alignment and full functionality of necessary capacity, capability and control within HG and CHOdiscourse “needs to avoid bombast, insult and outrage” but still contained within an accountability framework (Obama 04.09.18)should we still be discussing “Winter Planning” when the problem manifests throughout the year