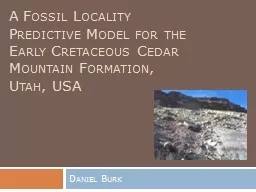
/
A Fossil Locality Predictive Model for the Early Cretaceous Cedar Mountain Formation, A Fossil Locality Predictive Model for the Early Cretaceous Cedar Mountain Formation,

A Fossil Locality Predictive Model for the Early Cretaceous Cedar Mountain Formation, - PowerPoint Presentation

layla
layla . @layla
Follow
342 views
Uploaded On 2022-07-26

A Fossil Locality Predictive Model for the Early Cretaceous Cedar Mountain Formation, - PPT Presentation

Daniel Burk What is a Predictive Model A GIS based model attempting to determine fossil locality potential 1 Start with known fossil localities 2 Compare their characteristics to other places ID: 929351

fossil band locality model band fossil model locality 2015 data field utah cretaceous potential formation america work cedar localities

Share:

Link:

Embed:

Download Presentation from below link

Download Presentation The PPT/PDF document "A Fossil Locality Predictive Model for t..." is the property of its rightful owner. Permission is granted to download and print the materials on this web site for personal, non-commercial use only, and to display it on your personal computer provided you do not modify the materials and that you retain all copyright notices contained in the materials. By downloading content from our website, you accept the terms of this agreement.


Presentation Transcript

Slide1

A Fossil Locality Predictive Model for the Early Cretaceous Cedar Mountain Formation, Utah, USA

Daniel Burk

Slide2

What is a Predictive Model?

A GIS based model attempting to determine fossil locality potential1. Start with known fossil localities2. Compare their characteristics to other places

3. Find similar areas

4. Go look for fossils there

Slide3

Why a Predictive Model?

Nature of field work - chancyPotentially reduce on-the-ground search time

Few published fossil locality predictive models exist

GIS data and software are economically available, additional tools for paleontologists

Slide4

Existing Published Fossil Locality Predictive Models

Conroy et al. (2012) – Eocene formations of Uinta Basin, UT

Egeland

et al. (2010) –

Paleoanthropological

sites in Armenia

Emerson and Anemone (2012) – Great Divide Basin, WY

Malakhov

et al. (2009) - Lower

Syrdarya

Uplift in Kazakhstan

Oheim

(2007) - Two Medicine Formation of Montana

Slide5

Why the Cedar Mountain Formation?

Faunal shift and climatic change in North AmericaHotbed of new discoveries (McDonald et al. 2010;

Senter

et al. 2010;

Senter

et al. 2012a;

Senter

et al. 2012b; Taylor et al. 2011)

Active research, including presentations at this conference (Hendrix et al. 2015;

Jasinski

and Dodson 2015;

Ludvigson

et al. 2015; Suarez et al. 2015).

Accessible field area and GPS data

Slide6

Study Area

Scene LC80360332013162LGN00, Path 36, Row 33 taken June 11, 2013 (natural color composite band combination pictured.)

Slide7

Data Sources

Slide8

Research Methodology

Landsat OLI/TIRS

Landsat Locality

“Clip” (Locality mask)

Summarize Statistics

Landsat Locality Summary

Locality shape

Landsat Formation

“Clip” (Cedar Mtn. Mask)

Summarize Statistics

Slope Locality Summary

Weighted Suitability Analysis

Observations

Difference of Means (X

1

-X

2

)

Difference of Means

Potential Localities

Field Test

Field Data

Cedar Mountain shape

Slide9

Differences of means between fossil localities and CMF (X

1-X2

)

Slide10

Weighted Suitability Analysis

Reclassification of band valuesWeights assigned

Band 1

Band 2

Band 3

Band 4

Band 5

Band 6

Band 7

Band 10

Band 11

% Weight

12%

14%

15%

12%

12%

18%

14%

1%

2%

Slide11

Analysis Results

Slide12

Field Testing

10 high potential sample sites chosen (30m x 30m pixels)Vertebrate fossils found at only one site

Observations:

Steep slopes too dangerous to prospect

Flat slopes had little to no rock outcrop

Model too inclusive

Slide13

Reanalysis

Bands 10 and 11 removedBands reclassified to offer larger range of potential

Weights re-assigned

Band 1

Band 2

Band 3

Band 4

Band 5

Band 6

Band 7

% Weight

12%

14%

16%

12%

13%

19%

14%

Slide14

Reanalysis results

Slide15

Reanalysis results

Unable to field test at this time

No other existing model looks exclusively at spectral reflectance data.

Number of cells assigned to each fossil potential value for the revised model

Slide16

Surface Aspect % of Total

Slide17

Surface slope

75% of BYU fossil localities occur on slopes between 15° and 38° (±1 standard deviation). Only 17% of CMF exposures are in that range. Slopes greater than 45° excluded from the model.

Slide18

Refined Model

Slide19

Model Comparison

Slide20

Model Check and

Additional Field Work

Known fossil localities checked against model for internal consistency

Additional outside sources of locality data

Additional field work data obtained

Mixed results

Fossil Potential Value

1

2

3

4

5

6

7

8

9

Outside

Total

BYU Localities

5

4

4

5

12

68

98

PBDB

1

9

10

Field

Work

3

1

1

1

1

4

11

UGS

1

1

18

20

Slide21

Unresolved Issues

Geologic map accuracy

Microfossil, plant, invertebrate, trace fossil sites ignored

Relative importance of sites not distinguished

Different datasets used different projected coordinate systems

Slide22

Conclusion/Lessons Learned

Successful creation of modelHigh fossil potential areas identified

Landsat 8 data alone not sufficient

Knowledge of environmental factors crucial

GI/GO: Model is no better than the input data

Models

are no substitute for field work, but can be a useful aid to maximize time and resources.

Slide23

List of References

Conroy, G.C., Emerson, C.W., Anemone, R.L., and Townsend, K.E.B., 2012. Let your fingers do the walking: A simple spectral signature model for ‘remote’ fossil prospecting.

Journal of Human Evolution

, 63, 79–84.

Doelling, H.H., 2002. Geologic Map of the Moab and Eastern Part of the San Rafael Desert 30’x60’ Quadrangles, Grand and Emery Counties,

Uah

, and Mesa county, Colorado.

Egeland

, C.P., Nicholson, C.M., and Gasparian, B., 2010. Using GIS and Ecological Variables to Identify High Potential Areas for Paleoanthropological Survey: An Example from Northern Armenia.

Journal of Ecological Anthropology

, 14 (1), 89–98.

Emerson, C.W. and Anemone, R.L., 2012. An artificial neural network-based approach to identifying mammalian fossil localities in the Great Divide Basin, Wyoming.

Remote Sensing Letters

, 3 (5), 453–460.

Hendrix, B., Moeller, A.,

Ludvigson

, G.A.,

Joeckel

, R.M., and Kirkland, J.I., 2015. A New Approach to Date

Paleosols

in Terrestrial Strata: A Case Study Using U-PB Zircon Ages for the Yellow Cat Member of the Cedar Mountain Formation of Eastern Utah. Presented at the 2015 GSA Annual Meeting, Baltimore, Maryland, USA: Geological Society of America.

Jasinski

, S. and Dodson, P., 2015.

Biostratigraphy, Paleobiogeography, and Evolution of

Dromaeosaurids (Dinsauria:

Dromaeosauridae) in North America. Presented at the 2015 GSA Annual Meeting, Baltimore, Maryland, USA: Geological Society of America.Ludvigson, G.A., Gonzalez, L.A., Joeckel

, R.M., and Moeller, A., 2015. Terrestrial Carbonate Records of Cretaceous (Aptian-Albian) Carbon Isotope Excursions from Deposits in North America and China. Presented at the 2015 GSA Annual Meeting, Baltimore, Maryland, USA: Geological Society of America.

Malakhov, D.V., Dyke, G.J., and King, C., 2009. Remote Sensing Applied to Paleontology- Exploration of Upper Cretaceous Sediments in Kazakhstan for Potential Fossil Sites. Palaeontologia Electronica

, 12 (2), 1–10.Oheim, K., 2007. Fossil site prediction using geographic information systems (GIS) and suitability analysis: The Two Medicine Formation, MT, a test case. Palaeogeography, Palaeoclimatology, Palaeoecology, 251 (3/4), 354–365.]

Senter, P., Kirkland, J.I., Bird, J., and Bartlett, J.A., 2010. A new troodontid

theropod dinosaur from the Lower Cretaceous of Utah. PLoS One, 5 (12), 1–5.Senter, P., Kirkland, J.I., and

DeBlieux, D.D., 2012a. Martharaptor greenriverensis, a new

theropod dinosaur from the Lower Cretaceous of Utah. PLoS One, 7 (8), 1-12.

Senter, P., Kirkland, J.I., DeBlieux, D.D., Madsen, S., and Toth, N., 2012b. New

dromaeosaurids (Dinosauria

: Theropoda) from the Lower Cretaceous of Utah, and the evolution of the dromaeosaurid tail. PLoS

One, 7 (5), 1–20.Suarez, M.B., Suarez, C., You, H., and Kirkland, J.I., 2015. The Early Cretaceous Chemostratigraphic

and Paleoclimate Record of Northwest China and Western North America. Presented at the 2015 GSA Annual Meeting, Baltimore, Maryland, USA: Geological Society of America.

Taylor, M.P., Wedel, M.J., and Cifelli

, R.L., 2011. A new sauropod dinosaur from the Lower Cretaceous Cedar Mountain Formation, Utah, USA. Acta

Palaeontologica Polonica, 56 (1), 75–98.

Slide24

Acknowledgements

Thanks to Dr. Rodney Scheetz

at the Brigham Young University Museum of Paleontology for providing fossil locality data with which to begin the analysis.

Field work was conducted under the following permits: Utah State Permit #2015-457, Utah BLM Permit #UT08-006C, and Utah BLM Permit #UT08-014C.

Thanks to Martha Hayden (UGS) and Rebecca Hunt-Foster (BLM-UT) for providing additional fossil locality data.

Thanks to

Paleobiology

Database for providing locality data.

Thanks to Stephen

Sandau

, Dr. Brooks Britt, Garrett

Tournear

, Shaun McClure, Lindsay Beasley, Dr. Rodney

Scheetz

, Aaron

Scheetz

, Austin

Scheetz

, and Alexandra

Scheetz

for help with field work.

Thanks to my thesis advisor and committee Dr. Yi-

Hwa Wu, Dr. Ming Hung, & Dr. John P. Pope.Thank to William and Patricia Burk, Melissa and Ryan

DeLange, and Stephen Sandau for helping me to get here.

Thanks to my wonderful wife, Faith, and our great kids, Grace, Joy, Titus, Tommy, Timmy, and #6.

Slide25

Questions?