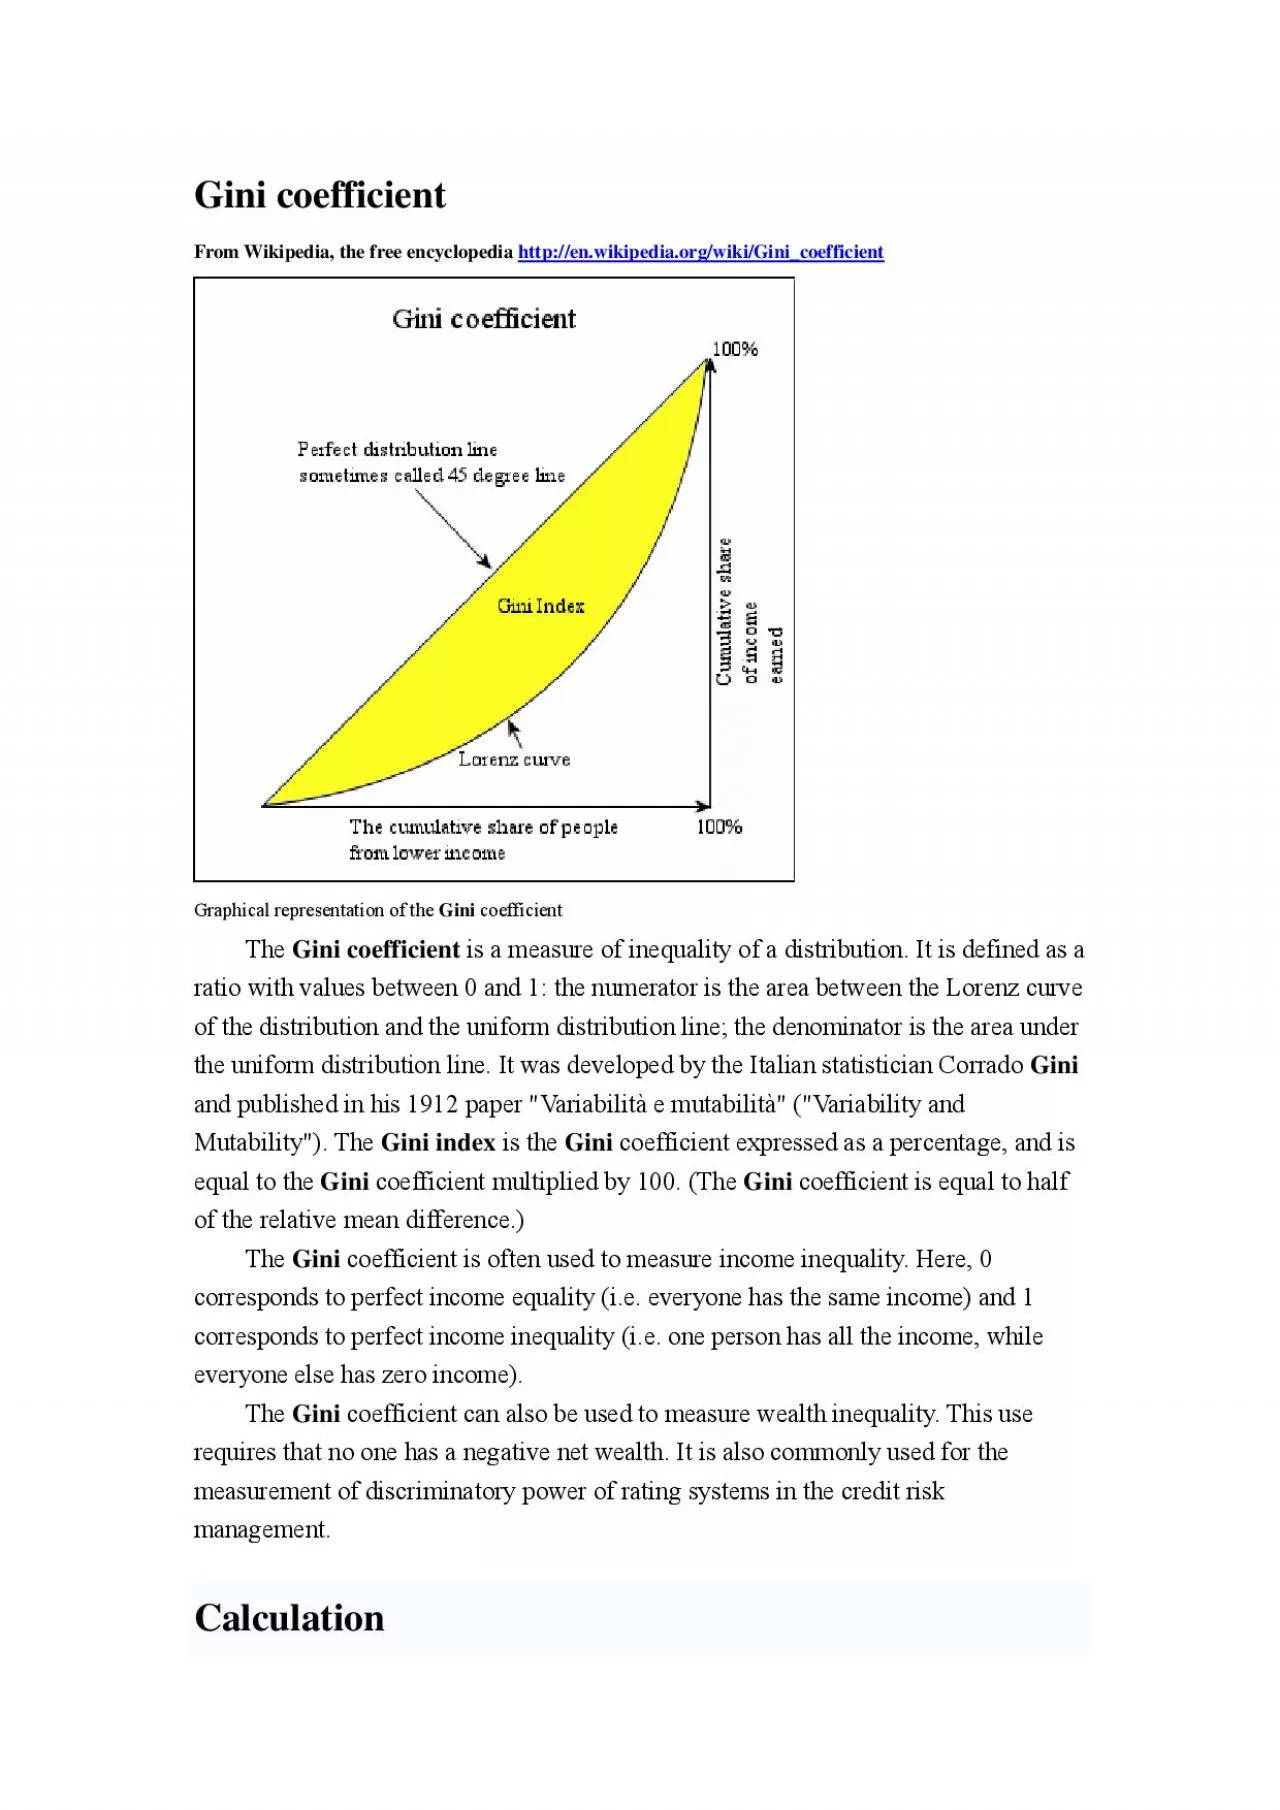
PDF-The Gini coefficient is defined as a ratio of the areas on the Lorenz
Author : layla | Published Date : 2021-08-07
diagram If the area between the line of perfect equality and Lorenz curve is A and the area under the Lorenz curve is B then the Gini coefficient is AAB Since AB
Presentation Embed Code
Download Presentation
Download Presentation The PPT/PDF document "The Gini coefficient is defined as a rat..." is the property of its rightful owner. Permission is granted to download and print the materials on this website for personal, non-commercial use only, and to display it on your personal computer provided you do not modify the materials and that you retain all copyright notices contained in the materials. By downloading content from our website, you accept the terms of this agreement.
The Gini coefficient is defined as a ratio of the areas on the Lorenz: Transcript
diagram If the area between the line of perfect equality and Lorenz curve is A and the area under the Lorenz curve is B then the Gini coefficient is AAB Since AB 05 the Gini coefficient G 2A 12B. Arrange the data from lowest to highest Bill 1500 Zak 2000 Robert 8000 Jose 9000 Erika 10000 Kai 12000 Juan 15000 Harry 16000 Kathleen 20000 Emily 30000 2 Calculate the total income 12350000 3 Divide into quintiles 105 2 earners in each quintil e and regression. Scatter plots. A scatter plot is a graph that shows the relationship between the observations for two data series in two dimensions.. Scatter plots are formed by using the data from two different series to plot coordinates along the . During the last century there were three revolutions in Physics:. General Relativity, Quantum Mechanics and Chaos. . Low dimensional chaos applications range from atmospheric physics, to astronomy,. Mensurationists. 2013 . Leavenworth, WA, USA. Where’s Waldo? . Stand structure indices and maximum density relationships.. Ian Moss. , PhD, RPF Tesera Systems Inc.. Valerie LeMay, PhD, RPF University of British Columbia. GINI Coefficients. Author: Zack Beamer. How severe is income inequality?. How can this be measured?. Ratio of CEO to Worker pay. †:. 354 to 1. Workers: $34,645. S&P 500 CEOs: $12,259,894. Is this a rigorous method of measuring inequality?. Goal of Equity in Income distribution: . is to have a more equitable (fairer) distribution of income. That means productive income is divided among the members of the economy more equitably.. TARGET – . Human Development. Group 6. Ethological Theory. stresses that behavior is strongly influenced by biology and is tied of evolution. characterized by critical or sensitive periods. . these are specific time frames during which, according to . THREE NOVEL FACTORS AFFECTING HEDGE FUND RETURNS China Derivatives Market Conference (CDMC) May 20, 2016 – Suzhou, China L. Mick Swartz (PhD, CAIA) University of Southern California Marshall School of Business THREE NOVEL FACTORS AFFECTING HEDGE FUND RETURNS China Derivatives Market Conference (CDMC) May 20, 2016 – Suzhou, China L. Mick Swartz (PhD, CAIA) University of Southern California Marshall School of Business Lecture 18. Chapter 19. Income Inequality. 2017 Economics 101 CCC. content. Income inequality defined. Methods to review income inequality . 2. Income inequality. 3. Income inequality - basics. Inequality measures the disparity between a percentage of population and the percentage of resources (such as income) received by that population. . nrrnnrrrrnrnrrnnnrr nrrrr rnrrrnn rrrrrr0 dxnnrnrrr 20331522201 nrrnr--nr193296212009nrrnrnrr rrnr23x313nrnr56x216rrnr35x425rnrrnr rnnnn r rrnnnn Module 040Inequality Analysis The Gini Index EASYPol Module 040 Analytical Tools 2 CONCEPTUAL BACKGROUND The Gini Index is an inequality measure that is mostly associated with the descriptive easureme nrrnnrrrrnrnrrnnnrr nrrrr rnrrrnn rrrrrr0 dxnnrnrrr 20331522201 nrrnr--nr193296212009nrrnrnrr rrnr23x313nrnr56x216rrnr35x425rnrrnr rnnnn r rrnnnn . Princeton Williams. Senior Economic Education Specialist. The opinions expressed are solely those of the presenters and do not reflect the opinions of the Federal Reserve Bank of Dallas or the Federal Reserve System. .
Download Document
Here is the link to download the presentation.
"The Gini coefficient is defined as a ratio of the areas on the Lorenz"The content belongs to its owner. You may download and print it for personal use, without modification, and keep all copyright notices. By downloading, you agree to these terms.
Related Documents