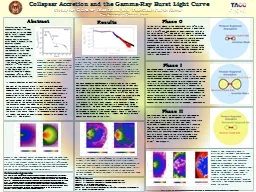
PPT-Comparing Data from MD simulations and X-ray Crystallograph
Author : liane-varnes | Published Date : 2017-01-29
What can we compare 3D shapes Scalar coupling constants aka Jvalues nuclear Overhauser effects Atomic motions RMSF Order Parameters NOE intensities may be used
Presentation Embed Code
Download Presentation
Download Presentation The PPT/PDF document "Comparing Data from MD simulations and X..." is the property of its rightful owner. Permission is granted to download and print the materials on this website for personal, non-commercial use only, and to display it on your personal computer provided you do not modify the materials and that you retain all copyright notices contained in the materials. By downloading content from our website, you accept the terms of this agreement.
Comparing Data from MD simulations and X-ray Crystallograph: Transcript
Download Rules Of Document
"Comparing Data from MD simulations and X-ray Crystallograph"The content belongs to its owner. You may download and print it for personal use, without modification, and keep all copyright notices. By downloading, you agree to these terms.
Related Documents