/
Indexes of the Foreign Exchange Value of the Dollar Mico Loretan of the Boards Division Indexes of the Foreign Exchange Value of the Dollar Mico Loretan of the Boards Division

Indexes of the Foreign Exchange Value of the Dollar Mico Loretan of the Boards Division - PDF document

liane-varnes
liane-varnes . @liane-varnes
Follow
455 views
Uploaded On 2014-11-10

Indexes of the Foreign Exchange Value of the Dollar Mico Loretan of the Boards Division - PPT Presentation

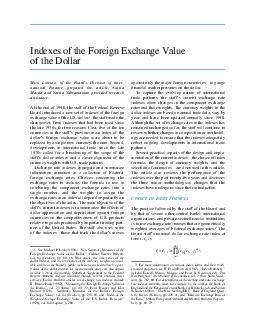
Autria Mazda and Sarita Subramanian provided research assistance At the end of 1998 the staff of the Federal Reserve Board introduced a new set of indexes of the foreign exchange value of the US dollar 1 The staff made the changeover from indexes th ID: 9732

Autria Mazda and Sarita

Share:

Link:

Embed:

Download Presentation from below link

Download Pdf The PPT/PDF document "Indexes of the Foreign Exchange Value of..." is the property of its rightful owner. Permission is granted to download and print the materials on this web site for personal, non-commercial use only, and to display it on your personal computer provided you do not modify the materials and that you retain all copyright notices contained in the materials. By downloading content from our website, you accept the terms of this agreement.


Presentation Transcript

Indexes of the Foreign Exchange Value of the Dollar Mico Loretan, of the Board’s Division of Inter­national Finance, prepared this article. Autria Mazda and Sarita Subramanian provided research At the end of 1998, the staff of the Federal Reserve Board introduced a new set of indexes of the foreign exchange value of the U.S. dollar.The staff made the changeover, from indexes that had been used since the late 1970s, for two reasons. First, Þve of the ten currencies in the staffÕs previous main index of the dollarÕs foreign exchange value were about to be replaced by a single new currency, the euro. Second, developments in international trade since the late 1970s called for a broadening of the scope of the staffÕs dollar indexes and a closer alignment of the currency weights with U.S. trade patterns. Exchange rate indexes aggregate and summarize information contained in a collection of bilateral foreign exchange rates. Choices concerning the exchange rates to include, the formula to use in combining the component exchange rates into a single number, and the weights to assign the exchange rates in an index all depend importantly on the objectives of the index. The main objective of the staffÕs current indexes is to summarize the effects of dollar appreciation and depreciation against foreign currencies on the competitiveness of U.S. products relative to goods produced by important trading partners of the United States. The staff also uses some of the indexesÑthose that track the dollarÕs moves 1. Michael P. Leahy (1998), ÔÔNew Summary Measures of the Foreign Exchange Value of the Dollar,ÕÕ Federal Reserve Bulletinvol. 84 (October), pp. 811Ð18. That article, the time series of the dollar indexes, and the time series of the currency weights are avail on line at the BoardÕs public website (www.federalreserve.gov). alues of the dollar indexes for recent months and years also appear in table 3.28 of the monthly Statistical Supplement to the Federal Reserve Bulletin and are available through several Þnancial news services. Earlier articles on exchange rate indexes include Dianne Pauls (1987), ÔÔMeasuring the Foreign Exchange Value of the Dollar,ÕÕ vol. 73 (June), pp. 411Ð22; Peter Hooper and John Morton (1978), ÔÔSummary Measures of the DollarÕs Foreign Exchange Value,ÕÕ vol. 64 (October), pp. 783Ð89; and ÔÔIndex of the Weighted-Average Exchange Value of the U.S. Dollar: RevisionÕÕ (1978), vol. 64 (August), p. 700. against only the major foreign currenciesÑto gauge Þnancial market pressures on the dollar. To capture the evolving nature of international trade patterns, the staffÕs current exchange rate indexes allow changes in the component exchange rates and their weights. The currency weights in the dollar indexes are based on annual trade data, vary by year, and have been updated annually since 1998. Although the set of exchange rates in the indexes has remained unchanged so far, the staff will continue to review whether changes in composition or methodology are needed to ensure that the indexes adequately reßect ongoing developments in international trade patterns. Several practical aspects of the design and implementation of the current indexesÑthe choice of index formula, the design of currency weights, and the selection of currenciesÑare discussed in this article. The article also reviews the performance of the indexes over the past twenty-Þve years and discusses the three minor methodological changes that the indexes have undergone since their introduction. HOICE OF The practice followed by the staff of the Board and by that of several other central banks, international organizations, and private-sector Þnancial institutions is to use exchange rate indexes that are geometrically weighted averages of bilateral exchange rates.Board staffÕs nominal dollar exchange rate index at ,is 2. more information on various index forms and their mathematical properties, see W. Erwin Diewert (1987), ÔÔIndex Numbers,ÕÕ in John Eatwell, Murray Milgate, and Peter K. Newman, eds., New Palgrave: A Dictionary of Economics, vol. 2 (New York: Stock-ton), pp. 767Ð80. For descriptions of the sterling and euro exchange rate indexes currently used, for example, by the staff of the Bank of England and the European Central Bank, see Birone Lynch and Simon Whitaker (2004), ÔÔThe New Sterling ERI,ÕÕ Bank of England Quar­terly Review (Winter), pp. 429Ð41; and ÔÔEffective Exchange Rate of the EuroÕÕ (2004), European Central Bank Monthly Bulletin ber), pp. 68Ð72. ��2 &#x/Att;¬he; [/;&#xTop ;&#x]/BB;&#xox [;‰ 7; 1; 7;G ];&#x/Typ; /P; gin; tio;&#xn 00;&#x/Att;¬he; [/;&#xTop ;&#x]/BB;&#xox [;‰ 7; 1; 7;G ];&#x/Typ; /P; gin; tio;&#xn 00;Federal Reserve Bulletin Winter 2005 is the value of the index at time are the prices of the U.S. dollar in terms of foreign currency at times is the weight of currency in the index at time ) is the number of foreign currencies in the index at time , and =1.Because the weights are based on annual data on international trade, they are constant within a calendar year, as is explained later in more detail. The staff chose geometric rather than simple arith­metic averaging for its exchange rate indexes because under geometric averaging, proportionately equal appreciation and depreciation of a currency has the same numerical effect (though of opposite sign) on the index. In an arithmetically averaged exchange rate index, such changes result in an upward bias in the index for the dollar. The upward bias is less of a problem if major components move in the same direction, but this condition is often not met by bilateral exchange rates.If a currency depreciates persistentlyfor exam­ple, because of high domestic inan exchange rate index that includes that currency will increase markedly even if the currencys weight is small.When ination experiences abroad differ signicantly from those in the United States, real rather than nominal exchange rates are more informative for measuring changes in trade competitiveness. The staffs real exchange rate indexes are obtained by replacing the nominal exchange rates, , with their real counterparts, , where consumer price indexes for the United States and 3. formula allows both the number of exchange rates in the index and the weights of the exchange rates to vary over time. Calculating the index is simplied considerably, of course, if the number of currencies and the currency weights remain unchanged. In such a case, the index calculations are said to ÕÕÑthat is, the net change in the index over a period depends only on the net changes in the bilateral exchange rates but not on the trajectories of the rates. 4. staff has used geometrically averaged exchange rate indexes since 1978. The Laspeyres and Paasche indexes are examples of arithmetically averaged indexes. 5. an illustration of the effects of currency depreciation on a nominal index, see the later discussion of the evolution of the staffbroad nominal dollar index over the past twenty-ve years. 6. set of internationally traded goods may not be well approxi­mated by the baskets of goods purchased by consumers in various countries. In general, producer price indexes tend to be better mea­sures of ination for gauging changes in real international compe­titiveness. Unfortunately, producer price indexes are not as widely available as consumer price indexes. Consumer price indexes have the important additional advantage of being available at monthly frequencies and with little delay for most economies of interest, including all economies whose currencies are in the exchange rate ESIGN OF URRENCY To create an operational exchange rate index, one must not only choose a formula for aggregating bilat­eral exchange rates into a single number but also devise methods for calculating the weights of those currencies and for selecting the currencies to be included in the index. Because the staffs exchange rate indexes are intended primarily to measure the competitiveness of U.S. goods in international trade, the exchange rates in the indexes are those of econo­mies that gure importantly in international trade with the United States. These economies can be important either because the United States imports substantial amounts of goods from them or because the United States exports products that compete with goods produced in those economies. Exchange rates uence competitiveness because they affect the relative prices of goods as perceived by sellers and buyers. The weights associated with each of the currencies are designed to reect the importance of the respective economies for trade competition.Competition in traded goods occurs in both domes­tic and foreign markets. In U.S. markets, goods that are produced abroad and are imported to the United States compete with domestically produced goods. To capture this form of trade competition, economy s share of total U.S. merchandise imports is chosen as that economys bilateral import weight during represents the merchandise imports from to the United States in year trade patterns generally move little over short periods of time, the staff chose to base the import weights (and the other measures of trade competition intro­duced in the next two paragraphs) on annual rather 7. staffs system of currency weights is based on a stylized model of international trade in differentiated products. For an over­view of that model, see Leahy, New Summary Measures; for a full exposition, see Anne K. McGuirk (1986), Measuring Price Competi­tiveness for Industrial Country Trade in Manufactures,IMF Working Paper WP/87/34 (Washington: International Monetary Fund). This trade model suggests that only trade in differentiated products is affected by exchange rate uctuations, and it also implies that all international trade in undifferentiated products (and hence in most primary commodities) should be excluded to obtain the appropriate currency weights. 8. , data limitations make the consistent exclusion of most commodities from bilateral merchandise trade statistics imprac­tical. However, the calculations exclude imports of crude oil to the United States. 3 Indexes of the Foreign Exchange Value of the Dollar than higher-frequency trade data to simplify the index calculations. Therefore, the weights are constant within a calendar year. Tradable goods produced in the United States com­pete with those from economy in two additional ways. First, economy may be a direct purchaser of U.S. products. This form of trade competition is measured by that economys U.S. bilateral export N(t) US, j,t = XUS, j,t XUS, j,t ,/ j =1 represents the merchandise exports from the United States to economy in year Second, U.S.-produced goods may also compete with goods produced in economy if the United States and economy both export goods to buyers in third-market economies. To measure this form of competition, the staff calculates third-market com­petitiveness weights. These weights are dened as N(t) US, j,t =  US,k,t áµk, j,t /(1  µk,US,t), k  j, k  US where µis the fraction of economy s merchan­dise imports from country in year and where The multiplicative factor 1/(1 ) ensures that the weights sum to 1.The U.S. third-market com­petitiveness weight of economy is a weighted aver­age of the third-market economiesU.S. bilateral export shares, where the weights are given by bilateral shares of those economiesthe U.S. third-market competitiveness weight of econ­is large if economy gures prominently in the imports of those economies for which the United States has large bilateral export weights. The overall, or combined, weights of the curren­cies in the dollar indexes are calculated as the follow­ 9. computations of the bilateral export weights exclude U.S. exports of gold and military goods. For the rst few years after the current indexes were introduced, the computations also excluded U.S. agricultural exports, but the staff decided in 2002 to drop that exclu­sion. This methodological change is discussed in more detail later in this article. 10. principle, the bilateral import weights µexclude oil imports (and, ideally, other primary commodities) to ensure symmetric treatment with the U.S. bilateral import weights. However, data limitations make this adjustment infeasible for several countries that are major U.S. trading partners. Therefore, the bilateral import weights used by the staff in its calculations of U.S. third-market competitiveness weights include oil imports. 11. U.S. third-market competitiveness weight of economy can also be interpreted as a weighted average of s bilateral shares of the third-market economiesimports, where the weights are given by those economiesU.S. bilateral export shares. ing linear combination of the three submeasures of the degree of trade competition: 1 1 1 wj,t = 2µUS, j,t +2 US, j,t +2US, j,t ).2 The coefcients of the three submeasures were chosen to give equal importance to competition from imports in U.S. markets and to competition from U.S. exports in foreign markets.In addition, equal importance is given to the bilateral export weights and to the weights that summarize competition in third markets.ELECTION OF URRENCIES The staff selected currencies for inclusion in three indexes: the broad index, the major currencies index, and the other important trading partners (OITP) index. The following sections describe these indexes and the associated processes of currency selection. The Broad Index The currencies chosen for inclusion in the broad dollar index in 1998 were determined pragmatically as those of economies whose bilateral shares of U.S. imports or exports exceeded 1 percent in 1997, the latest year for which complete annual trade data were then available. On the basis of this criterion, the staff selected twenty-six currencies. Anticipating the adop­tion of the euro at the end of 1998 by eleven mem­ber countries of the European Union (EU), the staff designed the index so that a single weight for the euro could capture the inuence of the dollarexchange rate on trade competition between the United States and the euro area. 12. choice is somewhat arbitrary. Changing the relative impor­tance of the three submeasures of the degree of trade competition obviously affects the overall currency weights and hence may affect the exchange rate indexes. Although varying the relative importance of the three submeasures would have affected the trajectories of the dollar indexes somewhat during the 1970s and the early 1980s, such variations mattered fairly little from about 1985 on, at least when some appreciable weight is given to each of the three submeasures. The staff therefore chose to maintain its current set of weights on the three submeasures. 13. work done in 1998 with the staffs trade model showed that an equal weighting of the two measures of export competitiveness performed well in explaining U.S. core exports, and this performance provided a rationale for giving equal importance to these two measures. Core exports are merchandise exports other than agricultural goods, computers, and semiconductors. 14. shares of the eleven initial euro-area countries in U.S. imports and exports were summed to obtain the bilateral import and export weights of the aggregate euro-area economy for the years ��4 &#x/Att;¬he; [/;&#xTop ;&#x]/BB;&#xox [;‰ 7; 1; 7;G ];&#x/Typ; /P; gin; tio;&#xn 00;&#x/Att;¬he; [/;&#xTop ;&#x]/BB;&#xox [;‰ 7; 1; 7;G ];&#x/Typ; /P; gin; tio;&#xn 00;Federal Reserve Bulletin Winter 2005 1. Share of U.S. imports, by economy, 1997 and 2003 Percent except as noted 19.55 17.78 uro area ................. 14.18 16.22 2.04 hina ..................... 7.77 13.53 5.76 9.70 10.90 1.20 15.21 10.49 3.82 3.31 orea ..................... 2.88 3.27 .39 aiwan ................... 4.08 2.80 alaysia .................. 2.23 2.24 .01 razil ..................... 1.18 1.41 .23 hailand .................. 1.58 1.35 2.50 1.34 ndia ..................... .91 1.14 .23 srael ..................... .92 1.13 .21 witzerland ............... 1.06 .97 .90 .96 .06 hilippines ................ 1.31 .89 1.09 .81 1.29 .79 ustralia .................. .53 .54 .01 ussia .................... .53 .47 .33 .32 hile ..................... .29 .32 .03 .21 .17 rgentina ................. .21 .16 .07 .07 .00 Total ..................... 94.33 93.38 .95 2. Share of U.S. exports, by economy, 1997 and 2003 except as noted 23.28 23.90 .62 uro area ................. 14.57 15.52 .95 10.69 13.71 3.02 8.78 7.12 5.42 4.48 hina ..................... 1.81 4.00 2.19 orea ..................... 3.52 3.28 aiwan ................... 2.68 2.40 2.80 2.28 2.14 1.91 ustralia .................. 1.88 1.79 razil ..................... 2.48 1.57 alaysia .................. 1.60 1.53 hilippines ................ 1.06 1.12 .06 srael ..................... .75 .86 .11 witzerland ............... .78 .84 .06 hailand .................. 1.05 .79 ndia ..................... .56 .69 .13 1.04 .60 .75 .52 .50 .44 .97 .39 hile ..................... .69 .38 .61 .35 .35 .34 rgentina ................. .88 .34 Total ..................... 91.64 91.18 .46 Imports exclude oil. Here and in the following tables, components may not sum to totals because of rounding. International Monetary Fund (various years), Direction of Trade (Washington: IMF); Census and Statistics Department (various years), Annual Review of Hong Kong External Trade (Hong Kong: CSD); Director­ate General of Budget, Accounting, and Statistics (various years), Yearbook of the Republic of China (Taipei: DGBAS); Directorate General of Customs (various years), Monthly Statistics of Exports: Taiwan District, the Republic of China, December Issue, Part 2 (Taipei: DGC); Directorate Gen­eral of Customs (various years), Monthly Statistics of Imports: Taiwan District, the Republic of China, December Issue (Taipei: DGC). Trade with the twenty-six economies represented in the broad index accounted for well over 90 percent of total U.S. imports and exports in 1997 (tables 1 and 2). Although the U.S. import and export weights of several of these economies have shifted in the intervening years, in some cases considerably, these twenty-six economies still accounted for more than 90 percent of U.S. trade in 2003. Changes in U.S. trading patterns are also reected in changes in some of the U.S. bilateral import and export shares. For example, between 1997 and 2003, the largest before and after the creation of the euro. Because trade among the euro-area countries does not affect the competitiveness of euro-area and U.S. products in third markets, the staff chose in 1998 to exclude trade among the economies of the EU when calculating the U.S. third-market competitiveness weights, again for the years before and after the creation of the euro. This methodology was modied in 2003, as is described later. For the years before the creation of the euro, the broad index is based on dollar exchange rates for thirty-ve curren­cies, and index calculations for those years use separate currency weights for the ten precursor currencies that merged into the euro at the end of 1998. The currency weights for the ten precursor currencies can be summed to obtain an implied weight for the eleven-country euro area. (Belgium and Luxembourg used the same currency before both countries adopted the euro.) Exports exclude gold and military items. See table 1. increases in U.S. bilateral import shares were recorded by China (5percentage points) and the euro area (2 percentage points) (table 1). In contrast, s share of U.S. imports dropped 4points, and the U.S. import shares of Canada, Taiwan, and Singapore decreased 1percentage points. Meanwhile, the largest increases in U.S. bilateral export shares were recorded by Mexico (3 percentage points) and China (nearly 2percentage points), and the largest decreases were registered by Japan, the United Kingdom, and Brazil, whose export shares declined 1percentage points (table 2). 2003, no economies excluded from the broad dollar index had shares of total U.S. imports or exports that exceeded For example, none of the U.S. bilateral import and export shares of the ten countries (located mainly in central and east­ern Europe) that were admitted to membership in the EU in 2004 reached Hence, the staff chose to augment its indexes with additional currencies at this time. 15. second, necessary condition for including a currency in the staffs dollar indexes is ready availability of consumer price data for the economy in question. 16. an additional EU member country adopts the euro as its currency, the staff will factor its trade into the calculation of the euroweights in the dollar indexes. This treatment is analogous to the way the staff factored in Greeces trade ows when Greece adopted the euro as its currency in 2001. For more details on this action, see the discussion later in this article. 5 of the Foreign Exchange Value of the Dollar Currency weights in the broad dollar index, 1997 and 2003 Percent except as noted Euro area 17.49 18.80 1.31 16.92 16.43 hina ..................... 6.58 11.35 4.77 14.27 10.58 8.50 10.04 1.55 5.73 5.17 orea ..................... 3.68 3.86 .18 aiwan ................... 3.77 2.87 2.65 2.33 alaysia .................. 2.25 2.24 2.87 2.12 razil ..................... 1.82 1.79 1.43 1.44 .01 hailand .................. 1.59 1.43 1.31 1.25 1.22 1.16 ndia ..................... .88 1.14 .26 hilippines ................ 1.18 1.06 srael ..................... .84 1.00 .16 1.25 .95 ussia .................... .78 .74 .80 .61 hile ..................... .53 .49 rgentina ................. .61 .44 .49 .41 .58 .30 Total ..................... 100 100 0 Memo: Major currencies 58.37 54.84 eights are different from those given in table 1 of Michael P. Leahy New Summary Measures of the Foreign Exchange Value of the Dollar,Federal Reserve Bulletin, vol. 84 (October), pp. 81118. The differ­ences are due both to updated data for 1997 and to a change in methodology, which is discussed in this article. Currency is in the major currencies index. See table 1. Some of the combined currency weightsthe lin­ear combinations of bilateral import weights, bilateral export weights, and third-market competitiveness of the twenty-six currencies in the broad dollar index underwent substantial changes between 1997 and 2003 (table 3). Reecting the changes in U.S. bilateral import and export shares discussed ear­lier, the largest increases in currency weights were recorded by China (4percentage points), Mexico percentage points), and the euro area (slightly more than 1percentage points), whereas the cur­rency weight of Japan fell almost 3points and the currency weights of Taiwan and Sin­gapore declined 1 percentage point. The euro and the Canadian dollar remain the currencies with the largest weights in the broad dollar index, whereas the currencies of China, Japan, and Mexico now have roughly equal weights at a slightly lower but still substantial level. In 2003, the sum of the currency weights of these ve economies exceeded 67 percent. broad-index weights of these top ve cur­rencies evolved in different ways between 1980 and Percent China Mexico 5 10 15 20 2004200019961992198819841980 Euro area Canada Japan . Weights vary by year. 2004 (gure 1).The weight of the Japanese yen rose in the early 1980s but declined signithroughout much of the 1990s, whereas the weights of the euro and the Canadian dollar, while somewhat from year to year, changed little on bal­ance. The weights of the Mexican peso and espe­cially the Chinese renminbi increased steadily over time. Indeed, according to the latest available annual trade data, the weight of the renminbi in the broad index now exceeds that of the yen and the peso. Taken together, these uctuations illustrate the impor­tance of regularly updating currency weights if an exchange rate index is to capture the implications of changing patterns of trade for the competitiveness of U.S. products in international trade. The Major Currencies Index and the OITP Index Seven of the twenty-six currencies in the broad the euro, Canadian dollar, Japanese yen, Brit­ish pound, Swiss franc, Australian dollar, and Swed­ish kronatrade widely in currency markets outside their respective home areas, and these currencies (along with the U.S. dollar) are referred to by the s staff as currencies. The remaining nineteen currencies in the broad index are those of what the staff refers to as the other important trad­ing partners(OITP) of the United States. On the basis of these distinctions, the staff created two subin­dexes of the broad dollar index that correspond to For now, the weights in 2003 and 2004 are the same because they are both based on annual trade data for 2003. The weights for 2004 will be revised after trade data for that year become available. . Data are monthly averages of daily values. contrast, at the end of 2004, the real OITP index was nearly 40 percent above its level in January 1980. The net increase appears mainly to reect the sus­tained gain experienced during the 1980s, which was not fully reversed even as the real major currencies index declined substantially during the second half of the 1980s and in the early 1990s. Over the past twenty years, the real OITP index has changed little on balance. In contrast to the evolution of the real dollar indexes, the nominal broad index and especially the nominal OITP index have trended strongly upward since 1980 (gure 3). (Note that the vertical scales in gure 3 differ by a factor of ten.) The main reason for the sustained increase is that several of the currencies in the OITP index (and hence also in the broad index) have depreciated sharply in nominal terms, usually because of high ination in the respective economies. The nearly fortyfold net increase in the nominal OITP index over this period stands in stark contrast to the net increase of about 40 percent in the real currencies indexes over the past quarter-century was also a feature of the alternative indexes, an indication that the lack of drift is not an artifact of chained weights. The failure of the real OITP index to exhibit noticeable long-term downward drift over the past two decades is somewhat puzzling because the currencies of emerging-market economies may be expected to experience secular real appreciation against the dollar and other major currencies. Balassa (1964) and Samuelson (1964) argued that because technological progress tends to be concentrated in the production of internationally tradable goods, economies that experi­ence sustained rapid technological progress, such as many emerging-market economies, should exhibit a long-term rising real exchange rate in terms of price indexes, such as consumer price indexes, that include nontradables. See Bela Balassa (1964), The Purchasing-Power Parity Doctrine: A Reappraisal,Journal of Political Economyvol. 72 (December), pp. 58496; and Paul A. Samuelson (1964), Theoretical Notes on Trade Problems,Review of Economics and , vol. 46 (May), pp. 145 7 of the Foreign Exchange Value of the Dollar 3. Nominal broad and OITP indexes of the foreign exchange value of the U.S. dollar, 1980Ð2004 January 1980 = 100 January 1980 = 100 1,000 2,000 4,000 OITP 100 200 400 2004200019961992198819841980 Broad 4. Nominal major currencies and G-10 indexes of the foreign exchange value of the U.S. dollar, 1980Ð2004 January 1980 = 100 G-10 100 120 140 Major currencies Introduction of euro (January 1, 1999) 1980 1984 1988 1992 1996 2000 2004 . Data are monthly averages of daily values. OITP index that was noted earlier. This difference illustrates dramatically that nominal exchange rate indexes are poor measures of trade competitiveness when ination rates abroad differ widely from those in the United States. Two dollar indexes, the major currencies index and its precursor, the G-10 index, cover currencies of economies that experienced ination rates roughly similar to those in the United States during the past three decades. Thus, even without adjustments for prices, the evolution of these indexes can be informa­tive regarding long-term trends in the competitive­ness of U.S. goods relative to those of other industrial economies (gure 4).The G-10 dollar index, cre­ in the late 1970s, was based on ten major curren­cies, including ve European currencies that later merged into the euro. With the adoption of the euro by Germany, France, Italy, the Netherlands, Belgium, and Luxembourg at the beginning of 1999, this index effectively became a six-currency index. The major currencies index includes the same six currencies as the G-10 indexthe euro, Canadian dollar, Japa­nese yen, British pound, Swiss franc, and Swedish and also the Australian dollar. The main dif­ference between the two indexes is that the major currencies index gives considerably less weight to the euro and more weight to the Canadian dollar than the G-10 index.A second important difference is in the updating of the currency weights: The major currencies index uses weights that vary by year, 21. no longer maintained by the Boards staff, the G-10 index is still followed in the nancial community, in part because it forms the basis of certain exchange-traded futures 22. currency weights in the G-10 index are multilateral weights, which are dened as the share of total trade (exports plus ��8 &#x/Att;¬he; [/;&#xTop ;&#x]/BB;&#xox [;‰ 7; 1; 7;G ];&#x/Typ; /P; gin; tio;&#xn 00;&#x/Att;¬he; [/;&#xTop ;&#x]/BB;&#xox [;‰ 7; 1; 7;G ];&#x/Typ; /P; gin; tio;&#xn 00;Federal Reserve Bulletin Winter 2005 whereas the currency weights of the G-10 index are Even though these two nominal indexes have evolved roughly similarly on balance over the past ve years, the G-10 index has witnessed tuations of a greater amplitude during certain sub-periods, especially from 1980 to 1988 and again from 1999 to the present. These two subperiods were char­acterized by greater volatility of the dollar against the European currencies than against several other currencies, especially the Canadian dollar. The large weight of the euro (and of its precursor currencies) in the G-10 index, together with the fact that the swings in the dollars exchange value against the euro were large over the two subperiods, explains most of the higher amplitude of the swings in the G-10 index. The staff views the major currencies index as a better indicator of the evolution of the competitiveness of U.S. products against those made in the other major-currency economies, especially over the period since the euro was introduced as a traded currency. EVISION OF URRENCY EIGHTS AND MPLEMENTATION OF Because the currency weights of the staffs dollar indexes are based on annual data on international trade, these weights will change as new trade data are received. For example, during most of 2003, index calculations for days or months in 2003 were based on annual trade data for 2001, the latest year for which such data were then available. In late 2003, after annual trade data for 2002 were published, the currency weights for 2003 were updated, and that revision led to an update of the indexes as well. After 2003 trade data became available late in 2004, the indexes for dates in 2003 were updated yet again. In addition, past international trade data are occasion­ally re-benchmarked and revised to incorporate new information on trade ows and to correct previous errors and omissions. Such changes may lead to further revisions of the trade-based currency imports) of the foreign economies in the index. Largely because the gures underlying these multilateral trade weights included trade among the six countries that eventually became part of the euro area, the weight of the euro in the G-10 index (obtained by summing the individual currency weights for Germany, France, Italy, the Netherlands, and Belgium/Luxembourg) is larger than its weight in the major currencies index. Such revisions are usually minor for years that precede the immediately previous year. Another source of occasional revisions stems from methodological changes. Three such changes have been implemented since the current set of dollar indexes was introduced in late 1998. First, after Greece adopted the euro in January 2001, trade data for Greece were included to compute the euroweights in the dollar indexes.Because Greece is a relatively small economy and much of its interna­tional trade occurs with other euro-area countries, its inclusion in the euro-area aggregate raised the eurocombined weight in the broad dollar index less than percentage point. Second, starting with the annual revision published in January 2002, agricultural exports are no longer subtracted from U.S. exports in the computations of the weights, either for the current period or for past periods. This change was moti­vated, in part, by the increasing level of processing incorporated in U.S. agricultural exports, which makes them less like pure commodities and more like differentiated products. This modication simplithe calculation of the bilateral export weights without changing them signicantly. Prompted in part by Swedens referendum in Sep­tember 2003, in which voters decided not to adopt the euro as their national currency, the staff made a third methodological change. It revised its practice regard­ing the treatment of intra-EU trade in the calcu­lation of the third-market competitiveness weights. Although trade among euro-area countries continues to be excluded from these calculations, starting with the annual revision of weights published in Decem­ber 2003, trade between the euro-area countries and both Sweden and the United Kingdom, as well as trade between Sweden and the United Kingdom, is now included for the current year and for past years. Because these three economies have important trade ties with each other and because they are also impor­tant trading partners of the United States, this meth­odological change resulted in some fairly substantial increases in the third-market competitiveness weights and hence also in the combined weights of the euro, the British pound, and the Swedish krona for the entire sample period. These methodological changes were announced on the Boards website when they were introduced. The staff will continue to announce these and other revi­sions, including changes in index weights caused by shifting patterns of international trade and changes in component currencies, as they are implemented. Because the drachma was not in the broad dollar index before 2001, the total number of currencies in that index remained unchanged at twenty-six. ��6 &#x/Att;¬he; [/;&#xTop ;&#x]/BB;&#xox [;‰ 7; 1; 7;G ];&#x/Typ; /P; gin; tio;&#xn 00;&#x/Att;¬he; [/;&#xTop ;&#x]/BB;&#xox [;‰ 7; 1; 7;G ];&#x/Typ; /P; gin; tio;&#xn 00;Federal Reserve Bulletin Winter 2005 these two groups of currencies. The two subindexes, termed the major currencies index and the OITP index, track the trade-weighted exchange value of the dollar against the corresponding subsets of curren­cies. The weights of the currencies in the two subin­dexes are derived by rescaling the currenciestive weights in the broad index so that they sum to 1 in each subindex. The share of the seven major currencies in the broad dollar index declined moder­ately between 1997 and 2003, from 58.4 percent to percent, largely because of the growing relative importance of China and Mexico in U.S. international trade and the diminishing relative importance of Because the major currencies generally trade in nancial markets, the major currencies index can be used to gauge nancial market pressures on the dollar. In this role, the major currencies index is the successor to the staffs previous main dollar index, the so-called G-10 index, which the staff no longer maintains. A comparison of the performance of these two indexes and an examination of the causes of their different volatilities over certain time periods are provided in the following section. Because most currencies are traded essentially con­tinuously, the values of the nominal broad, major currencies, and OITP indexes can be computed on a daily basis or, if desired, at even higher frequencies. The highest frequency feasible for the correspond­ing real indexes, however, is monthly because these indexes require consumer price index data that are available only on a monthly basis. ERFORMANCE OF THE , 1980The staffs dollar indexes have been successful in summarizing major long-term uctuations in the s exchange value, as the major uctuations in the real broad, major currencies, and OITP indexes over the past quarter-century correspond to identiable events (some lasting several years) in foreign exchange markets (gure 2). The period of dollar in the early and mid-1980s and the subsequent prolonged period of dollar depreciation are tracked by the rise and subsequent fall of the real major currencies and real broad dollar indexes. The dollars real appreciation against several Latin American currencies during the debt crisis of the early and mid-1980s is reected in the sustained increase in the real OITP index over that period. The sharp real appreciation of the dollar (and of other major currencies) against the currencies of several January 1980 = 100 OITP Major currencies Broad 1980 1984 1988 1992 1996 2000 2004 . Data are monthly. Asian emerging-market economies in the wake of the Asian crisis of 199798 is reected in the run-up of the real OITP index during that time.The period of broad-based dollar appreciation, which began in the late 1990s, and the recent period of sustained dollar depreciation, which began in early 2002 and has been especially pronounced against the major foreign currencies, are clearly visible in the uctuations in the real major currencies index. The relative stability of the OITP index over the past three years con­trasts markedly with the drop in the major currencies index and is due, at least in part, to the fact that the exchange values of several currencies with large weights in the OITP index are tied closely to the dollar. In December 2004, the real broad and real major currencies indexes were about 8 percent above and 4 percent below their respective levels in January 1980 and were about 4 percent below and 11 percent below their respective twenty-ve-year averages. The real broad and real major currencies indexes do not appear to show any identiable long-term trends. 18. of Asian and Latin American emerging-market economies make up the bulk of the OITP index. 19. staffs exchange rate indexes have the property (shared by most chain-weighted indexes) that if the weights change over time but eventually return to their initial values and if all exchange rates also return to their initial values, the indexes will generally return to their respective initial values. This potentially undesirable property can complicate the evaluation of longer-term changes in the indexes. To examine the empirical relevance of this potential difculty for evaluating the apparent lack of a signicant net change in the real broad and real major currencies indexes over the past twenty-years, the staff considered alternative index formulas, such as those of xed-weight indexes, which do not share this potential difculty (but which, in turn, may have other potentially undesirable properties, such as an inability to reect the changing patterns of trade ows). The staff found that the apparent lack of drift in the real broad and real major ��8 &#x/Att;¬he; [/;&#xTop ;&#x]/BB;&#xox [;‰ 7; 1; 7;G ];&#x/Typ; /P; gin; tio;&#xn 00;&#x/Att;¬he; [/;&#xTop ;&#x]/BB;&#xox [;‰ 7; 1; 7;G ];&#x/Typ; /P; gin; tio;&#xn 00;Federal Reserve Bulletin Winter 2005 whereas the currency weights of the G-10 index are Even though these two nominal indexes have evolved roughly similarly on balance over the past ve years, the G-10 index has witnessed tuations of a greater amplitude during certain sub-periods, especially from 1980 to 1988 and again from 1999 to the present. These two subperiods were char­acterized by greater volatility of the dollar against the European currencies than against several other currencies, especially the Canadian dollar. The large weight of the euro (and of its precursor currencies) in the G-10 index, together with the fact that the swings in the dollars exchange value against the euro were large over the two subperiods, explains most of the higher amplitude of the swings in the G-10 index. The staff views the major currencies index as a better indicator of the evolution of the competitiveness of U.S. products against those made in the other major-currency economies, especially over the period since the euro was introduced as a traded currency. EVISION OF URRENCY EIGHTS AND MPLEMENTATION OF Because the currency weights of the staffs dollar indexes are based on annual data on international trade, these weights will change as new trade data are received. For example, during most of 2003, index calculations for days or months in 2003 were based on annual trade data for 2001, the latest year for which such data were then available. In late 2003, after annual trade data for 2002 were published, the currency weights for 2003 were updated, and that revision led to an update of the indexes as well. After 2003 trade data became available late in 2004, the indexes for dates in 2003 were updated yet again. In addition, past international trade data are occasion­ally re-benchmarked and revised to incorporate new information on trade ows and to correct previous errors and omissions. Such changes may lead to further revisions of the trade-based currency imports) of the foreign economies in the index. Largely because the gures underlying these multilateral trade weights included trade among the six countries that eventually became part of the euro area, the weight of the euro in the G-10 index (obtained by summing the individual currency weights for Germany, France, Italy, the Netherlands, and Belgium/Luxembourg) is larger than its weight in the major currencies index. Such revisions are usually minor for years that precede the immediately previous year. Another source of occasional revisions stems from methodological changes. Three such changes have been implemented since the current set of dollar indexes was introduced in late 1998. First, after Greece adopted the euro in January 2001, trade data for Greece were included to compute the euroweights in the dollar indexes.Because Greece is a relatively small economy and much of its interna­tional trade occurs with other euro-area countries, its inclusion in the euro-area aggregate raised the eurocombined weight in the broad dollar index less than percentage point. Second, starting with the annual revision published in January 2002, agricultural exports are no longer subtracted from U.S. exports in the computations of the weights, either for the current period or for past periods. This change was moti­vated, in part, by the increasing level of processing incorporated in U.S. agricultural exports, which makes them less like pure commodities and more like differentiated products. This modication simplithe calculation of the bilateral export weights without changing them signicantly. Prompted in part by Swedens referendum in Sep­tember 2003, in which voters decided not to adopt the euro as their national currency, the staff made a third methodological change. It revised its practice regard­ing the treatment of intra-EU trade in the calcu­lation of the third-market competitiveness weights. Although trade among euro-area countries continues to be excluded from these calculations, starting with the annual revision of weights published in Decem­ber 2003, trade between the euro-area countries and both Sweden and the United Kingdom, as well as trade between Sweden and the United Kingdom, is now included for the current year and for past years. Because these three economies have important trade ties with each other and because they are also impor­tant trading partners of the United States, this meth­odological change resulted in some fairly substantial increases in the third-market competitiveness weights and hence also in the combined weights of the euro, the British pound, and the Swedish krona for the entire sample period. These methodological changes were announced on the Boards website when they were introduced. The staff will continue to announce these and other revi­sions, including changes in index weights caused by shifting patterns of international trade and changes in component currencies, as they are implemented. Because the drachma was not in the broad dollar index before 2001, the total number of currencies in that index remained unchanged at twenty-six. 3 Indexes of the Foreign Exchange Value of the Dollar than higher-frequency trade data to simplify the index calculations. Therefore, the weights are constant within a calendar year. Tradable goods produced in the United States com­pete with those from economy in two additional ways. First, economy may be a direct purchaser of U.S. products. This form of trade competition is measured by that economys U.S. bilateral export N(t) US, j,t = XUS, j,t XUS, j,t ,/ j =1 represents the merchandise exports from the United States to economy in year Second, U.S.-produced goods may also compete with goods produced in economy if the United States and economy both export goods to buyers in third-market economies. To measure this form of competition, the staff calculates third-market com­petitiveness weights. These weights are dened as N(t) US, j,t =  US,k,t áµk, j,t /(1  µk,US,t), k  j, k  US where µis the fraction of economy s merchan­dise imports from country in year and where The multiplicative factor 1/(1 ) ensures that the weights sum to 1. The U.S. third-market com­petitiveness weight of economy is a weighted aver­age of the third-market economiesU.S. bilateral export shares, where the weights are given by bilateral shares of those economies the U.S. third-market competitiveness weight of econ­is large if economy gures prominently in the imports of those economies for which the United States has large bilateral export weights. The overall, or combined, weights of the curren­cies in the dollar indexes are calculated as the follow­ 9. The computations of the bilateral export weights exclude U.S. of gold and military goods. For the rst few years after the current indexes were introduced, the computations also excluded U.S. agricultural exports, but the staff decided in 2002 to drop that exclu­sion. This methodological change is discussed in more detail later in this article. 10. In principle, the bilateral import weights µexclude oil imports (and, ideally, other primary commodities) to ensure symmetric treatment with the U.S. bilateral import weights. However, data limitations make this adjustment infeasible for several countries that are major U.S. trading partners. Therefore, the bilateral import weights used by the staff in its calculations of U.S. third-market competitiveness weights include oil imports. 11. The U.S. third-market competitiveness weight of economy can also be interpreted as a weighted average of s bilateral shares of the third-market economiesimports, where the weights are given by those economiesU.S. bilateral export shares. ing linear combination of the three submeasures of the degree of trade competition: 1 1 1 wj,t = 2µUS, j,t +2 US, j,t +2US, j,t ).2 The coefcients of the three submeasures were chosen to give equal importance to competition from imports in U.S. markets and to competition from U.S. exports in foreign markets.In addition, equal importance is given to the bilateral export weights and to the weights that summarize competition in third markets.ELECTION OF URRENCIES The staff selected currencies for inclusion in three indexes: the broad index, the major currencies index, and the other important trading partners (OITP) index. The following sections describe these indexes and the associated processes of currency selection. The Broad Index The currencies chosen for inclusion in the broad dollar index in 1998 were determined pragmatically as those of economies whose bilateral shares of U.S. imports or exports exceeded 1 percent in 1997, the latest year for which complete annual trade data were then available. On the basis of this criterion, the staff selected twenty-six currencies. Anticipating the adop­tion of the euro at the end of 1998 by eleven mem­ber countries of the European Union (EU), the staff designed the index so that a single weight for the euro could capture the inuence of the dollarexchange rate on trade competition between the United States and the euro area. 12. This choice is somewhat arbitrary. Changing the relative impor­of the three submeasures of the degree of trade competition obviously affects the overall currency weights and hence may affect the exchange rate indexes. Although varying the relative importance of the three submeasures would have affected the trajectories of the dollar indexes somewhat during the 1970s and the early 1980s, such variations mattered fairly little from about 1985 on, at least when some appreciable weight is given to each of the three submeasures. The staff therefore chose to maintain its current set of weights on the three submeasures. 13. Empirical work done in 1998 with the staffs trade model showed that an equal weighting of the two measures of export competitiveness performed well in explaining U.S. core exports, and this performance provided a rationale for giving equal importance to these two measures. Core exports are merchandise exports other than agricultural goods, computers, and semiconductors. 14. The shares of the eleven initial euro-area countries in U.S. imports and exports were summed to obtain the bilateral import and export weights of the aggregate euro-area economy for the years