/
Institutional factors associated with cesarean section rate Institutional factors associated with cesarean section rate

Institutional factors associated with cesarean section rate - PowerPoint Presentation

liane-varnes
liane-varnes . @liane-varnes
Follow
395 views
Uploaded On 2017-05-06

Institutional factors associated with cesarean section rate - PPT Presentation

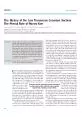
Author ConzueloRodriguez G 1 Advisor Lisa M Bodnar 1 Internship Preceptor OrtízPanzo E 2 CruzHernández A 2 1 University of Pittsburgh Graduate School of Public Health Pittsburgh PA EU ID: 545378

gestation presentation obstetric institutional presentation gestation institutional obstetric labor fci weeks robson status hospitals rates multiple health age capacity

Share:

Link:

Embed:

Download Presentation from below link

Download Presentation The PPT/PDF document "Institutional factors associated with ce..." is the property of its rightful owner. Permission is granted to download and print the materials on this web site for personal, non-commercial use only, and to display it on your personal computer provided you do not modify the materials and that you retain all copyright notices contained in the materials. By downloading content from our website, you accept the terms of this agreement.


Presentation Transcript

Slide1

Institutional factors associated with cesarean section rates in hospitals of Mexico.

Author: Conzuelo-Rodriguez G.1Advisor: Lisa M. Bodnar1Internship Preceptor: Ortíz-Panzo E.2, Cruz-Hernández A.2

1. University of Pittsburgh Graduate School of Public Health, Pittsburgh, PA, EU.

2. National Institute of Public Health, Cuernavaca,

Mor

, Mexico.Slide2

Why this matters?

Cesarean section (CS) rates are increasing.Developing nations contribute the most to this rise.The elective procedures are most prevalent.

Risks overpass the benefits when done indiscriminately.Slide3

What is the problem?

Election of CS must rely upon specific medical indications exclusively.Patient, provider and institutional factors have been associated with a greater risk for CS. The role of institutional factors on CS

have not been widely explored. Slide4

Objective.

The aim of this study is to evaluate the association between obstetric institutional capacity and CS rate in a Mexican setting. Slide5

WHO Multi-country survey on maternal and newborn health

Wave 2010-2012

29 Countries

359 Facilities

> 300,000 Obstetric events

Data from Mexico

2 States

14 Facilities

13,060 Obstetric events

Data

Robson classificationSlide6

Robson classification

Categorize obstetric population into 10 mutually exclusive groups according to:Parity and previous CS.Gestational age.Onset of labor.

Fetal presentation.

Number of fetuses.

Permit

analysis on CS low risk groups

(R1 and R3)Slide7

Institutional capacity.

Facility Capacity Index (FCI).Measures 6 categories, range: 12-57 points.Standard of building/ basic services.Medical services.

Emergency obstetric services.

Laboratory tests services.

Hospital practices.

Human resources

.Slide8

Statistical analysis.

Multi-level logistic regression.FCI Score

CS rates

Secondary predictors:

- Ownership

- Teaching facility

- Maternity exclusiveSlide9

Table 1. Maternal sociodemographic characteristics.

Characteristic

Overall

(n=12,720)

Rob

son

1

a

(n=3,286)

Robson 2

b

(n=3,281)

Age n(%)

< 20 years

2,824 (24.6)

1,547 (50.2)

386 (11.4)

20-34

years

7,403 (64.4)

1,463 (47.5)

2,549 (75.6)

>

34 years

1,261 (11.0)

73 (2.3)

438 (13.0)

Education n(%)

<

6 years2,442 (21.2)495 (16.1)1,073 (31.9) 7-9 years4,591 (40.0)1,265 (41.0)1,379 (40.9) > 10 years4,149 (36.1)1,246 (40.4)829 (24.6) Missing306 (2.7)77 (2.5)92 (2.7)Nulliparous n(%)4,869 (42.4)3,083 (100)--Previous CS n(%)2,160 (18.8)----Marital status n(%) Single1,740 (15.2)711 (23.1)281 (8.3) Married or cohabitating9,748 (84.8)2,372 (76.9)3,092 (91.7)

a

Nulliparous, singleton, cephalic presentation, ≥ 37 weeks of gestation, spontaneous labor.

b

Multiparous, no prior CS, singleton, cephalic presentation, ≥ 37 weeks of gestation, spontaneous labor.Slide10

Table 2. Association

between FCI score and CS rates

a

Crude

Model 1

b

Model 2

c

Predictors

OR [95% CI]

FCI

Score

0.93 (0.87-0.98)

0.94 (0.88-0.99)

0.93 (0.75-1.15)

Private

o

wnership

3.86 (1.17-12.74)

3.20 (1.08-9.44)

1.49 (0.23-9.52)

Teaching status

0.39 (0.14-1.12)

0.48 (0.18-1.21)

0.36 (0.11-1.16)

Maternity

exclusive

0.62 (0.20-1.92)

0.63 (0.23-1.70)

0.54

(0.24-1.20)a Based on overall obstetric events (n= 12,720).b Adjusted for age, education, marital status, fetus presentation, weeks of gestation, multiple pregnancy, chronic hypertension, preeclampsia, multiple organ dysfunction and other serious conditions (placenta previa, abruptio placentae, HIV and renal disease).c Additionally adjusted for other institutional characteristics (number of beds, proportion of women receiving free of charge treatment, hospital going under audits, hospital adherence to local and/or WHO guidelines, obstetrician availability).Slide11

Table 2. Association

between FCI score and CS rates among low risk groups defined as either Robson 1

a

or Robson 3

b

.

Overall

c

(n= 12,720)

Low risk group

c

(n= 6,567)

Predictors

OR [95% CI]

FCI

Score

0.94 (0.88-0.99)

0.96 (0.89-1.04)

Private

o

wnership

3.20 (1.08-9.44)

1.74 (0.46-6.52)

Teaching status

0.48 (0.18-1.21)

0-72 (0-24-2.16)

Maternity

exclusive

0.63 (0.23-1.70)

0.57 (0.19-1.64)

a Nulliparous, singleton, cephalic presentation, ≥ 37 weeks of gestation, spontaneous labor.b Multiparous, no prior CS, singleton, cephalic presentation, ≥ 37 weeks of gestation, spontaneous labor.c Adjusted for age, education, marital status, fetus presentation, weeks of gestation, multiple pregnancy, chronic hypertension, preeclampsia, multiple organ dysfunction and other serious conditions (placenta previa, abruptio placentae, HIV and renal disease).Slide12
Slide13

Results.

CS is more frequently performed among low capacity hospitals in Mexico.Private hospitals in our sample.In those less prepared hospitals, the majority of CS showed no evidence of labor.Slide14

Discussion.

Data from National Survey of Health and Nutrition, Mexico (ENSANUT 2012) reported higher proportion of CS in private hospitals.Revenue for physicians and facilities.Women’s belief that CS is better and safer for their children.Slide15

A final note.

Current regulations must be enforced in order to limit CS to necessary cases only.Final decision must always be individualized according to fetal and maternal characteristics.