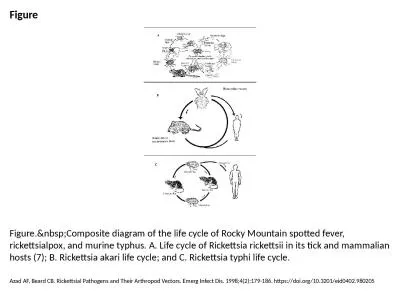
/
Life Cycle Assessment of Lawnmowers Life Cycle Assessment of Lawnmowers

Life Cycle Assessment of Lawnmowers - PDF document

liane-varnes
liane-varnes . @liane-varnes
Follow
475 views
Uploaded On 2016-06-20

Life Cycle Assessment of Lawnmowers - PPT Presentation

Two M owers x2019 Case Studies Master x2019s Thesis in Environmental Measurement s and Assessment s XING LAN Y U LIU Department of Energy and Environment Divisi on of Environmental System ID: 370046

- Two M owers ’ Case Studies Master ’s Thesis Environmental Measurement s and

Share:

Link:

Embed:

Download Presentation from below link

Download Pdf The PPT/PDF document "Life Cycle Assessment of Lawnmowers" is the property of its rightful owner. Permission is granted to download and print the materials on this web site for personal, non-commercial use only, and to display it on your personal computer provided you do not modify the materials and that you retain all copyright notices contained in the materials. By downloading content from our website, you accept the terms of this agreement.


Presentation Transcript

Life Cycle Assessment of Lawnmowers - Two M owers ’ Case Studies Master ’s Thesis in Environmental Measurement s and Assessment s XING LAN Y U LIU Department of Energy and Environment Divisi on of Environmental System Analysis CHALMERS UNIVERSITY OF TECHNOLOGY Göteborg, Sweden 2010 Report No. 2010:11 MASTER’S THESHS ( 2010:11 ) Life Cycle Assessment of Lawnmowers MMster’s Thesis in the Master Programme of Environmental Measurement s and Assessment s XING LAN YU LIU Department of En ergy and Environment Division of Environmental System Analysis CHALMERS UNIVERSITY OF TECHNOLOGY Göteborg, Sweden 2010 Life Cycle Assessment of Lawnmowers - Two Mowers ’ Case Studies MMster’s Thesis in the Environment al Measurement s and Assessment s XING LAN YU LIU © XING LAN & YU LIU , 2010 ISSN 1404 - 8167 MMster’s Thesis 2010:11 Department of Energy and Environment Division of Environmental System Analysis Chalmers University of Technology SE - 412 96 Göteborg Sweden Telephone: + 46 (0)31 - 772 1000 i P reface This Master t hesis has been conducted in collaboration with Husqvarna AB and Center for environmental assessment and material systems ( CPM ) in Gothenburg, Sweden . D uring t he period between September 200 9 and April 20 10 , the project was performed in the division of Environmental Systems Analysis (ESA) at Ch almers University of Technology, with a pause during 2009 ’ s Christmas . The work has been su pervised and gui ded by Emma Rex in CPM and Professor Anne - Marie Tillman in ESA has been responsible for the examination process. We would like to take this opportunity to show our deepest appreciation for the help they have given us throughout this project. Although the processes were not so easy, we did enjoy the meeting s and discussion s with Emma, and nice weather as well. The parti cipating personnel in Husqvarna AB and Husqvarna UK should be also acknowled ged. Without their help , data collection would not be possible. Besides, people in ESA gave us really valuable suggestions and sometimes they were really inspiring. We would say tha nks to all, including the coffe r machine. Last but certainly no t l east, we both would like to thank each other, our loving family and friends for their support. Göteborg, May 20 10 Xing Lan Yu Liu ii iii Life Cycle Assessment of Lawnmowers - Two Mowers ’ Case Studies MMster’s Thesis in the Environment al Measurement s and Assessment s XING LAN YU LIU Department of Energy and Environment Division of Environmental System Analysis Chalmers University of T echnology Abstract Husqvarna AB, as a leading outdoor power company, has chosen two typical lawnmowers to analyse their environmental impacts from lawnmower branch. These two, one is the traditional walk - behind lawnmower LC48VE and the other one is named A utomower 220AC. The distinct characteristic between these two is that the former one is petrol - driven while the l atter is electricity - driven. Besides, the traditional one needs people ’ s control while the o ther can be programmed and work without external manpower. Due to the highly different working pattern s and market consideration, the results for two cases will not b e compared . The main reason for putting them together is for further product development and internal life cycle thinking a uxiliary . Life cycle assessment was used to evalua te the environmental impacts of these two chosen products from producti on, use an d maintenance and end - of - life phases. Data collection was the most time consuming part of the whole procedures and database in SimaPro were widely used but some processing data were still missing. The result shows that p roduction phase which is also cove ring raw material extraction and use phase together contribute dominant environme ntal impacts. The characterisation and w eighting methods as EPS2000 and Eco - indicator 99 were applied and show n difference in final result s because of the different emphasi s of each m e thod. Sensitivity analysis showed that i ncreasing the share of recycled metals could make better environmental performances of both mowers while electricity productions in different countries have obvious impacts on A utomower ’ s impacts. In term s of product development, t he most common way of using life cycle perspectives is through l ife c ycle t hinking (LCT) in design chain, in this case , which could mean increase of the ratio of recycled material s and improvement of products’ durability . iv v T able of Contents MASTER’S THESIS IN E NVIRONMENTAL MEASURE MENTS AND ASSESSMENT S ................................ .... I 1. INTRODUCTION ................................ ................................ ................................ ......................... 1 1.1 B ACKGROUND ................................ ................................ ................................ ............................. 1 1.2 LCA IN GENERAL ................................ ................................ ................................ .......................... 1 2. GOAL AND SCOPE DEFIN ITION ................................ ................................ ................................ ... 3 2.1 G OAL ................................ ................................ ................................ ................................ ......... 3 2.2 S COPE ................................ ................................ ................................ ................................ ........ 3 2.2.1 Options ................................ ................................ ................................ ................................ 3 2.2.2 Initial flowchart ................................ ................................ ................................ ................... 4 2.2.3 Functional unit ................................ ................................ ................................ .................... 4 2.2.4 Impact assessment ................................ ................................ ................................ ............. 4 2.2.5 System boundaries ................................ ................................ ................................ .............. 5 3. CASE OF LAWNMOWER LC 48VE ................................ ................................ ................................ . 7 3.1 I NVENTORY ANALYSIS ................................ ................................ ................................ .................... 7 3.1.1 Flowchart ................................ ................................ ................................ ............................ 7 3.1.2 General data ................................ ................................ ................................ ....................... 7 3.1.3 Producti on ................................ ................................ ................................ ......................... 12 3.1.4 Transport ................................ ................................ ................................ ........................... 19 3.1.5 Use and maintenance ................................ ................................ ................................ ....... 19 3.1.6 End - of - life ................................ ................................ ................................ ......................... 21 3.2 I MPACT ASSESSMENT ................................ ................................ ................................ .................. 22 3.2.1 Characterisation ................................ ................................ ................................ ............... 22 3.2.2 Weig hting ................................ ................................ ................................ ......................... 23 3.3 S ENSITIVITY ANALYSIS ................................ ................................ ................................ .................. 26 3.4 D ISCUSSION ................................ ................................ ................................ .............................. 27 3.5 C ONCLUSION ................................ ................................ ................................ ............................. 27 4. CASE OF AUTOMOWER 22 0AC ................................ ................................ ................................ . 29 4.1 I NVENTORY ANALYSIS ................................ ................................ ................................ .................. 29 4.1.1 Flow chart ................................ ................................ ................................ .......................... 29 4.1.2 General data ................................ ................................ ................................ ..................... 30 4.1.3 Production ................................ ................................ ................................ ......................... 31 4.1.4 Transport ................................ ................................ ................................ ........................... 37 4.1.5 Use ................................ ................................ ................................ ................................ .... 37 4.1.6 End - of - life ................................ ................................ ................................ ......................... 37 4.2 I MPACT ASS ESSMENT ................................ ................................ ................................ .................. 38 4.2.1 Characterisation ................................ ................................ ................................ ............... 38 4.2.2 Weighting ................................ ................................ ................................ ......................... 40 4.3 S ENSITIVITY ANALYSIS ................................ ................................ ................................ .................. 41 4.4 D ISCUSSION ................................ ................................ ................................ .............................. 44 vi 4.5 C ONCLUSION ................................ ................................ ................................ ............................. 45 5. DISCUSSION ................................ ................................ ................................ ............................. 46 6. LCA APPLICATION ................................ ................................ ................................ ..................... 48 6.1 M ETHODOLOGY APPLICATI ON ................................ ................................ ................................ ....... 48 6.2 D ATA COLLECTION STRAT EGY ................................ ................................ ................................ ......... 49 6.3 R ECOMMENDATION ................................ ................................ ................................ .................... 50 7. CONCLUSIONS ................................ ................................ ................................ ......................... 51 REFERENCE ................................ ................................ ................................ ................................ ....... 52 1 1. Introduction 1.1 Background Husqvarna AB is the world ’ s largest outdoor power products production company, the major products including lawn mowers, chainsaws, garden tractors, trimmers and blowers. It is one of the leaders in construction and stone industries in the world. It is also the leader of consumer E uropean irrigation equipment s . The products are distributed and sold in more than 100 countri es (Husqvarna AB, 2009) . Husqvarna is actively engaged in being part of the environmental solutions by its products and processes’ d evelopment. S ince environmental awareness is increasingly important in the manufacturing industry and also for consumers. The company has expressed their environmental concerns in several aspects. For example, they have already issued Eco - Smart TM technology on several products which were assessed as aspects of materials, fuel consumption, fuel type, lubricant, emissions, vibrations, packaging, recyclability and noise and Eco - Smart approach has been applied on current 10 products by far. For example X - TORQ is one of these solutions which have less fuel consumption and low emissions . As the commitment of its environmental responsibility, the company considers starting up systematic LCA work in the organization. Experimental assessment had been made on chainsaws ten years ago . Besides the company also wants to keep on its leader position, since the industrial competitions are making efforts on the improvement of environmental performance of products and the legislation. Marketing also needs the focus about the environmental performance of products and could be supported by the LCA . 1.2 LCA in general Life cycle assessment, the abbreviation of which is LCA, is defined as the “compilMtion and evaluation of inputs, outputs and potential environmental impacts of a product system throughout its life cycle ” in ISO14040. T he life cycle includes the extraction of resources, processing of materials and product parts, manufacturing of products, use of products and the waste management with all the transports involved in the system, therefore, well known as “ cradle to grave ” (Baumann & Tillman, 2004) . In Figure 1 the boxes illustrate the procedural steps and the black arrows shows the order while the white for the possible iterations . The first step is to identify the objective and determine the work plan of LCA study. After flowchart designing, data collection, multifunctional processes allocation and final calculation, the main result is an inventory about the “ quantified inputs and outputs in terms of per functional unit ” . And the life cycle impact assessment (LCIA) refers to 2 define a list of impact categories and select “ models for relating the environmental interventions to suitable category indicators for these impact categories ” . Then the modeling results are calculated in the characterisation st ep which is a compulsory step in ISO14040 while the following s including weighting are optional processing way s for inventory, and “ there is no best available method ” . (Guinée, 2002) . I n this case weighting is used to get a dimensional index to give a direct view of the product ’ s environmental performance while the aggregation will sacrifice the details and competence of environmental information . Finally, in interpretation phase all the choices, assumptions and analytical re sults will be evaluated “ in terms of soundness and robustness ” and then drawn the “ overall conclusion ” , while the interactions between each steps make the LCA procedures as a whole. Figure 1 The LCA procedures (Baumann & Tillman, 2004) . Figure 2 gives illustration on how to aggregate inventory input (resource s , energy, etc . ) and output (emissions, etc . ) dat a into defined impact categories and further to one single index. Figure 2 The life cycle impact assessment illustration (Baumann & Tillman, 2004) . For companies, t he fundamental characteristic of LCA as analytical tool is to provide information for decision making, to identify the improvement possibilities , and to communicate for market ing reasons . Goal and scope definition Inventory analysis Impact assessment Charactersation Weighting Interpretation Inventory Charactersation Weighting CO 2 Global warming weighting index CH 4 NO X Acidification SO 2 HCl … … 3 2. Goal and scope definition 2.1 Goal The goal of th is LCA study was to evaluate the environmental performances of two chosen products : l awn mower s running on petrol and a utomowers using electricity power, and to g i ve recommendations for making LCA studies in Husqvarna, including discuss i on about its applicability in the company. Two tasks have be en done in th is report:  I nvestigat ion of the environmental impacts of these two products;  S uggest ions of improvement in internal LCA implementation and application . The main intended audience s of the report are personnel in Husqvarna including the product designer s and the decision makers . In the long run, LCA stud ies can also be used for c ommunication with consumers and r esearch and d evelopment (R&D) phase to improve environmental performance of products. Since th is company is at the beginner level on LCA study, its environmental manager firstly wants to have a report about the environmental impacts of products and bring more focus on environmental management at company level as well as consideration at pro duct development phase. Therefore, it ’ s not comparison work which is called as “ change - oriented LCA ” but an accounting task based on the purpose of the commissioner . 2.2 Scope 2.2.1 Options T wo products have been selected according to the consideration of Husqvarna . A nd pictures of th e se two products are shown in Figure 3 .  Lawnmower LC 48VE with petrol engine which is assembled in Höör, Sweden  Automower 220 AC which is assembled in Newton Aycliffe , UK . Figure 3 Pictures of lawnmower LC48VE and Automower 220 AC. 4 2.2.2 Initial flowchart Figure 4 Rough flow chart of the products. 2.2.3 Function al unit The functional unit is used to link the input and output during the quan tum of the products ’ environ mental performance. In this case, mow ing 1000 m 2 lawn ( Swedish lawn in sout h of Sweden ) for 10 years wa s defined as functional unit . The important concerns are energy usage and environmental impact. And in the following context, the f.u. is the abbreviation for functional unit. 2.2.4 Impact assessment Characterisation Impact categories were used in the characterisation phase and the data from the inventory are aggregated into a number of impact categories. To quantify the environmental impact in each c ategory, equivalency factor which has been defined after cause - effect chain modeling is used. (Baumann & Tillman, 2004) . For example, as many emissions could contribute to acidification and the acidification potential (AP) of 1 kg SO 2 can be set as baseline, while 5 others like 1kg NO X and 1kg HCl has the same AP as 0.7kg and 0.88kg SO 2 , respectively. Thus, the result of acid ification category should be the sum of the quantity of SO 2 equivalents, SO 2 inclusive. In later characteri s ation sections, the abbreviat ed unit - “ kg eqv/f.u ” means kg specific equivalent per functional unit in each category. In ISO standard, the equivalency factors were named as category indicators and i n this case the impact categories are selected according to the SETAC - WTA2 list (SETAC - Europe, 1996) :  Depletion of abiotic resources  Global warming  Ozone depletion p otential  Human toxicity  Ecotoxicity  Photochemical ozone creation potential (POCP)  Acidification  Eutrophication In this case, the data for land use category are not collected directly but from the background data in the database. Microsofte Office EXCEL has be en used as the data store and basis for calculations . Foreground data have be en collected from Husqvarna , suppliers and waste management company , while the background dataset available are from professional software, LCA database, and previous LCA st udies . Weighting CML, Eco - indicator 99, EDIP and EPS2000 are some of the most popular LCIA methods today. In this case, EPS2000 and Eco - indicator 99 were chosen for the weighting. EPS2000 , developed by CPM (center for environmental assessment of pr oduct and material system ) was chosen because the EPS system is Mimed to Ne M tool for M compMny’ s internal product development process. It may be used externally and for other purposes, like for environmental declarations, for purchasing decisions, for ed ucation or for environmental accounting, but in those cases, the knowledge of the EPS system and its features and limitations is crucial (CPM, 2010) . EPS is based on wil lingness - to - pay to avoid environmental damages (Baumann & Tillman, 2004) Mnd impMct is expressed in M monetMry vMlue cMlled “EIU” (Environmental load unit s ) . Eco - indictor 99 is also a widely used method and the purpose of using two methods is to let the company to see the different result with different analysis ways . Eco - indicator 99 is based on distance - to - target principle . 2.2.5 System boundar ies T he whole life cycle of lawnmowers, namely from raw material extraction to waste 6 management , was covered . The LCA studies include d accounting environmental performances , “ hot - spot ” analysis, and sensitivity analyses . Transports from the central warehouses to retailers , from retailer s to consumers and from consumers to waste treatment plant s were not included. The recycling data have be en discussed in the study . Environmental impacts from the capital goods manufacturing , such as machines used in the manufacturing of the vehicles, were not considered, nor were impacts from activities of employees. Geographical and time boundary The Automower 220 AC is assembled in Newton Aycliffe , UK while Lawnmower LC 48VE is in Höör, Sweden. However, most parts of the product are purchased globally and the products Rould Ne retMiled Ny HusqvMrnM’s RholesMle netRork. Therefore the geogrMphicMl Noun dary was defined as global. But the use site point is set to be in south Sweden. And for transport , the NTM data have be en selected to evaluate the environmental impacts (NTM, 2009) . According to the company , regarding the use phase of the product, the life span of A utomower 220 AC is 10 years (Gustvasson, 2009) and for LC 48 VE is 250 hours (Edman, 2009). Since the site is south Sweden where the grass growth period is from May to September, 5 months per year and working time per month is 5 hours, the life span of LC 48 VE in this case is also 10 year. Therefore the time boundary is 10 years covering the use phase. Data collection and quality Data collection is one of the most time consuming ac tivities in LCA (Baumann & Tillman, 2004) . There is no one universal principle for it yet. Howeve r, some planning suggestions were followed: For most of raw materials production phase, general data were used . For process ing phase, data were as far as possible obtained from Husqvarna and first tier suppliers by personal communication and internal documents, some general data were used as well. Regarding end - of - life treatment, data were collected from Renova AB (Renova AB, 2010) . R esult interpretation S ensitivity analysis aims to find the theoretical sensitivity for indicators which could identify the specific potential of improvement. In d ominance analysis phase, “ hot - spot ” w ill be found to investigate what parts of the life cycle take the dominant environmental impact s . Normalization and weighting both are optional in LCA; however in this case weighting wa s chosen because the final single index will help the decision maker to have a co mplementary view of the environmental performance of products as integrat ed “result”. 7 3. Case of lawnmower LC48VE 3.1 Inventory analysis The life cycle of the lawnmower LC48VE was divided into these phase s :  Production: comp onents production and assembly in Höör  Transport involved in purchase and wholesale  Use and maintenance  End - of - life (EOL) Detail descriptions for these phases are in the following Flowchart part. 3.1.1 Flowchart Figure 5 shows the simplified flowchart of lawnmower LC48VE. The production phase in clude s the processes that happened before all the components and materials arriving at Höör, as well as the steel components manufacturing processes i n Höör. R aw material extraction, t ransport and other processing procedures were included. The production process would be divided into severMl modules Mccording to HusqvMrnM’s internMl AlphM modulMr system Mnd each module includes several components. The g rey box represents processes occurring in Höör, where the main steel components were produced and assembly happened, and the powdering process was included in the assembly part. Transport phase covers the processes in both components purchase and products wholesale, but excluded t ransports happened in retail processes. Besides, the transport happened in raw material extraction, purchased by suppliers can be only approached in data base, which were defined as background transport and were accounted to each module’s environmentMl impMcts in this case. And the process in dotted box indicate s the processe which has been omitted. Use and maintenance statics data were from Husqvarna, while end - of - life data were base on telephone interview with Kurtl Lindman in Renova, a Swedish waste treatment company and assumptions . 3.1.2 General data Raw material For LC48VE, Husqvarna purchased many components while only manufactured main steel parts and assembled both in Höör. The data collection processes mainly focused on the d irect supplied components ’ rMR mMteriMl o rigins, processing impacts and t ransport from suppliers to Husqvarna and from Husqvarna to different central warehouse . In this case, average data, not the site - specific of raw material production were adopted. Thus t he technological differences existed in different sites were omitted due to the data completeness limitation. 8 Figure 5 Flowchart of lawnmower LC48V (processes in dotted boxes excluded) Raw material production processes in this case were divided into 2 categories; one is labeled Rith loRer cMse letter “r” Ms r1 Mnd the other Rith cMpitMlized letter “ R ” as R1, R2 and so on. Take steel alloy production R1 for example: Steel alloy: Husqvarn a bought different kinds of steel alloy components or as raw material, and most are steel alloy sheet. The steel alloy A517b with zinc electroplated in SimaPro 7.1 database was selects as reprehensive for all kinds of steel alloy being used since the domin ant steel alloys from SSAB are with the most similar chemical compositions, seen in Table 1 and Table 2 , while steel wire and stainless steel were exceptions and would be discusses later separately. Table 1 Chemical composition s of steel sheet Dogal Form 36 . Steel grade C max Si Max Mn max P max S ma x Cr max Alto t ma x Dogal Form 36 (%) 0.004 0.030 0.20 0.020 0.015 0.050 0.020 (SSAB,Swedish Steel, 2008) Raw material production Raw material production Raw material production Raw material production Raw material production Raw material production Raw material production Raw material production Transport Transport Transport Transport Transport Transport Transport Transport Steel production Chassis module components Handle module components Power module components Axle & suspension components Branding components Fasteners manufacturin g Packaging components Transport Transport Transport Transport Transport Transport Transport Transport Transport Transport Raw material production Wholesale Raw material production Transport Transport Transport Petrol and lubricant production Retail Extra Blades manufacturin g Transport Transport Transport Use Transport Landfill Incineration Recycling Assembly Components manufacturing Production End of Life Transport Use Production (in Höör) 9 Table 2 Chemical composition s of s teel shee t A517b . Material content in 1kg A517b Steel 0.9797 kg Manganese 0.01 kg Silicon 0.003 kg Molybdenum 0.002 kg Chromium 0.005 kg Vanadium 0.0003 kg Titanium 0.0001 kg Table 2 i s from SimaPro database, but only the compositions of steel A517b were given based on average statics data from all suppliers in Western Europe for 1995 - 1999 with transport data not included . This simplified list could not be used directly in inventory. Thus, in this case, the way adopted was to trace back each kind of material or substance to find detailed input and output of each material and substance. The impact of A517b was assumed the s um of the environmental impacts to produce these materials and substances. D ata were still Western Europe average da ta between 1995 and 1999 cover ing ore extraction, processing and transport processes. The flowchart of steel alloy production R1 was assum ed as Figure 6 according to its co mpositions and processing step , electroplating labeled with zinc electroplating ( P3 ) . The loRer cMse letter “r” proc esses generMlly include eMch mMteriMl or suNstMnces’ extrMction, processing and what was called background transport as before. Figure 6 Flowchart of R1 steel alloy production. Steel wire: Beside steel alloy sheet, steel wire components were also used in LC48VE and the data from Gabi 4 Education were used as world average . For steel wire production R2, steel billet production were the major material need to trace back and the processing included ore extraction, transport, heati ng and rolling and drawing. r1 r5 r6 r7 r8 r9 r10 r11 p3 Electroplating R1 Steel alloy Steel production Mn production Si production Mo production Cr production V production Ti production Zn production Transport 10 Figure 7 Flowchart of R2 steel wire production . Stainless steel: The same method was used for stainless steel production R16 as steel alloy R1, while with different chemical compositions approached from SimaPro database . Transport and processing data were omitted due to lack of data. Figure 8 Flowchart of R16 stainless steel production . Aluminum alloy: The material analysis report for lawnmowers in Husqvarna (Husqvarna, 2009) shows that there exist two kinds of Al alloy, ADC12 and EN46000. ADC12 is the material n o. from Japanese Industrial Standards (JIS) system and as equivalent of EN AC - 46100 in European Standard system. Its EN denomination is G - AlSi 12 Cu (Misumi Europe) , while EN46000 is G - AlSi 9 Cu 3 (Fe) (Ericsson) . The chosen average LCA data for these two different alloys were G - Al 12 Cu and G - Al 8 Cu 3 from SimaPro database , respectively, while data in Table 3 and Table 4 are b ased on average data from all suppliers in Western Europe for 1990 - 1994, and transport data are not included. Meanwhile , the material and substances traced back data covered ore extraction, processing and transport processes. Ore extraction Transportation Heating and rolling Drawing r2 R2 Steel wire Steel billet production Transport Processing r1 r4 r5 r6 r14 r15 R16 Stainless steel Steel production Stainless steel scrap production Transport Processing Mn productio Ni production Si production Ferrochromium production 11 Table 3 Chemical composi tion s of Al ADC12 . Material content in 1 kg Al ADC12 Aluminum ingots 0.706 kg Aluminum rec ycled 0.15 kg Silicon 0.12 kg Copper 0.01 kg Steel 0.008 kg Manganese 0.003 kg Magnesium 0.003 kg Table 4 Chemical composition s of Al EN46000 . Material content in 1 kg Al ADC12 Aluminum ingots 0.7 14 kg Aluminum rec ycled 0.15 kg Silicon 0. 08 kg Copper 0.0 3 kg Zinc 0.012 kg Steel 0.0 08 kg Manganese 0.00 4 kg Magnesium 0.00 2 kg Figure 9 Flowchart of R3 - Al ADC12 production. r3 r4 r5 r6 r12 r13 r1 R3 Al ADC12 production Mn production Si production Cu production Al ingots production Recycled Al production Steel production Transport Processing Mg production 12 Figure 10 Flowchart of R4 - Al EN46000 production. P lastic : R5 - P olypropylene ( PP ) granulate, R6 - Acrylonitrile butadiene styrene ( ABS ) granulate R7 - Polyvinyl chloride ( PVC ) granulate R8 - Polyamide 6 (PA6) granulate and R9 - PA6 30GF . All of these data were obtained from SimaPro 7.1, and i nventory data of R4 - R9 production are based on average Western Europe data for 1995 to 1999, transport data are not included. Others: R10 - R ubber , R11 - Zinc , R12 - Copper , R13 - Crude iron steel , R1 - sulfuric acid and R15 - Lead . Electricity production Electricity production in different countries and regions are based on different ene rgy sources . I n this study electricity consu mption was considered in Sweden . Swedish sources is considered as nuclear (46.5%), oil (2.06%) and hydro electricity (51.44%) (Baumann & Tillman, 2004) 3.1.3 Production Chassis module The la wnmower chassis module consist s of several materials, mainly steel and plastic while the detailed weights of each component were listed in Table 5 , and Figure 11 shows the specific flowchart for chassis module. The processes in the grey box, in terms of what happened in H ö ör, were included in assembly part and the same for all the following modules. Table 5 Material composition s of chassis module per functional unit. Materials Weight(kg) Steel alloy 13.182 Steel wire 0.628 Aluminum 0.291 Plastic - PP 4.17 Plastic - ABS 0.545 Plastic - PVC 0.159 r3 r4 r5 r6 r11 r12 r13 r1 R4 Al EN46000 production Al ingots production Recycled Al production Steel production Transport Processing Mn productio Si production Zn production Cu production Mg production 13 Chassis, the main part of this module was made from steel EN 10327 or DX54D Z100 (Dogal Form 36 with zinc coating thickness 7um at per side) an d manufactured in Höör . I n sheet production phase, 1% loss was assumed mainly due to cold forming and electroplating zinc process es . For the rest steel wire components: grass bag frame, axle rear discharge and spring, w hile processes include iron mining, steel billets making and heating and rolling for wires, 5% loss was assumed for the components processing. P lasti c components PP, PVC and ABS were made from each specific granulate with injection mould processes P1which was assumed to be the same for all the plastic components . While the losses of granulate production were excluded , the loss during the injection processes were assumed as 3% . This loss rate was based on the interview w ith (Foster, 2010) in Husqvarn a UK, which produced most of the plastic components for their products . Then for Aluminum components , from Huqavarn a internal material report (Husqvarna, 2009) , the Al used in chassis module is EN46000. The major process P2 b eing considered in this case is alloy forging. 1% loss was assumed as happened in forging process and the alloy production loss was not taken into consideration . And the loss ratio settings were the same for all the modules as followed in production phase . Figure 11 Specific f lowchart of chassis module. Hand le module The la wnmower handle module also consist s of mainly steel alloy, steel wire, aluminum and plastic s while the detailed weights of each material are listed in Table 6 , and Figure 12 shows the specific flowchart for handle module. P2 represents the a luminum forging process and is R1 R2 R4 R5 R6 R7 Transport Transport Transport Transport Transport Transport P2 P1 P1 P1 Transport Transport Transport Transport Transport Transport Powdering Processing blade Chassis production Injection moulding Injection moulding Injection moulding Chassis module Processing Aluminum forging Steel alloy production Steel wire production PP granulate production ABS granulate production PVC granulate production Al EN46000 production 14 about the energy used to transform materials as both ADC12 and EN46000. And the data is also average data and fr om a project named IDEMAT2001 from Delft University of Technology . And the data been used for the plastics processing was still P1 injection mould. Table 6 Material composition s of handle module per functional unit. Materials Weight(kg) Steel alloy 4.957 Steel wire 0.594 Aluminum 0.279 Plastic - PP 0.055 Plastic - PA+PA30GF 0.11 Rubber 0.04 Figure 12 Specific f lowchart of handle module. Axle and suspension module Plastics components were still processed from granulate and the mould injection (P1) and Al EN46000 were forged from other substances and materials as P2 showed. The impacts here for steel alloy components and steel wire components basically were assumed f rom raw material production impacts due to lack of processing data and major transport data from raw material suppliers. Figure 13 shows the specific flowchart for axle and suspension module. R1 R2 R4 R5 R8 R9 R10 Transport Transport Transport Transport Transport Transport Transport P2 P1 P1 P1 Transport Transport Transport Transport Transport Transport powdering Rubber production Processing PA6 granulate production Injection moulding PA30GF granulate production Injection moulding Processing handel assy collect Processing handel support Handle module Injection moulding PP granulate production Steel wire production Al EN46000 production Aluminum forging Steel alloy production Processing 15 Figure 13 Specific f lowchart of a xle and s uspension m odule. Power module The major parts of power module are engine, gearbox and starter battery. All the data available from suppliers are only the chemical composition of these components , which could be seen in Table 7 and Table 8 . T he battery is lead - acid battery , and manufacturing data is based on one battery life cycle study (Rantik, 1999) . Table 7 Material composition s of engine per functional unit. Material Weight(kg) Aluminum - ADC12 5.453 Steel 2.1411 Iron 1.6412 Plastic 1.1902 Copper 0.1138 Zinc 0.0096 Rubber 0.0362 Miscellaneous 0.2944 Table 8 Material composition s of battery per functional unit. Material Weight(kg) Grease 0.035 H 2 SO 4 0.15 O ther 0.1255 Pb 0.55 PbO 2 0.2 R1 R2 R4 R5 R8 R9 Transport Transport Transport Transport Transport Transport P2 P1 P1 P1 Transport Transport Transport Transport Transport Processing Processing powdering Axle & suspension module Processing Aluminum forging Injection moulding Injection moulding Injection moulding Steel alloy production Steel wire production Al EN46000 production PP granulate production PA granulate production PA30GF granulate production 16 Figure 14 Specific f lowchart of p ower m odule. R1 R9 R5 R3 R12 R13 R14 R10 R11 R15 R16 R12 R7 Transport Transport Transport Transport Transport Transport Transport Transport Transport Transport Transport Transport Transport P1 P1 P2 Transport Transport Transport Transport Transport Transport Transport Transport Transport Transport Transport Transport Transport Transport Transport Processing Crude iron production Processing Processing belt guide Processing battery Injection moulding Injection moulding Aluminum forging Steel alloy production PP granulate production PA30GF granulate production Al ADC12 production Cu production Processing engine power module PVC granulate production H 2 SO 4 production Processing Cu production P3 PVC extrusion Steel ETHS production Processing Zn production Processing Lead production Processing Rubber production Processing 17 Branding module In this module, 3 groups can be divided: plastic components, stainless steel skid plate and the wheel. Processing of rubber and steel was omitted since the weights are too small compared with the total weight of the lawnmower. Figure 15 Specific f lowchart of b randing m odule . Fasteners In this study t he steel wire is assumed been used for fasteners and as Figure 7 show n the steel wire production processes included ore extraction, general t ransport, heating and roll ing and drawing processes. Due to the supplie r didn't reply the survey, the t ransport and specific fasteners processing are unknown. Compared with the steel wi re production the processing of fasteners can be omitted. Figure 16 Specific f lowchart of f asteners processing. R16 R10 R14 R5 R8 Transport Transport Transport Transport Transport P1 P1 P1 Transport Transport Transport Transport Transport Processing wheel Transport Stainless steel production Injection moulding Branding module Processing Processing PA granulate production Injection moulding PP granulate production Injection moulding Steel ETHS production Rubber production R2 Transport Transport Fasteners module Steel wire production Processing fasteners 18 Packaging Table 9 Material composition s of packaging module per functional unit . Parts name Material composition Weight(kg) Carton Corrugated cardboard 5.50 Manual Virgin material paper 0.20 Production of wood containing uncoated paper (9 4% dry matter) mainly from ther m o mechanically produced wood pulp with some bleached su lphate cellulose in one factory in Switzerland .This kind of paper is mainly used in printing industry. Assembly As the assembly work is finished in Höör, it was accompanied with the main steel compon ents processed as well a s the powdering process. T he capital goods and human resources were not taken into considerations. Figure 17 Specific f lowchart of assembly . Energy, as electricity, has been a lready allocated in Höör : 4.32 k W h for each piece of product which covers steel processing, powdering and assembly (Johan, 2010) . Electricity use is the Swedish average data from the IEA statistics (Baumann & Tillman, 2004) . The powder in use is named phosphate zinc and for each unit 0.13kg was used (Edman, 2009) . The specific powder production data have not been found, then the reaction between Zn an d phosphate acid is assumed as : Zn+H 3 PO 4 →H 2 + Zn 3 (PO 4 ) 2 In this case, zinc p roduction (R11) represented w orld average data and background transport covering delivery to Rotterdam with technology in 2000 . R31 phosphoric acid production was Transport Transport Transport Transport Transport Transport Use Modules components Components processing Assembly Powdering Electricity production Wasted material R1 Steel alloy production R31 Phosphoric acid production R11 Zinc production 19 on German t otal aggregated system inventory covering p ro duction from calcium phosphate and sulfuric acid. No land use and capital equipment s were accounted . 3.1.4 Transport Transport phase calculations were based on communication with Monica Arvidsson and Carl Risholm in Husqvarna AB. Only first tier suppliers were taken int o considerations in this phase and t he basic assumptions for procurement were that transport in Europe were with truck while out side of Europe were with ship ( Risholm , 2009) . W hile for wholesale, e xternal logistic companies were used to distribute the mowers from the factory in Höör to different locations in Europe in 2009 and trucks of 13.6 loading meter were assumed to use ( Arvidsson , 2009) . All the goods are transported by truck with semi - trailer (13.6 loading meter included in this category) , lo ng distance transport based on the assumption that 70% load capacity is used which included empty return transports (NTM, 2002) . The aggregat ed data of input and output of transport phase are given in Table 10 . The data include the fuel consumption and major emissions from the vehicles , and also energy requirements and emissions from production and distribution of the fuel. This fuel gives Euro 3 emission which is significantly lower than standard fuel , and c omponents or p roducts with oversea transport are transported by m edium sized shi p (NTM, 2002) . The environment impact of construction of vehicles, roads, or other infrastructure is not included. The data is based on fuel of environmental class 1 (more than 90% of the fuel sold in Sweden is of this type). Table 10 Inventory of the tra nsport per functional unit . Wholesale Suppliers Total U nit INPUT Diesel 0.884 1.376 2.260 l/f.u . OUTPUT Energy 31.654 49.257 80.911 MJ/f.u . CO 2 2286.120 360.196 2646.316 g/f.u . NO X 14.508 70.955 85.463 g/f.u . HC 2.066 3.033 5.099 g/f.u . Particulate matter 0.251 2.509 2.760 g/f.u . CO 2.022 3.856 5.878 g/f.u . SO 2 0.572 43.498 44.070 g/f.u . 3.1.5 Use and maintenance Use phase description In the goal and scope definition phase, the function al unit and the system boundar ies ha ve been decided, which are maintenance of 1000 m 2 lawn in Sweden during 10 years. And the 20 maximum working hours for LC48VE is 250 hours (Ahlund, 2009) , while the grass growth period in Sweden is 5 months, the working hours for LC48VE per week is : t = ( 250 ℎ / 10 ) / ( 12 ℎ / ) 4 / ℎ = 1 . 25 ℎ / ℎ Besides, the cutting length for LC48VE is 48cm, which means the velocity is: μ =( 1000 2 0 . 48 / 1 . 25 ℎ ) = 1 . 67 / ℎ And which would not exceed the engine ’ s maximum velocity 5.4 km/h . Emissions and fuel consumption When fuel consumption calculated, the data was based on the scenario that the engine worked under half of maximum load with i ntermediate 3060 re volution per minute (Edman, 2009) . And the emission data was from environmental approval of Brigg & Statton Corporations . Table 11 Hnput Mnd output of IC48VE’use during the Rhole life cycle per functional unit . The basic maintenance for L C48VE includes the lubricant us age and blade replace ment (Johan, 2010) , an d during the 250 hours life time , one LC48VE need s 4.2l engine oil as well as 2 pieces of extra blades. Figure 18 illustrates the use phase of LC48VE. P25 petrol production is about the unleaded petrol in Europe stock ( ETH - ESU, 1996 ) . P26 lubricant production is found in CPM database which was one study on r apeseed oil for use as hydraulic oil in forest machines in Sweden (Marby, 1999) . P27 HDPE bottles production includes blow mounding process, productio n of PE resin, transport of the resin to the converter, the conversion process itself and packaging of the finis hed product for onward dispatch ( Plastics Europe , 2005 ). INPUT Unit P etrol 219 . 75 l Engine oil 4.2 l Blade 2 p ieces OUTPUT CO 2 173.0 8 k g HC 3.07 k g NO X 0.7 7 k g 21 Figure 18 Flowchart of use phase . 3.1.6 End - of - life There is no data availiable for how waste compan ies treat the o ld lawnmowers . So based on literature research and telephone inter view with Lindman in Renova , the local waste treatment company. Figure 19 shows the flowchart for end - o f - life phase and s c enario is as following: For plastics, all the plastics can be assumed to be incineranated (Lindman, 2010) . All the metal would went throu gh scrappers being separated as well as the metal in batteries, and they can be recycled (Lindman, 2010) . Since in one previous end - of - life study about vehicles the recycling rate is calculated as 97%, the same rate is u sed in this situation. In this case t he metals considered as recyclable included Al , steel and lead in the mower . Recycling of lead - acid batteries is done by the blust - furnace process. I nventory dat a bout the incineration and recycling process es were taken as E uropean average level . Figure 19 Flowchart of end - o f - life phase. Transport Transport Transport Transport Transport Transport Transport Transport Transport Transport Use R1 Steel alloy production P2 Petrol production R26 Lubricant production Retail Extra blade processing Raw material production P27 HDPE bottles production Raw material production Wholesale Use Transport P6 Plastic & P8 Paper Incineration Landfill P5 Plastics, P7 Paper P9 Battery, P10 Steel & P11 Al Recycling 22 3.2 Impact assessment 3.2.1 Characterisation Table 12 shows the total result covering production, transport, use and maintenance and end of life phases. Potential contributions to environment in the chosen categories are shown in Figure 20 . Generally the production and use phase together always have dominant impacts on the environment compared with the others. The negative value for photochemical ozone creation potential (POCP) mainly comes from the use phase. The reason for this is because of the NO X emission from the lawnmowers , since NO has obvious positive performance in this impact. That means NO will decrease the pote ntial of photochemical ozone crea tion. As can be seen, t ransport part also shows negative value in POCP column due to NO emissions from fuel consumption . Table 12 Life cycle impacts of l awnmower LC48VE per functional unit. Categor y U nit Weight Depletion of abiotic resources kg Sb eqv 5.07 Acidification kg SO 2 eqv 2.49 Global warming kg CO 2 eqv 321 Eutrophication kg PO 4 3 - eqv 0.884 POCP kg ethylene eqv 0.0291 Human toxicity kg 1,4 - DCB eqv 1280 Ecotoxicity kg 1,4 - DCB eqv 19.2 Ozone depletion potential kg CFC - 11 eqv 0.000913 Figure 20 Characterisation results from the whole life cycle of Lawnmower LC48VE. - 20% 0% 20% 40% 60% 80% 100% End of life Use Transport Production 23 If traced back in the production phase, the main contributor s of the environment impacts could be found as power module and chassis module . Figure 21 Characterisation results from the production phase of Lawnmower LC48VE. 3.2.2 Weighting The results of two weighting methods are shown in Table 13 , a nd one thing need s to be note d is that Eco - indicator 99 and EPS2000 are based on different principles and weighting factors. Thus the values of the result s can not be compared in absolute number. But EPS2000 and Eco - indicator 99 both represented the same as the characterisation result illustrated : use and production take dominant impacts . Graphic illustration s can be seen in Figure 22 . Table 13 R esults according to different weighting methods. Total Production Transport Use End - of - life Unit EPS 2000 297.7 139.9 1.5 145.3 11 ELU Eco - indicator 99 37.6 7.5 0.3 28.2 1.6 - 20% 0% 20% 40% 60% 80% 100% Assembly Power module Packaging Handel module Fasteners Chassis module Branding module Axle &Suspension module 24 Figure 22 Weighting results of IC48VE’ s life cycle impacts according to EPS2000 and Eco - indictor 99 . T he chassis and power module together t a k e the overwhelming majority of total environmental impacts , while Figure 23 illustrate s t he contribution of each source in production phase and use phase. T he power module in production phase contribute s 43% of total impacts in this phase, followed by chassis module as almost 40%. And in use phase, due to continuous petrol consumption the crude oil needed majorly for petro l consumption took more than 60% of total and followed by CO 2 emissions, 15%. One thing needs to be mention ed is that noise can be taken into calculation in EPS2000 and the n oise factor for each vehicle is 0.00 253 (ELU/ kilometres). In this case, only the noise generated during use phase. For LC48VE in 10 years life ti me span , the velocity as calculated in use phase is 1.67km/h, so the environment impacts can be evaluated as: Noise = 1 . 67 ℎ × 250 ℎ × 2 . 53 × 10 − 3 = 1 . 056 And the impact of the noise as can be seen in Figure 23 is insignificant . Figure 23 Weighting results of production phase and use phase according to EPS2000 . product - ion 47% Transpo - rtation 0.513% Use 49% End of life 4% EPS2000 product i - on 20% Transp o - rt 1% Use 75% End of life 4% Eco - indicator 99 0% 20% 40% 60% 80% 100% Production phase Assembly Power module Packaging Handel module Fasteners Chassis module Branding module Axle &Suspension module 0% 20% 40% 60% 80% 100% Use phase Nosie CO2 Emission Water Consumption Oil consumption Iron ore Cu ore Others 25 D igg in g into the impacts sources of power module and chassis module in production phase, copper consumption and iron ore consumption were the major contributors respectively. Due to the weighting factor differences (for copper ore is 208ELU/kg and for bauxite is 0.449 ELU/kg) the copper with smaller weight than Al have bigger impacts although. For the chassis production large amount of steel have been used, and that could explain why iron ore consumption contributed more than 40% of chassis modu le ’ s total impact with iron consumption ’ s weighting factor 1.23 ELU/kg. EPS2000 emphasized the depletion of resources and the other is that huge gap s between the weighting factors could explain had larger percentage of chassis module ’ s impacts and also 5.4 5 kg Aluminum - ADC12 had much smaller influence than 0.114kg copper, and even 1.64kg iron . Figure 24 Impacts sources for power module and chassis module according to EPS2000. Huge differences existed in the relation of different phases when different weighting methods were used. As EPS2000 and Eco - indicator 99 being used, similar trends the results showed as Figure 24 and Figure 25 . T hat chassis and power module together are dominant in production phase as oil consumption in the same situation to use phase. Figure 25 Weighting results of production phase and use phase according to Eco - indicator 99. 0% 20% 40% 60% 80% 100% Power module PAH emissions Cu ore consumption Iron ore Bauxite Others 0% 20% 40% 60% 80% 100% Chassis module Iron ore Oil CO2 emission Natural gas Cu ore Others SO2 emissions 0% 20% 40% 60% 80% 100% Production phase Assembly Power module Packaging Handel module Fasteners Chassis module Branding module Axle &Suspension module 0% 20% 40% 60% 80% 100% Use phase Others Oil consumption PAH CO2emissions 26 3.3 Sensitivity analysis Sensitivity analysis can be used to identify the sensitivity of critical data . Because metals show to have a large impact of the result, and the recycling rate was uncertain, recycling has being considered in sensitivity analysis. Figure 26 shows the characterisation results from variations of recycling rate, metals have been recycled in end - of - life phase are steel alloy , aluminum , crude iron and copper, the percentages indicate that how many percentage of the recycled metals go back to system, and 0 is the base case which shown in Figure 10 . It is obviously that increasing the share of recycled metals makes better environmental performances of Lawnmower LC48VE. POCP and acidification categories are the most influenced factor by variation of recycling rate. The weighting results from vari ations of recycling rate are presented in Figure 27 and Figure 28 , ELU value decreased 35 % if all the recycled metals go back to the system compare d to the base case, however only 17% impact is decreased according to Eco - indicator 99. Figure 26 Characterisation results variations with different recycling rate. 0% 20% 40% 60% 80% 100% 100% recycled 70% recycled 50% recycled 30% recycled 0% recycled 27 Figure 27 W eighting results variations with different recycling rate according to EPS2000 . Figure 28 W eighting results variations with different recycling rate according to Eco - indicator 99 . 3.4 Discussio n In use phase, im pacts of Lawnmower LC48VE var y due to user habits and result s are based on average using time in this st udy. Recycling of batteries is not included, if all the batteries are recycled, there would be a better environmental performance of Lawnmower LC48VE. One limitation of this case study is that data cannot be found i n most production processes . M aterial losses were only calculated in plastic parts injection, losses during transport and other processes were not considered. 3.5 Conclusion  Production phase and use phase together contribute dominant impacts after characerisi tion impacts of each environment categor ies , especially major impacts in Human toxicity .  Weighting methods as EPS2000 and Eco - indicator 99 being applied show difference in 0 50 100 150 200 250 300 350 400 Recycling rate Unit (ELU) 100% recycled 70% recycled 50% recycled 30% recycled 0% recycled 0 5 10 15 20 25 30 35 40 Recycling rate 100% recycled 70% recycled 50% recycled 30% recycled 0% recycled 28 final result which is because different emphasi s of each method, while in EPS2000, production contributed the major impact 47% and use phase for 49% of final and for Eco - indicator 99 use phase took 75% in total.  In production phase, the major impacts contribution was from chassis module and power module due to the large metal demand in these two modules . In use phase, no matter which weighting method used, oil consumption contributes dominant impacts, both more than 60% of total.  Increasing the share of recycled metals could make better environmental performances of Lawnmower LC48V E .  The assembly in H öör only contributes a very small part of the environmental impact. 29 4. Case of Automower 220AC 4.1 Inventory analysis The inventory analysis of Automower 220 AC consists of an analysis of following phases in the lifecycle:  Production ( including raw materials, components and assembly )  Transport  Use  End - of - life Data were collected and results are presented for each of these phases. These phases are described in the following subsection. 4.1.1 Flowchart Figure 29 shows the simplified flowchart of Automower 220 AC. Figure 29 Simplified flowchart of Automower 220AC ( dotted boxes was not considered in this study since lack of data ). 30 An initial flowchart has been constructed, depicting all the differen t data needed to succeed in making of this LCA. The activities with dot ted line are not considered in this study since lack of data, and not considered having a major impact on the result based on the scope of the study. The production phase includes the processes that happened before all the components and materials arriving at Newton Aycliffe , UK, as well as the plastic components manufacturing processes in Newton Aycliffe. Raw material extraction, transport and other processing procedures were included. The production process would be divided into several modules and each mo dule includes several components. Transport phase covers the processes in both components purchase and products wholesale, but excluded transports happened in retail processes. Besides, the transport happened in raw material extraction, purchased by suppli ers can be only approached in data base, were defined as background transport and were Mccounted to eMch module’s environmentMl impMcts in this cMse. Use Mnd mMintenMnce stMtics data were from Husqvarna, while end - of - life data were base d on assumptions and telephone interview from Renova AB, which is a Swedish waste treatment company. 4.1.2 General data Raw material For Automower 220AC, Husqvarna purchased many components while only manufactured main plastic parts and assembled them in Newton Aycliffe , UK. The data collection processes mMinly focused on the direct supplied components’ rMR mMteriMl origins, processing impMcts and transport form suppliers to Husqvarna and from Husqvarna to different central warehouse. In this case, average data of raw ma terial production were adopted. Acrylonitrile - Butadiene - Styrene (ABS) mainly used as covers of Automower and inventory data of ABS granula te production ( R 17 ) i s from SimaPro database . Data based on average data from all suppliers in Western Europe for 199 5 - 1999, and transport data are not included. The inventory data for acrylonitrile - styrene - arcylate (ASA) production ( R1 6 ) is assumed to be the sa me as R 1 7 since lack of data for ASA. Data of Polyamide 66 (PA 66) production R 18 were obtained from SimaPro database , PA66 GF30. PA 66 is the product of polyamide 30% glass fibre production. Inventory data of PA66 production are based on average Western Europe data for 1995 to 1999, transport data are not include d and no applicable allocations. Raw materials R 19 to R 24 are: R 19 - propylene (PP), R 20 - polymethyl methacrylate (PMMA), R 2 1 - poly - formaldehyde (POM), R 22 - ethylene - propylene - diene monomer (EPDM), R 23 - Pol yamide 6 (PA6) , and R 24 - polythene (PE). 31 Data of R 19 – R 24 were obtained from SimaPro data base , and i nventory data of R 19 to R 24 production are based on average Western Europe data for 1995 to 1999, transport data are not included. Inventory data of R 27 steel production is from SimaPro database , “ steel ETH ” . Data based on average Western Europe data fo r 1990 - 1994, transport from mine to factory is not included. Al uminum production (R 28 ) data from SimaPro database , Al uminum ingot were used. Data based on average data from all suppliers in Western Europe for 1990 - 1994, transport data are not included. LC I data for R 29 copper production is based on world average data for 1993, (Simonson, Andersson, & Rosell, 2001) . It is assumed as a mix product of 80% virgin and 20% recycled copper. Data include transport from mine to factory gate. Electricity production Electricity production in different countries and regions are ba sed on different energy sources. I n this study electricity consumption was considered in Sweden and United Kingdom. Energy sources of English electricity producti on mainly consist of hard coal (35.5%), nuclear (28.08%) and fuel gas (36.42%), and Swedish sources are considered as nuclear (46.5%), oil (2.06%) and hydro electricity (51.44%) (Baumann & Tillman, 2004) . 4.1.3 Production The Automower consists of motor module, cable module, electronic module, fastener module, packaging module and plastic components module. Data were collected and results are present ed for each module in this section. Plastic components module The plastic compo nents of Automower are mainly produced by Husqvarna, rest parts are purchased from different suppliers. Total weight of plastic components per function al unit is 8.45 kg and contains several materials (Automower BOM, 2009) . Det ailed flow chart o f plastic components is shown in Figure 30 . 32 Figure 30 Flowchart of plastic components module . P rocesses occurring in Husqvarna factory are marked with grey shade . Resources use and environmental impacts of raw material production R1 6 - R 24 were calculated by using general raw material inventory data (Section 4.1.2 Raw material). After aggregated same material, the material composition and their weights are given in Table 14 . Table 14 Material and weight for plastic componen ts (Automower BOM, 2009) . Material Weight (kg / f.u.) ABS 2.682 ASA 3.252 EPDM 0.137 PA 6 0.029 PA66 0.417 PE 0.002 PMMA 0.155 POM 0.08 PP 1.696 Raw materials of components which are made by Husqvarna UK are produced and transported to Husqvarna, then moulded by injection machines. P1 3 is injection moulding in Husqvarna and electricity use for P1 3 is 6.924 kWh per function al unit (Coates, 2010) . Geographical region of Electricity production was defined as UK and emissions and resources use during electricity production were calculated by using average British electricity production (International Energy Agency, 2000) . Production data for PP components which are not made by Husqvarna was obtained from S imaPro database , PP injection. All the production data for P 14 were assumed to be the same as R16 ABS granule production R22 EPDM granule production R23 PA 6 granule production R21 POM granule production R19 PP granule production R24 PE granule production Transport Transport Transport Transport Transport Transport P14 Injection moulding P14 Injection moulding P14 Injection moulding P14 Injection moulding P14 Injection moulding P14 Injection moulding R16 ASA granule production R17 ABS granule production R18 PA 66 granule production R19 PP granule production R20 PMMA granule production R21 POM granule production Transport Transport Transport Transport Transport Transport P13 Injection moulding P13 Injection moulding P13 Injection moulding P13 Injection moulding P13 Injection moulding P13 Injection moulding Transport A1 Assembly 33 for PP injection. Raw materials losses caused by warming up and cleanin g machine were assumed as 3% (Foster, 2010) . Transports (with dot line) and weight l osses during plastic granule production were not concerned since lack of data. Assembly A1 and transport with solid line will be discuss ed in section 4.1.3 and section 4.1. 4 respectively. Electronic module Electronic compone nts include batteries , p rinted c ircuit b oards (PCBs) and other small electronic parts. Battery is used for provide energy for Automower. Automower used a pack of 15 cells w hich also includes tags, solder and other packaging material, the total weight for one cell is 49.68 g (GP Battery, 2009) , the battery is delivered to Husqvarna UK from GP Battery Company , Hong Kong, raw m aterials and their weights in R 25 are shown in Table 15 , the data for producing raw material s in R 25 were obtained from a previous LCA study about batteries of electric vehicles (Jose, Maria; Garcia, Acevedo, 1996) . Energy consumption during battery production P 15 is 0.2kWh/PCS (Leon, 2009); emissions and resources use during electricity production were calculated by using average British el ectricity production (International Energy Agency, 2000) , emission data for P 15 were not available from suppliers and thus not included in this study . Figure 31 Flowchart of electronic module. Table 15 Material content in one cell of NiMH battery (GP Battery, 2009) . Material content in NiMH battery Nickel 34.22% Iron 26.55% Nickel hydroxide 22.06% Water 7.75% Polypropylene 4.53% potassium hydroxide 3.10% Other Compound 1.79 % R25 Raw material production R30 Rawmaterial production Transport Transport P15 Battery production P16 PCB production Transport Transport A1 Assembly 34 PCB is a very complicated electronic unit, and inventory data for PCB were assumed to be the same as for Printed board (SimaPro database ), both raw material production R 2 5 and PCB processing P 16 are included in this data set , data based on modern technology during 1995 - 1999 in Western Europe. Total weight of PCB per function al unit is 0.636kg. Fastener module Figure 32 shows th ree main parts of fastener module , screws, blades and Al plate . Environmental impact s from raw material production R 27 and R 28 were calculated by using general material production inventory (Section 4.1.2 Raw material). Figure 32 Flowc hart of fastener module. Activities with dot line were not count ed in the inventory of fasteners module due to lack of data , but is not assumed to be major impact on the result since fastens only take a small weig ht percent of the whole product. Transport and assembly process A l are discuss ed in subsection “AssemNly” . Motor module An Automower includes 3 motor parts, which were made by different suppliers and delivered to Husqvarna. Figure 33 shows the flowchart of Motor module, r esources use and emissions from raw material production R1 6 , R 26 , R 27 , R 28 and R 29 were calculated by using general material production inventory (Sectio n 4.1.2 Raw material). Due to lack of processing data, inventory of Motor module were calculated by material composition only. Material composition of these components is shown in Table 16 . Screw Blade Al plate R27 Steel production Transport R27 Steel production R28 Aluminum production Cold heading Transport Transport Thread rolling blade production Al plate production Transport Transport Transport A1 Assembly 35 Figure 33 Flowchart of Motor module. Table 16 Material composition of Motor module (Foster, 2010) . Parts name Material composition Weight (kg/f.u.) Motor Cutting System 10.5%Cu+17.9%Al + 71.6% s teel 0.400 Euro Transformer 32%Cu + 22% Oil + 46% s teel 1.470 Dunkermotor Drive Assy 80% steel +20% ABS 2.000 Packaging Carton is produced from 100% new fibers (Saica Packaging, 2009) . Inventory data of carton is from SimaPro database , new carton, based on average technology during 1990 - 1994 in Western Europe, system bounda ries were defined as from forest to carton. The weights of packaging materials are given in Table 17 . Figure 34 Flowchart of Packaging module . Fitting is made from PE, and t he PE production R9 ha s been defined in section 4.1.2 . However processing data of fitting are not available since lack of data. R29 Copper production R28 Alumium production R27 Steel production R29 Copper production R26 Oil production R27 Steel production R27 Steel production R16 ABS granule production Transport Transport Transport Transport Transport Transport Transport Transport Cutting motor production Transformer production Dunkermotor production Transport Transport Transport A1 Assembly Carton Manual Fitting P18 Paper production R24 PE granule production Transport Transport P17 Carton production P19 Printing fitting production Transport Transport Transport A1 Assembly 36 Table 17 Weights of packaging materials per functional unit (Gilmore, 2009) . Material Weight (kg) Carton 1.542 Paper 0.234 PE (fitting) 2.018 Paper of manual was defined as uncoated paper, production of this paper (94% dry matter) mainly from mechanical wood pulp with some bleached sulphate ce llulose and latex coating in a factory in Switzerland for 1994, paper are delivered to printing plant to get print and then transported to Husqvarna UK, the inventory data of P 18 paper production and P 19 printing process were obtained from SimaPro database (Pr e Consultants BV, 2008) . Cable Module Cable Modules consists of cables, wires and looms. They are assumed have the same material composition and production process. Figure 35 shows the life cycle of cable module. Total weight of cable is 3.467kg per function al unit, and 67.5% copper and 23.5% PE was defined as cable constitutes (Margaret, 2001). LCI data for R 29 ( Copper production ) and R 24 ( PE granu le production ) have been state in section 4.1.3 . Processes with dot line were not count in to the cable inventory data since they are not available, transport with solid line is discuss ed in section 4. 1.4. Data for P24 was obtained from CPM database, “ Copper extrusion and drawing to profiles ”, Rhich RMs NMsed on MverMge GermMn industry dMtM of 1EE5. Figure 35 Flowchart of Cable module. Assembly Automower is assembled ( A1 ) in Husqvarna UK, all the parts are transport ed along the assembly line, and then assembled manually. One electricity meter record total electricity for 14 assembly lines in the assembly factory . Electricity consumption for one Automower is R24 PE granule production R29 Copper production Transport Transport Eventually mixing of plastic materials P24 Drawing of copper wire to specified diameter Extrusion of cables Transport A1 Assembly 37 2.61kWh, which energy consumption was allocated by pieces. Geographical region of e lectricity production was defined as in UK , while emissions and resources use during electricity production were calculated by using average British electricity production d ata (International Energy Agency, 2000) . 4.1.4 Transport Only t ransports from first tier parts suppliers to Husqvarna Aycliffe factory and transports from Aycliffe to wholesales were calculated in this part. All the goods are tran sported by truck with semi - trailer, long distance transport, Euro 3 standard, and based on the assumption that 70% load capacity is used (NTM, 2002) . Products for Mexico and Canada are transported by m edium sized ship (NTM, 2002) . The aggregation data of means of transport and their loads are given in Table 18 . Table 18 Means of transport and load. Direction Truck Ship Unit (/f.u.) Suppliers to Husqvarna 23.0455 Tonne*km Husqvarna to Wholesales 35.4347 140.3968 Tonne*km 4.1.5 Use Three packs of batteries (one pack per 2.5 years) an d 81 blades (9 blades per year) are needed to be replaced during a life time of 10 years (Gustvasson, 2009) has been assumed. It is assumed that to mow 1000m 2 lawns, Aut omower is used as 12 hours (6 charges) per day, 3days per week, namely 396 charges per year (Gustvasson, 2009) . Energy efficiency for charging was calculated as 52% (Jose, Garcia, & Schluter, 199 6) , electricity use for charging is 1069.2 kWh per functional unit. Geographical region of e lectricity production was defined as in Sw eden while emissions and resources use during electricity production were calculated by using average Swedish electricit y production data (International Energy Agency, 2000) . 4.1.6 End - of - l ife When mowers are out of use, they are sent to recycle company nearby, metals and papers are recycled and plastic parts are incinerated, others were assumed to go to land fill (Renova AB, 2010) . 38 Figure 36 Flowchart of e nd - of - l ife . Inventory data of recycling metal s are based on previous LCA study of v ehicles and only 97% (Boss, 2005) weight of metals could be obtained after recycled since there would be some losses when recycling . Environmental impacts were allocated by weight. Products of recycling metals are 5.4kg steel, 2.77kg copper and 0.16kg Aluminum. Data of incineratio n P 21 was obtained from SimaPro database , p lastics to m unicipal w aste i ncinerator. Plasti cs were defined as long life plastic . Inventory data of P 21 include the environmental impacts of transport to the Municipal Waste Incinerator (on average 10 km), treat ment of flue gas, and further waste treatment of slags and ashes. Data were based on average Europe situation of 1995. Emissions of landfill P 20 were not traced. For recycling, data was calculated by using the data of a previous LCA report (Boss, 2005) , which included the inventory data for metal recycling. P23 is the scrap based metal production; data for this activity was obtained from CPM database (CPM, 2010) . 4.2 Impact assessment In this section the impact assessment of Automower 220AC is presented, the calculation based on a comprehensive coverage of production, transport , use phase and end - o f - life, as well as electricity generation. The recycled metals were considere d as not go b ack to the system, but the emissions and inputs needed in recycling were take account into the impact assessment. Impacts of production phase was further analyzed and discussed in order to get a deep understanding and facilitate product develop ment of Auto mower. 4.2.1 Characterisation Table 19 list the total life cycle impacts according to defined characterisation of Automower. Generally, production and use p hase always have larger environmental impacts compare to the others. As shown in Figure 37 , in the categories global warming, acidification, eutrophic ation, ecotoxicity, POCP ( photochemical ozone creation potential ) and ozone depletion, production phase account for more than 60% of the total impact. Use phase takes 80% of total impact in resource depletion category due to crude oil consumption in electr icity production, which is used for battery charging. Use Transport P20 Landfill P21 Incineration P22 Recycling P23 Scrap-based metal production Others Plastics Metal scrap go back to Production phase Paper, Metal 39 Table 19 Life cycle impacts o f Automower per functional unit . Category U nit Weight Global warming kg CO 2 eqv /f.u. 273 Acidification kg SO 2 eqv /f.u. 9.54 Eutrophication kg PO 4 3 - eqv /f.u. 0.137 R esource depletion kg reservebase - 1/ f.u. 0.450 Human toxicity kg 1,4 - DCB eqv /f.u . 52.1 Ecotoxicity kg 1,4 - DCB eqv /f.u . 6.65 POPC kg ethylene eqv /f.u. 0.367 Ozone depletion kg CFC - 11 eqv /f.u. 5.83E - 06 Figure 37 Contribution to the characterisation results from the entire life cycle of Automower. The results of further analyzed from production perspective are shown in Figure 38 . Electronic module contributes approximately half to all impact categories except resource depletion and ozone depletion. This is mainly caused by toxic and chemical substances which have lar ge consumption in PCB and battery production. Plastic components module shares approximately 40% impMcts in resource depletion Mnd ozone depletion cMtegory. ThMt’s due to the crude oil consumption in plastic production. Cable module gives 40% acidification and POC P impacts; the reason for this is because of the sulfur dioxide emissions in copper ore extraction. Packaging, fastener and motor module take relative lower impacts in production phase. - 20% 0% 20% 40% 60% 80% 100% End of life Use Transport Production 40 Figure 38 Contribution to the char acterisation results from the production phase of Automower . From a life cycle perspective, most influencing substances and phases for each category are summarized in Table 20 . Table 20 Most influencing substances and phases for each category . Category Substances Phases Global warming CO 2 Electronic module production (PCB production) Acidification SO 2 Cable module production Electronic module production Use Eutrophication NO x Electronic module production Resource depletion Crude oil Use Human toxicity Cadmium End of life Ecotoxicity Nickel Electronic module production PO CP SO 2 Cable module production Electronic module production Use Ozone depletion Halon 1301 All the p roduction 4.2.2 Weighting Table 21 shows the results of two different weighting methods, these two methods w ere described in section 3.1.1 . Both of the two methods were dominated by the production phase which is further analyz ed in Figure 39 . Transport, use and end of life phases take slight impact in the life cycle of Automower. - 20% 0% 20% 40% 60% 80% 100% Plastic Packaging Motor Fastener Electronic Cable Assembly 41 Table 21 Results according to different weighting methods. Total Production Transport Use End - of - life Unit EPS 2000 624.55 594.41 1.10 23.99 5.04 ELU Eco - indicator9 9 14.25 9.60 0.19 3.26 1.19 Results of different module productions according to EPS and Eco - indicator vary considerably. For example, cable module occupied 68% impact of production phase according to EPS weighting, but only 19% in Eco - indicator weighting, the reason for this is EPS weights copper ore consumption much higher than Eco - indicator weights, and cable production shares more than 80% in the total copper consumption. Use of resource is considered as an important factor in EPS weighting method. Electronic module contributes 7% impact of production phase by using EPS weighting, however i t is the dominate contributor according to Eco - indicator weighting. This is due to coal consumption and CO 2 emissions from electronic components production. Figure 39 Weighting of production phase according to EPS 2000 and Eco - indicator 99 . 4.3 Sensitivity analysis Some parameters will be varied in different conditions. One thing that might have a large impact is where the automower is used. Figure 40 shows the characteri s ation results for Automower which is used in UK. Compared to Figure 37 , if the use place is changed to UK, the proportion of impact in use phase has a large increase in global warming, acidification, resource depletion as well as eutrophication categories, and b ecome dominated in the whole life cycle. Assembly 0% Cable 68% Electronic 7% Fastener 1% Motor 16% Packaging 0% Plastic 8% EPS 2000 Assembly 0% Cable 19% Electronic 59% Fastener 2% Motor 7% Packaging 1% Plastic 12% Eco - indicator 99 42 Figure 40 Contribution to the characterisation results for Automower using in UK. Results of different use places according to EPS and Eco - indicator weighting method are shown in Figure 41 and Figure 42 respectively. ELU value of Automower used in Sweden is 624 and 153ELU will be added if it is using in UK. Eco - indicator results change from 14.25 to 34.75 when Automower uses in UK instead of uses in Sweden. In general, to use an Automower in UK has larger environmental impacts than use in Sweden. The main reason for this is electricity production in UK and in Sweden based on different energy sources. Energy sources in UK are mainly based on h ard coal, natural gas and nuclear, while Swedish electricity production are based on nuclear energy and hydro energy. Figure 41 Comparison of weighting results according to EPS 2000, use phase in UK and Sweden . - 20% 0% 20% 40% 60% 80% 100% End of life Use Transport Production 0 100 200 300 400 500 600 700 800 UK Sweden ELU EPS 2000 End of life Use Transport Production 43 Figure 42 Comparison of weighting results according to Eco - indicator 99, use phase in UK and Sweden. Figure 43 shows the characterisation results from variations of recycling rate, metals have been recycled in end - of - life phase are steel, aluminum and copper, the percentages indicate how many percentage of the recycled metals go back to system, and 0 is the base case which shown in Figure 37 . It is obvious that increasing the share of recycled metals makes better environmental performances of Automower. POCP and acidification categories a re the most influenced factor by variation of recycling rate. The weighting results from variations of recycling rate are presented in Figure 44 and Figure 45 . ELU value decreased 78% if all the recycled metals go back to the system compare to the base c ase, however only 17% impact decrease s accor ding to Eco - indicator 99. Figure 43 Characterisation results from variations of recycling rate. 0 5 10 15 20 25 30 35 40 UK Sweden . Eco - indicator 99 End of life Use Transport Production 0% 20% 40% 60% 80% 100% 100% 70% 50% 30% 0 44 Figure 44 W eighting results variations with different recycling rate according to EPS2000 . Figure 45 W eighting results variations with different recycling rate according to Eco - indicator 99 . 4.4 Discussion Specific u ncertainties of th is Automower case study are discussed in this section. Uncertainties and limitations for th e whole study are discussed in S ection 5. In reality, environmental impacts in use phase of Automower are various due to different user habits and the size of mowing area. Char ging frequency and total electric power consumption lead to variation of environmental performance. In this study, calculations are based on average using time. Another important parameter could be the energy sources for electricity production. The use o f fossil fuel based electricity is obvious has heavier environmental load than the electricity which produced based on clean energy sources. That is to say, using Automower in other countries could give different environmental impacts. 139.37 284.92 381.96 479.00 624.55 0 100 200 300 400 500 600 700 Total 100% 70% 50% 30% 0% 11.84 12.56 13.04 13.52 14.25 0 2 4 6 8 10 12 14 16 Total 100% 70% 50% 30% 0% 45 Recycling of batter ies was not included, if all the batteries are recycled and the materials are reused, there could be a better environmental performance of Automower. One limitation of this case study is that data cannot be found for most production processes . M aterial losses were only calcula ted in plastic parts injection. Spoilage, losses during transport and other production losses were not considered. 4.5 Conclusion  Production phase including raw material extraction contributes 60% impacts of each environment category , exclude resource depletion and human toxicity.  Cable (Cu) prod uction occupied more than half EPS indices .  Electronic module production dominant environmental impacts according to Eco - indicator 99.  Using Automower in Sweden ha s b e tter environmental perform ance than using in UK due to different sources of electricity production .  Assembly in HusqvMrnM’s fMctory only takes a minor part of total impacts .  Increasing the share of recycled metals could make considerably better environmental performances of Automow er. 46 5. Discussion Uncertainties and limitations , as well as their effects are discussed in this section . In t his study, the functional unit was defined as mowing Swedish lawn for 10 years as the same as lifetime assumed . However, in reality t he lifetime of lawnmowers (both traditional mowers and automowers) varies very much which will affect the final result . For instance, if the r eal lifetime is longer than 10 years, which is very probably in autom o wer case , the environmental impacts for prod ucing per piece of mower will differ from per functional unit . And extended lifetime will decre a s e environmental impacts in production phase compared to former one which could lead to a be tter environmental performance of the products . Users always mow lawns on their own way s ; variation s between use r s’ hMNit s leading to different amount of energy consumptions, namely the frequency of petrol filling or battery charging are undertrained . Besides, aesthetic matters and fertilization use for the lawn mainte nance have not been taken into account. Treatment of old mowers depend s on waste management companies and their locations, in Sweden, all the metals and papers of an old mower are recycled while all the plastic parts are incinerated, and these could be ch anged in diffident locations. The recycling rate depending on techniques and scales of the recycling companies , generally, larger companies could have new techniques which leading to a relevant higher recycling rate. Recycling rate also depends on the recy clability of materials and how the product is designed (the recyclability) . As analyzed in section4.3 , different recycling rate could vary the results rather much. The noise of lawnmower was analyzed by using a method for auto cars; the suitability of thi s could be discussed. For the working environment, the Automower obviously has lower noise than other lawnmowers; however, the noise of Automower was n ot account into the impacts, comparison in this category is not feasible. R aw material production data from database is call ed general data; these data usually based the average technology in relative large area (e.g. Western Europe). The use of these data is hard to apply in material selection and green purchasing, if the company wants to focus on the se aspects, more site - specific data are needed. M ost processing data for components missing is one of the significant limitations in this study, for example, the processing d ata for engine production was missing, as well as the chemicals used for battery production. Material losses and spoilage during processing and transport were normally not accounted for. Apart from some data missing, the t imeliness of these data is still partly sensitive as some “ green ” technologies have been improved and others were already mature then. Some of the uncertainty based on technology can be referred in different industrial annual report. Although 47 this would be time consuming and the usual way is to compromise the system boundary . Allocation s existed in resource consumptions, emissions and energy consumptions were allocated by weight in this study , and therefore components made from the same material with heav ier weight took relative larger impacts than the light er ones. Sometimes, the enviro nment impacts can be also allocated by pieces , normally in energy consumptions . Transport data mentioned in this study only include first tier suppliers, namely the transport from first tier suppliers to factories and the transport from factories to whole sales. Transport dat a in production phase are considered as background data, most of which are included in production inventory data. However, compared to production and use, transport phase, this is only a minor part. Due to the limitations of weighting m ethods, not all the inventory parameters were taken account into impact category. 48 6. LCA application 6.1 Methodology application ISO (the International Organization for Standardization) has contributed the 9000 series of standards for integration of products quality (Guinée, 2002) . A nd recently the 14000 series has been more and more focused , and in which , 14001 on Environmental Management has been already implemented in Huqvarna . Furthermore, the 14040 series are related with LCA. Compared to 14001 with attention at organizational level, the ISO LCA standards also cover the technical aspects of an LCA projects (Guinée, 2002) . ISO 14040 (2006) : About the principles and framework for life cycle assessment (LCA) , t echnique detail is not included in this standard , nor does it specify methodologies for t he individual phases of the LCA (ISO, 2006).  ISO 14041 ( 1998 ): A standard on goal and scope definition and inventory analysis (Guinée, 2002) .  ISO14042 (2000): A standard on life cycle impact assessment (Guinée, 2002) .  ISO14043 (2000): A standard on life cycle interpretation (Guinée, 2002) .  ISO14044 ( 2006 ): About r equirements and guidelines for life cycle assessment (ISO, 2006) .  ISO/CD 14045 (under development) : About P rinciples , requirements and guidelines of Eco - efficiency assessment of product systems (ISO, 2010).  ISO/TR 14047 ( 2003 ): Technical report “ provides examples to illustrate current practice in carrying out a life cycle impact assessment in accordance with I SO 14042. ” They highlight the key issues when implementing the life cycle impact assessment (ISO, 2003).  ISO/TS 14048 ( 2002 ): Technical s pecification provides “ the requirements and a structure for a data documentation format ” in consideration of transparen cy, precision and flexibility of inventory data, “ thus permitting consistent documentation of data, reporting of data collection, data calculation and data quality, by specifying and structuring relevant information ” (ISO, 2002) . This can be applied to des ign “ questionnaire forms and information systems ” (ISO, 2002) . .  ISO/TR 14049 ( 2000 ) : Technical report provides “ e xamples of application of ISO 14041 to goal and scope definition and inventory analysis ” (ISO, 2000) . Besides , another application of LCA is to communicate, covering the business to business (B2B) and business to consumer (B2C), which also can be called as “ green procurement” and “ green marketing ” . “ To ensure comparability ” Type III environmental declaration 49 programmes and Type III environmental declarations have been applied with more highly standardi s ed LCA methodology (Baumann & Tillman, 2004) .  ISO 1402 5 (2006): About principles and specifi c procedures for developing Type III environmental declarations ( ISO , 2006 ). 6.2 Data collection strategy It ’ s a long lasting discussion about how to improve the effectiveness of data collection , and there needs compromise in system boundary and accuracy of data. Following experiences and suggestion were based on the Husqvanar ’ s case s studies . Raw materials R aw materials data are d ifficult to obtain from suppliers , therefore different types of d atabase s are recommended for company internal study including i ndustria l life cycle i nventory ( LC I) report s from specialized associations ( Plastic - Plastic Europe , Steel - World Steel and Aluminum - European Aluminum Association ) and research institute or s oftware – SimaPro, Gabi and E coinvent ) . Processing In this case, processing mainly means the activities which transform raw materials to components . On - site investigation is direct but may not be as useful as expected since the level of details requirements . T he supplier s ’ sustainability report s could be helpful as suppliers ’ average data for electricity consumption, main resources depletion and focused emissions as CO 2 , NO X and SO 2 . Questionnaire way is o perable but low efficient . Transpor t Energy consumptions and emission factors were from the network f or transport and environment (NTM, 2009) and d istances was obtained based on electronic maps . Us e In this case testing data about the engine working were from supplier while the petrol and lubricant consumption were from internal study. Although f eedbacks from con sumers are ideal , for instance , use pattern covering the frequency of use . En d - of - life General data for waste treatment could be found from local waste management companies but for lawnmowers there still lack of s pecific data. Information on what is actually happening with old lawnmowers would be better choice compared to average data. Data management More specific material data of assembly parts are needed and i nternal data management needs improvement, e.g. periodic update and review of an internal database . Inquiring material and processing information from suppliers when purchasing is a more efficient way to obtain data 50 systematically. 6.3 Recommendation Figure 4 6 shows the level of detail when applying life cycle perspective in companies. The general Life Cycle T hinking is the ideM of MlRMys considering the impMcts from the product’ s whole life cycle. The m ost detailed perspective is performing an LCA study where the detailed data is generated into an estimation of the environmental impact. The life cycle perspectives when analyzing, evaluating and improving an organization or a s pecific product, prevents pr oblem shifting that can occur when focusing on a division or level in an organization or one phase of the products life cycle. The most common way of using life cycle perspectives is through l ife c ycle t hinking, LCT. Considerations are made on a very gener al a nd qualitative level (Frankle & Rubik, 2000) . However more specific approaches to incorporate life cycle perspectives ar e available. Figure 4 6 Levels of life cycle perspective (Frankle & Rubik, 2000) . A full LCA for a product is comprehensive and detailed; using professional LCA software is a good choice to facilitat e data management. HoRever, it’s not recommended HusqvMrnM do LCA for Mll the products since it’s time Mnd lMNor consuming, therefore, doing ICA of typicMl products and using life cycle thinking during product design (e.g. increasing recyclability of the product ) are more recommended. 51 7. Concl usion s This report presented LCA studies of the two products Lawnmower LC 48 VE and Automower 220AC. For both cases, production phase and use phase contributed dominant impacts of all impact categories exclude human toxicity, EPS2000 showed production phases including raw ma terial as the most critical and Eco - indicator 99 illustrated use phases are more important for the two cases. Assembly in Husqvarna factories and transports had little impact in most cases. Different emphasis in the two weighting methods caused this result and comparison will help decision maker have multi - vieR of different phMse’s impMcts in life cycle. For both mowers recycling rate of metal can influence different categories to different extends in charact erisation part, and since EPS2000 emphasi zed the resources depletion, better environmental performance can be ac hieved if more recycled metals are used in product system . What ’ s more, according to the discussion , to improve the durability of mowers will have positive impact s of the products ’ environmental performance. For company, improvement of internal database management is needed, and doing LCA of typical products and using life cycle thinking during product design are recommended. 52 Reference About Husqvarna . (2009, 09). Retrieved 04 12, 2010, from http://corporate.husqvarna.com/index.php?p=about&afw_lang=en . Baumann, H., & Tillman, A. - M. (2004). The Hitch Hiker's Guide to LCA (Vol. Studentlitterarur). Lund, Sweden: Studentlitteratur. Boss, A. (2005). Life Cycle Assessment of a Gas - Electric Hybrid Waste Collection Vehicle. Göteborg, Sweden. BUWAL 250. Life cycle inventory for packagings . Berne, Switzerland: Swiss Agency for the Environment, Forest and Landscape (SAEFL); 1998. CPM. (2010). Impact assessment methods . Retrieved 02 20, 2010, from CPM: http://www.cpm.chalmers.se/CPMDatabase/StartIA.asp CPM. (2008). SPINE LCI dataset: Copper extrusion and drawing to profiles . Retrieve d 01 21, 2010, from CPM: http://www.cpm.chalmers.se/CPMDatabase/Scripts/sheet.asp?ActId=Designer1997 - 12 - 08834 CPM. (2010). SPINE LCI dataset: Scrap - based steel production . Retrieved 04 14, 2010, from CPM: http://www.cpm.chalmers.se/CPMDatabase/Scripts/shee t.asp?ActId=CPMCTHXXX1998 - 04 - 08837 Ericsson. (n.d.). Material data. Retrieved 12 2, 2009, from Materials list: http://materialsdata.ericsson.net/materials_list.htm Frankle, & Rubik. (2000). Life cycle assesment in industry and business: Adoption patterns, applications and implications. The International Journal of Life Cycle Assessment , 133. GP Battery. (2009). Supplier BOS 220SCH for customer. Guinée, J. B. (2002). Handbook on Life Cycle Assessment. Kluwer Academic Publisheds. Husqvarna. (2009). Material Analysis Report 966975401. International Energy Agency. (2000). Electricity production based on different energy sources,during 1998. IDEMAT 2001, Database, Faculty of Industrial Design Engineering of Delft University of Technology, The Netherlands (2001). ISO (International Orgnaztion for Standarzation), http:// www.iso.org. Johan, N. (2010, 1 21). Questions about LC48VE. (X. Lan, Interviewer) Husqvarna. Jose, M., Garcia, A., & Schluter, F. (1996). Life - Cycle Assessment for Batteries of Electric Vehicles. G oteborg. 53 Jose, Maria; Garcia, Acevedo. (1996). Life - cycle Assessment for batteries for electric vehicles. Marby, A. (1999). Livscykelanalys . KTH Ingenjörsskolan . Misumi Europe. (n.d.). Technical data . Retrieved 11 22, 2009, from www.misumi - europe.com/www /pdf/eng/.../2863_2864.pdf NTM . (2002). Retrieved 2002, from www.ntm . se NTM. (2009). Retrieved November 22, 2009, from NTM: http://www.ntm.a.se/english/eng - index.asp Pre Consultants BV. (2008). SimaPro 7.1. Software and database manual. Amersfoort ,The Netherland. Rantik, M. (1999). Life Cycle Assessment of Five Batteries for Electric Vehicles under different charing regimes. CTH. Renova AB. (2010, January). Saica Packaging. (2009). SETAC - Europe. (1996). Towards a methodology for life cycle impact assess ment. Reprot from the SETAC - Europe working group on impact assessment. Simonson, M., Andersson, P., & Rosell, L. (2001). Fire - LCA model:Cable case study. Sweden. SSAB,Swedish Steel. (2008). Dogal 200 and Dogal Form Mild Steels for Drawing. DOGAL. SimaPro 7 . Software and database manual. Amersfoort, The Netherlands: Pre Consultants BV; ETH - ESU 96. Ökoinventare von Energiesystemen. ESU Group, (both unit and system processes), ETH Technical University of Zürich, 1996. Personal communication Bengt Ahlund. Husqvarna AB (2009, October ). Carl Risholm . Purchasing and Supply manager . Husqvarna AB (2009, October ). Coates, P. Project Engineer,Reserch and Development. Husqvarna AB (2010, January 26). Jonas, Edman. Project Manager Petrol Wheeled dep. Husqvarna AB (2009, September 07). Foster, P. Buyer, Materials Management. (2010, January 26). Gilmore, D. (2009, December 0 3). Gustvasson, C. Product Development Manager, Robotic Mowers. (2009, September 07). 54 Johan, N ilsson . Husqvarna Manufacturing Sweden AB . (2010, January 21). Lindman, K. Recycling of lawnmowe. Renova . (2010, January 31). Monica , F . Purchase Dep artment, Husqvarna Manufacturing Sweden AB . (2009, September, 17). Monica Arvidsson Business Administrator , Husqvarna A B . (2009, November, 23)