/
Assessment of Cardiovascular fitness in Wheelchair Rugby Athletes: Validation of the 8-loop Assessment of Cardiovascular fitness in Wheelchair Rugby Athletes: Validation of the 8-loop

Assessment of Cardiovascular fitness in Wheelchair Rugby Athletes: Validation of the 8-loop - PowerPoint Presentation

lily
lily . @lily
Follow
64 views
Uploaded On 2024-01-29

Assessment of Cardiovascular fitness in Wheelchair Rugby Athletes: Validation of the 8-loop - PPT Presentation

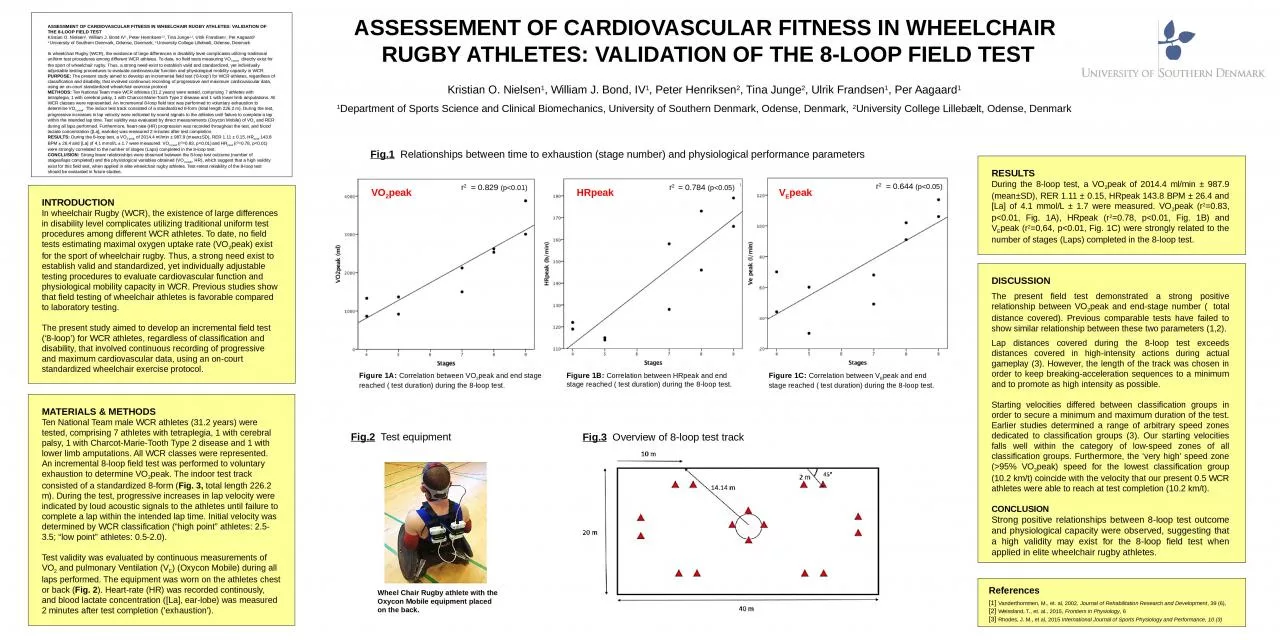
Kristian O Nielsen 1 William J Bond IV 1 Peter Henriksen 12 Tina Junge 12 Ulrik Frandsen 1 Per Aagaard 1 1 University of Southern Denmark Odense Denmark 2 University College Lillebælt Odense Denmark ID: 1042779

athletes test wcr loop test athletes loop wcr field wheelchair rugby vo2 classification lap vo2peak exist fig standardized cardiovascular

Share:

Link:

Embed:

Download Presentation from below link

Download Presentation The PPT/PDF document "Assessment of Cardiovascular fitness in ..." is the property of its rightful owner. Permission is granted to download and print the materials on this web site for personal, non-commercial use only, and to display it on your personal computer provided you do not modify the materials and that you retain all copyright notices contained in the materials. By downloading content from our website, you accept the terms of this agreement.


Presentation Transcript

1. Assessment of Cardiovascular fitness in Wheelchair Rugby Athletes: Validation of the 8-loop FIELD testKristian O. Nielsen1, William J. Bond IV1, Peter Henriksen1,2, Tina Junge1,2, Ulrik Frandsen1, Per Aagaard11 University of Southern Denmark, Odense, Denmark; 2 University College Lillebælt, Odense, DenmarkIn wheelchair Rugby (WCR), the existence of large differences in disability level complicates utilizing traditional uniform test procedures among different WCR athletes. To date, no field tests measuring VO2-peak directly exist for the sport of wheelchair rugby. Thus, a strong need exist to establish valid and standardized, yet individually adjustable testing procedures to evaluate cardiovascular function and physiological mobility capacity in WCR. PURPOSE: The present study aimed to develop an incremental field test (‘8-loop’) for WCR athletes, regardless of classification and disability, that involved continuous recording of progressive and maximum cardiovascular data, using an on-court standardized wheelchair exercise protocol. METHODS: Ten National Team male WCR athletes (31.2 years) were tested, comprising 7 athletes with tetraplegia, 1 with cerebral palsy, 1 with Charcot-Marie-Tooth Type 2 disease and 1 with lower limb amputations. All WCR classes were represented. An incremental 8-loop field test was performed to voluntary exhaustion to determine VO2-peak. The indoor test track consisted of a standardized 8-form (total length 226.2 m). During the test, progressive increases in lap velocity were indicated by sound signals to the athletes until failure to complete a lap within the intended lap time. Test validity was evaluated by direct measurements (Oxycon Mobile) of VO2 and RER during all laps performed. Furthermore, heart-rate (HR) progression was recorded throughout the test, and blood lactate concentration ([La], earlobe) was measured 2 minutes after test completion. RESULTS: During the 8-loop test, a VO2-peak of 2014.4 ml/min ± 987.9 (mean±SD), RER 1.11 ± 0.15, HRpeak 143.8 BPM ± 26.4 and [La] of 4.1 mmol/L ± 1.7 were measured. VO2-peak (r2=0.83, p<0.01) and HRpeak (r2=0.78, p<0.01) were strongly correlated to the number of stages (Laps) completed in the 8-loop test. CONCLUSION: Strong linear relationships were observed between the 8-loop test outcome (number of stages/laps completed) and the physiological variables obtained (VO2-peak, HR), which suggest that a high validity exist for this field test, when applied in elite wheelchair rugby athletes. Test-retest reliability of the 8-loop test should be evaluated in future studies. Materials & MethodsTen National Team male WCR athletes (31.2 years) were tested, comprising 7 athletes with tetraplegia, 1 with cerebral palsy, 1 with Charcot-Marie-Tooth Type 2 disease and 1 with lower limb amputations. All WCR classes were represented. An incremental 8-loop field test was performed to voluntary exhaustion to determine VO2peak. The indoor test track consisted of a standardized 8-form (Fig. 3, total length 226.2 m). During the test, progressive increases in lap velocity were indicated by loud acoustic signals to the athletes until failure to complete a lap within the intended lap time. Initial velocity was determined by WCR classification (“high point” athletes: 2.5-3.5; “low point” athletes: 0.5-2.0).Test validity was evaluated by continuous measurements of VO2 and pulmonary Ventilation (VE) (Oxycon Mobile) during all laps performed. The equipment was worn on the athletes chest or back (Fig. 2). Heart-rate (HR) was recorded continously, and blood lactate concentration ([La], ear-lobe) was measured 2 minutes after test completion ('exhaustion'). DiscussionThe present field test demonstrated a strong positive relationship between VO2peak and end-stage number ( total distance covered). Previous comparable tests have failed to show similar relationship between these two parameters (1,2). Lap distances covered during the 8-loop test exceeds distances covered in high-intensity actions during actual gameplay (3). However, the length of the track was chosen in order to keep breaking-acceleration sequences to a minimum and to promote as high intensity as possible.Starting velocities differed between classification groups in order to secure a minimum and maximum duration of the test. Earlier studies determined a range of arbitrary speed zones dedicated to classification groups (3). Our starting velocities falls well within the category of low-speed zones of all classification groups. Furthermore, the ‘very high’ speed zone (>95% VO2peak) speed for the lowest classification group (10.2 km/t) coincide with the velocity that our present 0.5 WCR athletes were able to reach at test completion (10.2 km/t). CONCLUSIONStrong positive relationships between 8-loop test outcome and physiological capacity were observed, suggesting that a high validity may exist for the 8-loop field test when applied in elite wheelchair rugby athletes. ResultsDuring the 8-loop test, a VO2peak of 2014.4 ml/min ± 987.9 (mean±SD), RER 1.11 ± 0.15, HRpeak 143.8 BPM ± 26.4 and [La] of 4.1 mmol/L ± 1.7 were measured. VO2peak (r2=0.83, p<0.01, Fig. 1A), HRpeak (r2=0.78, p<0.01, Fig. 1B) and VEpeak (r2=0,64, p<0.01, Fig. 1C) were strongly related to the number of stages (Laps) completed in the 8-loop test. References[1] Vanderthommen, M., et. al, 2002, Journal of Rehabilitation Research and Development, 39 (6), [2] Weissland, T., et. al., 2015, Frontiers in Physiology, 6[3] Rhodes, J. M., et al, 2015 International Journal of Sports Physiology and Performance, 10 (3)IntroductionIn wheelchair Rugby (WCR), the existence of large differences in disability level complicates utilizing traditional uniform test procedures among different WCR athletes. To date, no field tests estimating maximal oxygen uptake rate (VO2peak) exist for the sport of wheelchair rugby. Thus, a strong need exist to establish valid and standardized, yet individually adjustable testing procedures to evaluate cardiovascular function and physiological mobility capacity in WCR. Previous studies show that field testing of wheelchair athletes is favorable compared to laboratory testing. The present study aimed to develop an incremental field test (‘8-loop’) for WCR athletes, regardless of classification and disability, that involved continuous recording of progressive and maximum cardiovascular data, using an on-court standardized wheelchair exercise protocol. Assessement of Cardiovascular Fitness In Wheelchair Rugby Athletes: Validation Of The 8-loop Field TestFig.2 Test equipment100 mKristian O. Nielsen1, William J. Bond, IV1, Peter Henriksen2, Tina Junge2, Ulrik Frandsen1, Per Aagaard11Department of Sports Science and Clinical Biomechanics, University of Southern Denmark, Odense, Denmark, 2University College Lillebælt, Odense, DenmarkFig.3 Overview of 8-loop test trackFigure 1B: Correlation between HRpeak and end stage reached (test duration) during the 8-loop test.Figure 1C: Correlation between VEpeak and end stage reached (test duration) during the 8-loop test.Wheel Chair Rugby athlete with the Oxycon Mobile equipment placed on the back. Fig.1 Relationships between time to exhaustion (stage number) and physiological performance parametersFigure 1A: Correlation between VO2peak and end stage reached (test duration) during the 8-loop test.r2 = 0.829 (p<0.01)r2 = 0.784 (p<0.05)r2 = 0.644 (p<0.05)VO2peakHRpeakVEpeak