PDF-epartment/ Agency: Australian Taxation OfficeQuestion: BET Topic13 Fin
Author : lindy-dunigan | Published Date : 2015-08-19
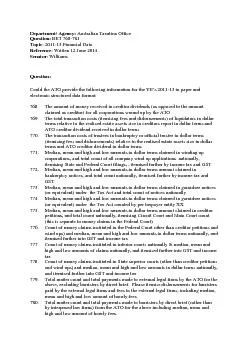
SenateEconomics LegislationCommittee ANSWERS TO QUESTIONS ON NOTICETreasury PortfolioBudget Estimates 20143 June to 5 June 2014Median mean and high and low ages
Presentation Embed Code
Download Presentation
Download Presentation The PPT/PDF document "epartment/ Agency: Australian Taxation O..." is the property of its rightful owner. Permission is granted to download and print the materials on this website for personal, non-commercial use only, and to display it on your personal computer provided you do not modify the materials and that you retain all copyright notices contained in the materials. By downloading content from our website, you accept the terms of this agreement.
epartment/ Agency: Australian Taxation OfficeQuestion: BET Topic13 Fin: Transcript
Download Rules Of Document
"epartment/ Agency: Australian Taxation OfficeQuestion: BET Topic13 Fin"The content belongs to its owner. You may download and print it for personal use, without modification, and keep all copyright notices. By downloading, you agree to these terms.
Related Documents