/
GEOHORIZONS December  Imaging Technique for Minor Faul GEOHORIZONS December  Imaging Technique for Minor Faul

GEOHORIZONS December Imaging Technique for Minor Faul - PDF document

lindy-dunigan
lindy-dunigan . @lindy-dunigan
Follow
386 views
Uploaded On 2015-05-17

GEOHORIZONS December Imaging Technique for Minor Faul - PPT Presentation

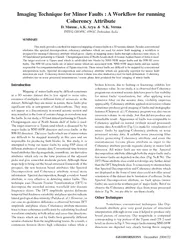
Manna AK Arya NK Verma INTEG GEOPIC ONGC Dehradun India SUMMARY This study provides a method for improved mapping of minor faults in a 3D seismic dataset Besides conventional attributes like spectral decomposition coherency attributes which are us ID: 68539

Manna Arya

Share:

Link:

Embed:

Download Presentation from below link

Download Pdf The PPT/PDF document "GEOHORIZONS December Imaging Technique ..." is the property of its rightful owner. Permission is granted to download and print the materials on this web site for personal, non-commercial use only, and to display it on your personal computer provided you do not modify the materials and that you retain all copyright notices contained in the materials. By downloading content from our website, you accept the terms of this agreement.


Presentation Transcript

Imaging Technique for Minor Faults : A Workflow for runningCoherency AttributeD. Manna , A.K. Arya & N.K. VermaINTEG, GEOPIC, ONGC, Dehradun, India GEOHORIZONS December 2008/23 the seismic section. Minor faults (NW-SE) which run almostin orthogonal direction to the major faults, a few are visibleattribute map (Fig.3), the cross fault in the NW-SE directionwhich is shown by arrow in (Fig. 8a) is not visible clearly.Workflow for processing coherency attribute:Visibility of faults in time slice derived from thenature or the seismic data set is noisy. An introduction ofband pass filter followed by random noise attenuation filterand suitable gain for the seismic data set before runningtrends. A band pass filter is applied for removal of high andlow frequency noises. Filter is chosen such that optimum(Fig.4). A noise reduction filter for eliminating random noiseand preserving useful energy in the data enhanced thesignal strength . As a random noise attenuation procedure, acoherency filter is adopted in this study. This filter shapesthe data within a specified window. Besides coherency filterand looked like synthetic traces. Dip-scan stack filter alsodid not show any improvement in seismic data quality. Showing Workflow of the process in imaging minor faults.Seismic section in the NNE-SSW direction from the dataset.Elliptical portion where a fault can be mapped but it is noteasy sometimes for taking decision to put a fault or notwithout seeing any attribute slice for faults. This fault is (Ormsby) enhanced the signal strength and the data look was alsowhich produced the best output. As the filtering processscales down the amplitude level, an AGC gain was appliedattribute calculation. As the Coherency attribute displaysboundary (Bahorich.et al 1996), fault with a detectable orminor vertical throw generates wave field distortion and inpredict the the similarity. Two options are available one forfour or eight neighboring traces option are available foroutput to the middle sample of the centre trace window. Forsemblance and thus low similarity. A filtered, noise- processed (a) Amplitude spectrum before filtering (b) after filtering (a) DFT Amplitude slice from Spectral Decomposition at the Time slice at 1880 ms. derived by running coherency attribute Fig.7. Similarly, Instantaneous phase and Cosine phasealso generated from acoustic inversion as input and theThe ESP time slices (Refer: Fig..5 -8 ) belong toabove work flow to improve their display. Another set ofNW-SE faults (which are not seen clearly in the normalusing the workflow. The workflow has given improved resultsis a coherency time slice at 1880 ms. from normal seismic andwhich shows improvement over previous one. Similarly, time (a) ESP slice at 1880 ms. of normal amplitude data (b) sameshown in Fig. 8a and Fig. 8b respectively. The cross faultvolume (Fig 6). Although Coherency slices generated fromobserved that the instantaneous phase and cosine phaseattribute calculated from the noise processed data andmore clarity than the Coherency time slice from instantaneousproduce better clarity than instantaneous phase as input toaxes and its value varies between -180° and +180°. As adepicted in the trace from the normal area to the faulted zonephase trace looks oscillatory varying between -1 and +1 likenormal seismic amplitude trace which may be more processed data) as input to ESP3D processing of (b) ESPslice from cosine phase (from noised processed data) as input coherency volume can help reveal minor faults.than that of amplitude volume as input.(Exploration), ONGC and Shri S.K.Das, G.G.M.- Head GEOPICNeves, Farnando A., Zahrani,M.S. and Bremkamp,S.W.,2004