PDF-Interpretation of the Correlation Coefficient A Basic Review RICHARD TAYLOR EDD RDCS A
Author : lindy-dunigan | Published Date : 2014-12-13
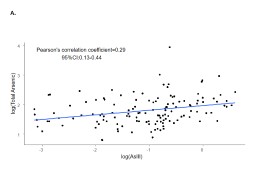
One of the more frequently reported statistical methods involves correlation analysis where a correlation coefficient is reported representing the degree of linear
Presentation Embed Code
Download Presentation
Download Presentation The PPT/PDF document "Interpretation of the Correlation Coeffi..." is the property of its rightful owner. Permission is granted to download and print the materials on this website for personal, non-commercial use only, and to display it on your personal computer provided you do not modify the materials and that you retain all copyright notices contained in the materials. By downloading content from our website, you accept the terms of this agreement.
Interpretation of the Correlation Coefficient A Basic Review RICHARD TAYLOR EDD RDCS A: Transcript
Download Rules Of Document
"Interpretation of the Correlation Coefficient A Basic Review RICHARD TAYLOR EDD RDCS A"The content belongs to its owner. You may download and print it for personal use, without modification, and keep all copyright notices. By downloading, you agree to these terms.
Related Documents