PDF-Percentage of undernourished people
Author : lindy-dunigan | Published Date : 2015-11-24
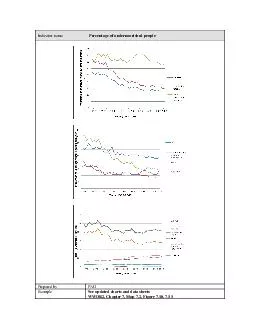
Indicator name Prepared by FAO Example See updated charts and data sheets WWDR2 Chapter 7 Map 72 Figure 710 711 Rationale The proportion of undernourished people
Presentation Embed Code
Download Presentation
Download Presentation The PPT/PDF document "Percentage of undernourished people" is the property of its rightful owner. Permission is granted to download and print the materials on this website for personal, non-commercial use only, and to display it on your personal computer provided you do not modify the materials and that you retain all copyright notices contained in the materials. By downloading content from our website, you accept the terms of this agreement.
Percentage of undernourished people: Transcript
Download Rules Of Document
"Percentage of undernourished people"The content belongs to its owner. You may download and print it for personal use, without modification, and keep all copyright notices. By downloading, you agree to these terms.
Related Documents