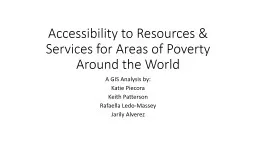
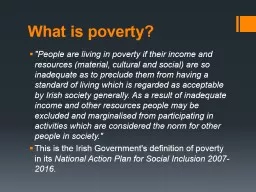
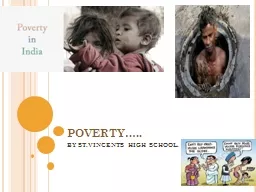
Around the World A GIS Analysis by Piecora Patterson Ledo Massey amp Alverez No opportunity to better ones life Limited Education Limited Health Care No Surviving Dignity Low Sanitation ID: 652456
Download Presentation The PPT/PDF document "Poverty Accessibility to Resources &..." is the property of its rightful owner. Permission is granted to download and print the materials on this web site for personal, non-commercial use only, and to display it on your personal computer provided you do not modify the materials and that you retain all copyright notices contained in the materials. By downloading content from our website, you accept the terms of this agreement.
Slide1
Poverty
Accessibility to Resources & Services
Around the World
A GIS Analysis by:
Piecora
, Patterson,
Ledo
-Massey &
AlverezSlide2
No opportunity to better one’s life
Limited Education
Limited Health Care
No Surviving Dignity
Low Sanitation
Lack of Basic Goods
Lack of Basic Services
Inadequate Physical Security
No Voice
Low Income
Lack of Clean Water
DEPRIVATION IN WELL-BEINGSlide3
Many countries have more people living in extreme poverty than above the poverty line
Problem
0
%
1-16
%
17-23
%
24-30
%
31-42
%
43-57
%
58-88
%Slide4
Areas of Poverty
= Lowest access to services needed for “Wellbeing”
HypothesisSlide5
Scope
Evaluation of basic resources and services in high poverty areasSlide6
Creating New Agriculture Indicator
Join
Join “Country Name” field for World shapefile and Agricultural excel file
Export
Percentage of Agricultural Lands Shapefile
Export new joined table as a new shapefile named Percentage of Agricultural Lands
A
B
Shapefile:
New Indicator Boundary (World)
Excel File:
Percentage of Agricultural Lands (World Bank)
Clean Excel file to match world shapefileSlide7
Agricultural Land Indicator
Food
0
1-15
16-26
27-39
40-52
53-65
66-82Slide8
Primary Education
Male & Female Literacy
Male
Female
0
1-41
42-65
66-82
83-89
90-95
96-100Slide9
Health Care
Life Expectancy
0
1-56
57-65
66-71
72-75
76-79
80-83Slide10
Objectives
5
maps
to analyze relationships between
3 indicators
and
% of povertySlide11
Development of Indicators
Parcels
Acquire Parcels (.
shp)Percentage in PovertyPercentage of Agricultural lands
Parcels
Acquire Parcels (.
shp
)
Percentage in Poverty
Male Literacy
Female Literacy
Parcels
Acquire Parcels (.
shp)Percentage in PovertyLife Expectancy
Union
Union
Union
Union Percentage in Poverty with Percentage of Agricultural lands using the “Country” field
Reclassify
Food Map
Education Map
Healthcare Map
Union Percentage in Poverty with literacy rates of male and female using the “Country” field
Union Percentage in Poverty with Life Expectancy using the “Country” Field
Reclassify
Symbology
ranges to contain 6 classes and change color to green
Reclassify
Symbology
ranges to contain 6 classes and change color to
b
lue
Reclassify
Symbology
ranges to contain 6 classes and change color to orange
Reclassify
ReclassifySlide12
Agriculture Percentage & Poverty
0
1
2
3
4
5
6Slide13
Life Expectancy & Poverty
0
1
2
3
4
5
6Slide14
Literacy & Poverty
0
1
2
3
4
5
6Slide15
Development of Overall Map
Parcels
Acquire Parcels (.
shp)Percentage in PovertyPercentage of Agricultural Lands
Literacy Rates (Female/Male)
Life Expectancy
Union
Overall Map
Union Overall Map =
PercofPoverty
+
PercofAg
+
FemaleLiteracy
/MaleLieracy+LifeExpectancy
Reclassify Symbology
ranges to contain 6 classes and change color to grey
ReclassifySlide16
All Indicators + Poverty
0
1
2
3
4
5
6Slide17
Conclusion
POVERTY
HEALTH
CARE
PRIMARY
EDUCATION
FOOD
low %
high %
Hypothesis
SupportedSlide18
a
nd the
poverty cycle
goes on …