/
U.S. DEPARTMENT EDUCATION ER 2013NCES U.S. DEPARTMENT EDUCATION ER 2013NCES

U.S. DEPARTMENT EDUCATION ER 2013NCES - PDF document

lindy-dunigan
lindy-dunigan . @lindy-dunigan
Follow
384 views
Uploaded On 2015-11-12

U.S. DEPARTMENT EDUCATION ER 2013NCES - PPT Presentation

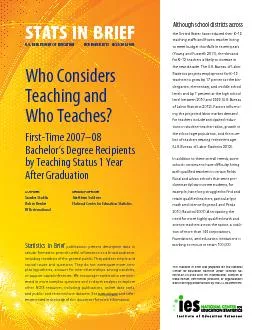
STATS BRIEF Who Considers Teaching and Who Teaches First Time 2007 Bachelor146s Degree Recipi ents by Teaching Status 1 Year A fter Graduation AUTHOR S Sandra Staklis Robin Henke RTI Internat ID: 190831

STATS BRIEF Who Considers Teaching and

Share:

Link:

Embed:

Download Presentation from below link

Download Pdf The PPT/PDF document "U.S. DEPARTMENT EDUCATION ER 2013NCES" is the property of its rightful owner. Permission is granted to download and print the materials on this web site for personal, non-commercial use only, and to display it on your personal computer provided you do not modify the materials and that you retain all copyright notices contained in the materials. By downloading content from our website, you accept the terms of this agreement.


Presentation Transcript

STATS BRIEF U.S. DEPARTMENT EDUCATION ER 2013NCES Who Considers Teaching and Who Teaches? First Time 2007 Bachelor’s Degree Recipi ents by Teaching Status 1 Year A fter Graduation AUTHOR S Sandra Staklis Robin Henke RTI International PROJECT OFFICERMatthew Soldner National Center for Education Statistics Statistics in Brief publications present descriptive data in tabular formats to provide useful information to a broad audience, including members of the general public. Th ey address simple and topical issues and questions. They do not investigate more co m- plex hypotheses, account for inter - relationships among variables, or support causal inferences. We encourage readers who are inte r- ested in more complex questions and in dep th analysis to explore other NCES resources, including publications, online data tools, and public - and restricteduse datasets. See nces.ed.gov and refe r- ences noted in the body of this document for more information. This Statistics in Brief was prepared for the National Center for Education Statistics under Contract No. ED ED-with RTI International . Mention of trade names, commercial products, or organizations does not im ply endorsement by the U.S. Government. Although school districts acrossthe United States have reduced their Kteaching staffs and frozen teacher hiing to meet budget shortfalls in recent years (Young and Fusarelli 2011), the dmand for K12 teachers is likely to increase in the next decade. The U.S. Breau of Labor Statistics projects employment for Kteachers to grow by 17 percent at the kidergarten, eemetary, and middle school levels and by 7 percent at the high school level between 2010 and 2020 (U.S. Bureau of Labor Sttics 2012). Factors influening the projected labor market demand for teachers include anticipated redutions in studentteacher ratios, growth in the schoolage population, and the ber of teachers nearing retirment age (U.S. Breau of Labor Statistics 2012).In addition to these overall trends, some schools continue to have difficulty hiring wellqualified teachers in certain fields. Rural and urban schools thatserve prdominantly lowincome students, for example, have long struggled to find and retain qualified teachers, particularly in math and science (Ingersoll and Perda 2010; Bacolod 2007). Anticipating the need for more highly qualified math and science teachers across the nation, a coali-tion of more than 100 corporations,foundations, and education institutions is working to recruit or retain 100,000 2 ath and science teachers over the next 10 years(100Kin10: Answering the Nation’s Call). Teacher recruitment strategies have also targeted individuals from specific racial and ethnic groups, an approach that reflects research suggesting that a more diverse teaching force may allay teacher shortages in urban schools that struggle to attract qualified teachers (Achinstein et al. 2010). Researchers have also found improved educational outcomes for studentsincluding higher scores on standardized tests, lower dropout rates, and higher rates of college enrollmentwho are taught by teachers of the same race or ethnicTeacher retention is also higher among teachers whose racial and etnicbackgrounds match those of their students in hardstaff and disadvataged urban schools with low proportions of White students than amongWhite teachers in the same seting (Scafidi, Sjoquist, and Stinebrickner 2007; Elfers, Plecki, and Knapp 2006). Recruitment efforts also work to increase the share of male teachers, which has declined from about onethird of the teaching force in 1980 to about onequarter in 200708 (Ingersoll and Merrill 2010).The college graduates who will meet the need for teachers may do so at vaious points in their postcollege cree. While many teachers begin their careers immediately after copleting their bachelor’s degree, some gradates prepare for and enter the profession following 1 or more years in another career (Anderson 2008; Provasnik and Dorfman 2005).Some of these later entrants may have cosidered teaching while undergraduates or shortly after graduation. In fact, among 199293 bachelor’s degree rcipients who had not taught or prepared to teach 1 year after compleing their degrees, about 21 percent of those who reported considering teacing had prepared to teach and taught by 2003, 10 years later. In contrast, 4 percent of those who had not cosidered teaching 1 year after graduation had taught by 2003 (Alt and Henke 2007). Potential teachers therefore also include graduates woring in another career who may have prepared for or expressed an interest in teaching. The need for more teachers, especially math and science teachers, therefore, raises questions concerning new college graduates’ experience in teaching and inclinations toward teaching in the future. For example, what percentage of graduates prepare to teach but do not enter teaching immediately after graduation? Among graduates who are not prepared to teach, how many consider teaching?Furthermore, what distinguishes these groups fro each other? For example, some researchers and policymakers have feared that the burden of repaing student loan debt may discourage college graduates from teaching creers because teachers receive lower pay relative to college graduates in other occupations (Rothstein and Rouse 2011). Thus, the question of whether graduates with less education debt teach, prepare, or consider teaching relatively more often than graduates with more debt is important to address.To provide national data relevant to these concerns, this Statistics in Brief compares four groups of 08 firsttime bachelor’s degree recipients, dfined by K12 teaching status as follows:Taught before or after earning a bachelor’s degree: Includes bachlor’s degree recipientswho taughtat the K12 level by 2009.Teachingincludes holding a regular full- or parttime teaching job, working as a long- or shortterm substitute teacher, or working as a teacher’s aide, all at the K12 level.Prepared to teach: Includes bachlor’s degree recipientswhohad not taught by 2009 but had takencoures to prepare for teaching, completed student teaching, or were certified to teach at the K12 level. For more information on this initiative, see the 100Kin10 wesite at http://www.100kin10.org/ (accessed 11/1/12).See reviews by Ingersoll and May (2011b) and Villegas and Irvine (2010).See Ingersoll and May (2011b) for a description of these inititives. According to Villegas and Davis (2008), 36 states have adopted policies aimed at increasing the racial and ethnic dversity of teachers since the early 1990s. In this Brief, college graduatesare graduates of 4year postsecondary institutions who attained a bachelor’s degree. Note that graduates who taught may have done so at any time before or since receivingtheir bachelor’s degree and may not have been teaching at the time of the 2009 interview.For courses, respondents were asked to selfreport whether they had taken any courses to prepare for teaching 3 Considered teaching: Includes bachelor’s degree recipients who reported that they were currently considering teaching in 200708 or 2009 (or both years) but did not teach or prepare to teach (as dfined above).Did not consider teaching: Includes bachelor’s degree recipients who did not teach or prepare to teach and did not report that they had considered teaching by 2009.The findings are based on data from the firstollowup of the 2008 Bacclaureateand Beyond Longitudinal Study (B&B:08/09), which collected iformation on the enrollment and employment experiences of a national sample of 200708 bachelor’s degree recipients in their last year as undegraduates and 1 year after they completed their degrees.In both 200708 and 2009, study respondents were asked if they had taught, had prepared to teach, or were considering a career in K12 teaching.In addition, the data used in this Brief include formation collected in 2009 on graduates’ undergraduate programs and borrowing and their salaries and job satisfaction. All comparisons of etimates were tested for statistical significance using the Student’s tistic, and all differences cited are statistically significant at the .05 level. Considering teaching likely encompasses a range ofinterest levels, but the data do not distinguish between respondents with passing interest in the field and those who intend to pusue this interest. In 200708, respondents who had not taught at the K12 level were asked if they were currently considering teaching at this level at a public, private, or parochial school. In 2009, rspondents who had not taught or prepared to teach at the K12 level were asked if they were currently considering a career in teaching at this level.No adjustments for multiple comparisons were made. The standard errors for the estimates can be found at http://nces.ed.gov/pubsearch/pubsinfo.asp?pubid=2014002 . 4 STUDY QUESTIONS 1 How do selected demographic and academic characteristics differ among college graduates who taught, prepared to teach, considered teaching, and did not consider teaching? 2 Do college graduates who taught, prepared to teach, considered teaching, and did not consider teaching differ in terms of their undergraduate borrowing and indebtedness and their salaries and job satisfaction? KEY FINDINGS College graduates who considered teaching were more often male than students who taught before or after earning their bachelor’s degree or who prepared to teach. The reprsentation of Black and Hispanic graduates was higher among those who considered teaching than among those who taught before or after earning their bachelor’sdegree.cience, technology, engineering, and math (STEM) majors accounted for a higher proportion of those who considered teaching than those who prepared to teach or taught before or after earning their bachelor’s degree. The highest prportion of STEMmajors, however, was found among graduates who did not consider teaching.Regardless of when they taught, lege graduates who taught bfore or after earning their bachelor’s degree earnedhigher median anual incomes in 2009 than those who were not teaching but consiered or prepared for teaching. No measurable difference was found between the median incomes of those who taught and did not cosider teaching. Again, regardless of when they taught, college graduates who taught before or after earning their bachelor’s degree reported higher overall job satisfaction and satisfation with their compensation than those who prepared for or consiered teaching but had not taught. Those who taught also reported higher overall job satisfaction than graduates who did not consider teaching. 5 1 How doselected demographic and academic characteristics differ amongcollege graduates who taught, prepared to teach, considered teaching, and did not consider teaching? In 2009, about 10 percent of 2007firsttime bachelor’s degree recipients had taught at the K12 level after earing their degree, and 1 percent reported teaching only before they earned their degree.In addition to the graduates with teaching experence, another 7 percent had taken steps toward preparing for teaching, and 15 percent reported considering teaching in 200708 or 2009 (figure 1).The gender balance and race/ethnicity of these three groups differed from each other and from the 68 percent of bachelor’s degree recipients who dinot consider teaching. Because firsttime bachelor degree recipientswho taught only before earning their degree account for about 1 percent of all undergraduates (or about 8 percent of those who taught), the two groups are combined hereafter to ensure a sufficiently large enough group for analysis. FIGURE 1. TEACHING STATUS Percentage distribution of 200708 firsttime bachelor’s degree recipients, by teaching status: 2009 Only before bachelor’s degreeSincebachelor’s degreePrepared to teachConsidered teaching,but did not prepare or teachDid not consider,prepare, or teach 68 1 10 Taught NOTE: Taughtincludes bachelor’s degree recipients who held K12 teaching jobs, worked as shortterm substitutes, or worked as teacher’s aides before or after completing their degree. Prepared to teachincludes bachelor’s degree recipients who took courses to prepare for teaching at the K12 level, completed student teaching, or were certified to teach at the K–12 level but had not taught. Considered teaching, but did not prepare or teachincludes bachelor’s degree recipients who reported that they were currently considering teaching in 200708 or 2009 but had not prepared to teach or taught by 2009. Did not consider, prepare, or teach includes bachelor’s degree recipients who had not prepared to teach, taught, or reported considering teaching in 200708 or 2009. Detail may not sum to totals because of rounding. Estimates include students enrolled in Title IV eligible postsecondary institutions in the 50 states, the District of Columbia, and Puerto Rico.Standard error tables are available at http://nces.ed.gov/pubsearch/pubsinfo.asp?pubid=2014002 . SOURCE: U.S. Department of Education, National Center for Education Statistics, 2008/09 Baccalaureate and Beyond Study (B&B:08/09). 6 GENDER AND RACE/ETHNICITYTeaching has long been a predomnantly female profession(Tyack and Hansot 1992), and more than onehalf of all students earning bachelor’s dgrees have been women since the 1980s (Goldin, Katz, and Kuziemko 2006). Consistent with these findings, women made up the majority of all fourstudy groups in the analysis, but they represented a larger share ofthose whotaught (77 percent)or prpared to teach (69 percent)than of those who considered (58 percent) or didnotconsider teaching (54 percent) (figure 2). FIGURE 2 . PERCENT WOMEN Percentage of women among 200708 firsttime bachelor’s degree recipients, by teaching status: 2009 58 77 69 58 0 All undergraduates Taught Prepared to teach Considered teaching,but did not prepare or teach Did not consider, prepare, or teachPercent NOTE: Taughtincludes bachelor’s degree recipients who held K12 teaching jobs, worked as shortterm substitutes, or worked as teacher’s aides before or after completing their degree.Prepared to teachincludes bachelor’s degree recipients ho took courses to prepare for teaching at the K12 level, completed student teaching, or were certified to teach at the K–12 level but had not taught. Considered teaching, but did not prepare or teachincludes bachelor’s degree recipients who reported that they were currently considering teaching in 200708 or 2009 but had not prepared to teach or taught by 2009. Did not consider, prepare, or teachincludes bachelor’s degree recipients who had not prepared to teach, taught, or reported considering teachingin 200708 or 2009. Estimates include students enrolled in Title IV eligible postsecondary institutions in the 50 states, the District of Columbia, and Puerto Rico.Standard error tables are available at http://nces.ed.gov/pubsearch/pubsinfo.asp?pubid=2014002 . SOURCE: U.S. Department of Education, National Center for Education Statistics, 2008/09 Baccalaureate and Beyond Study (B&B:08/09). 7 Although the share of America’s public school children who are White has dclined over time, similar changes have not occurred among teachers (Ingersoll and May 2011a; Achinstein et al. 2010). In the 200708 school year, about 83 percent of fulltime teachers in Kpublic schools were White, compared with about 56 percent of students (Aud et al. 2011). Among 2008 bachelor’s degree recipients in 2009, White grauates accounted for 79 percent of those who taught before or after earing their bachelor’s degrees, but smaller proportions of the other groups (figure 3). Among the four groups compared, the highest propotion of Black college graduateswas found among those who considered teaching (14 percent), and the highest proportion of Hispanic college gradates was found among those who prepared for or considered teaching (about 12 percent each). In contrast, sian college graduates represented a higher percentage of those who did not consider teaching (7 percent) than of those who taught or prepared to teach (2 and 3 percent, respectively). FIGURE 3 . RACE/ETHNICITY Percentage distribution of 200708 firsttime bachelor’s degree recipients’ race/ethnicity, by teaching status: 2009 9 7 7 8 8 9 6 2 3 5 7 0 Percent White Black Hispanic Asian Other or Twoor more races 3 4 4 4 3 All undergraduatesTaughtPrepared to teachConsidered teaching, but did not prepare or teachDid not consider,prepare, or teach NOTE: Taughtincludes bachelor’s degree recipients who held K12 teaching jobs, worked as shortterm substitutes, or worked as teacher’s aides before or after completing their degree. Prepared to teachincludes bachelor’s degree recipients who took courses to prepare for teaching at the K12 level, completed student teaching, or were certified to teach at the K–12 level but had not taught. Considered teaching, but did not prepare or teachincludes bachelor’s degree recipients who reported that they were currently considering teaching in 200708 or 2009 but had not prepared to teach or taught by 2009. Did not consider, prepare, or teachincludes bachelor’s degree recipients who had not prepared to teach, taught, or reported considering teaching in 200708 or 2009. Black includes African American and Hispanic includes Latino. Other includes American Indian or Alaska Native and Native Hawaiian or other Pacific Islander. Detail may not sum to totals bcause of rounding. Estimates include students enrolled in Title IV eligible postsecondary institutions in the 50 states, the District of Columbia, and Puerto Rico.Standard error tables are available at http://nces.ed.gov/pubsearch/pubsinfo.asp?pubid=2014002 . SOURCE: U.S. Department of Education, National Center for Education Statistics, 2008/09 Baccalaureate and Beyond Study (B&B:08/09). 8 ACADEMIC PREPARATIONA number of current national initiatives, including Teach for America and 100Kin10, seek to attract wellqualified college graduates to teaching, particlarly in STEM fieldssearch ggestshat teachers’ undergraduate prepartion, including taking courses in fields they teach and earning higher cumtive undergraduate grade point averages (GPA), can affect student oucomes (Jacob et al. 2011; KuklaAcevedo 2009). Therefore, this analysis examined four indicators of undergraduate acdemic preparation: cumulative GPA, major field of study, and the number of credits earned in math and in science. In general, proportionately more of those who taught or prepared to teach earned cumulative GPAs of at least 3.0 and mjored in education than those who considered teaching. As detailed below, however, a relatively greater share of those who did not consider teaching earned credits in calculus or advanced math and advanced laboratory science credits than the other three groups.CumulativeTeachers’ cumulative undergraduate GPAs, both overall and in teacher preparation programs, have been postively linked to teacher performance (see D’Agostino and Powers 2009 for a review).Among graduates who taught, about onehalf (47 percent) earned cumulative GPAs of 3.50 or higher, and another 36 percent earned between 3.00 and 3.49 (figure 4).Relatively fewer of those who prepared for, considered, or did not consider teachingearned GPAs of 3.50 or higher. For example, about 27 percent of those who considered teaching had a GPA of 3.50 or higher, as did 37 percent of those who did not consider, prepare, or teach. The proportion of graduates who earned GPAs of less than 2.50 was higher among those who considered teaching (10 percent) than among those who prepared to teach or taught (45 percent). GPAs vary, however, across institutions and by majors witin institutions, and findings regarding GPAs should therefore be interpreted with caution (see also Henkeet al.2005). For more information about these initiatives, see http://www.teachforamerica.org/ and http://www.100kin10.org/ . GPAs are measures of graduates’ aptitudes and the skills they gained in college. Because grades are assigned without reference to an objective standard, they can vary by instructor and by mjor field of study. For a discussion on the limitations of using GPA as a measure of academic preparation, see Alt and Henke (2007). FIGURE 4 . CUMULATIVE UNDERGRADUATE GRADE POINT AVERAGE (GPA)Percentage distribution of 208 firsttime bachelor’s degree recipients’ cumulative undergraduate GPA, by teaching status: 2009 7 4 5 7 0 Percent Less than 2.50 2.502.99 3.003.49 3.50 or higherAll undergraduatesTaughtPrepared to teachConsidered teaching, but did not prepare orteachDid not consider, prepare, or teach NOTE: Taughtincludes bachelor’s degree recipients who held K12 teaching jobs, worked as shortterm substitutes, or worked as teacher’s aides before or after completing their degree. Prepared to teachincludes bachelor’s degree recipients who took courses to prepare for teaching at the K12 level, completed student teaching, or were certified to teach at the K–12 level but had not taught. Considered teaching, but did not prepare or teachincludes bachelor’s degree recipients who reported that they were currently considering teaching in 200708 or 2009 but had not prepared to teach or taught by 2009. Did not consider, prepare, or teachincludes bachelor’s degree recipients who had not prepared to teach, taught, or reported considering teaching in 200708 or 2009. Detailmay not sum to totals because of rounding. Estimates include students enrolled in Title IV eligible postsecondary institutions in the 50 states, the District of Columbia, and Puerto RicoStandard error tables are available at http://nces.ed.gov/pubsearch/pubsinfo.asp?pubid=2014002 . SOURCE: U.S. Department of Education, National Center for Education Statistics, 2008/09 Baccalaureate and Beyond Study (B&B:08/09). 9 Undergraduate MajorEducation is a common major among teachers, but not all teachers major in education as undergraduates. Onehalf of those who taught and 22 percent of those who prepared to teach majored in education, compared with about 5 percent of those who considered teaching (figure 5). SM majors acounted for 8 percent of graduates who taught or prepared to teach and 12 percent of those who considered teaching, compared with 18 percent of those who did not consider teaching. FIGURE 5 . UNDERGRADUATE MA JOR Percentage distribution of 200708 firsttime bachelor’s degree recipients’ undergraduate majors, by teaching status: 2009 8 5 1 8 8 7 3 5 8 0 Percent Education STEM Social sciences and psychology Health OtherAll undergraduatesTaughtPrepared to teachConsidered teaching, but did notprepare or teachDid not consider, prepare, or teach ! Interpret data with caution. Estimate is unstable because the standard error represents more than 30 percent of the estimate.Includes majors in K12 teaching and other education fields, such as counseling, curriculum and instruction, and eduction administration.STEM (science, technology, engineering, and math) majors include computer and information systems, math, engineeing, life scientists, and physical science.Other includes agriculture and natural resources; general studies and other; humanities; history; personal and consumer services; manufacturing, construction, repair, and transportation; military technology and protective services; business; architecture; communications; public administration and human services; design and applied arts; law and legal studies; library sciences; and theology and religious vocations.NOTE: Taughtincludes bachelor’s degree recipients who held K12 teaching jobs, worked as shortterm substitutes, or worked as teacher’s aides before or after completing their degree. Prepared to teachincludes bachelor’s degree recipients who took courses to prepare for teaching at the K12 level, completed student teaching, or were certified to teach at the K–12 level but had not taught. Considered teaching, but did not prepare or teachincludes bachelor’s degree recipients who reported that they were currently considering teaching in 200708 or 2009 but had not prepared to teach or taught by 2009. Did not consider, prepare, or teachincludes bachelor’s degree recipients who had not prepared to teach, taught, or reported considering teaching in 200708 or 2009. Detail may not sum to totals because of rounding. Estimates include students enrolled in Title IV eligible postsecondary institutions in the 50 states, the District of Columbia, and Puerto RicoStandard error tables are available at http://nces.ed.gov/pubsearch/pubsinfo.asp?pubid=2014002 . SOURCE: U.S. Department of Education, National Center for Education Statistics, 2008/09 Baccalaureate and Beyond Study (B&B:08/09). 10 Math and Science CoursetakingIn addition to majoring in a STEM field, prospective teachers might also prpare for teaching math or science by taking courses in these subjects as udergraduates.About 64 percent of graduates who taught, considered teaching, or did not consider teaching earned credits in collegelevel math, comparedwith 57 percent of those who prepared to teach (figure 6).higher proportion of those who did not consider teaching earned credits in calculus and advanced math courses (37 percent) than among those who taught (25 percent), prepared to teach (20 percent), and considered teaching (27 percent). Collegelevelmathematics and calculus and advanced math are mutually exclusive categories, as are science and advanced laboratory science.The classification of Instructional Programs (CIP) course numbers included in each variable can be found in the B&B:09 PowerStats. For more information about how colege courses are classified, see the 2010 College Course Map (CCM:2010) at http://nces.ed.gov/surveys/pets/ccm.asp . FIGURE 6 . UNDERGRADUATE MATH CREDITS Percentage of 200708 firsttime bachelor’s degree recipients who earned undergraduate credits in collegelevel math and in calculus and advanced math, by teaching status: 2009 64 64 57 63 64 33 25 20 27 0 All undergraduatesTaughtPrepared to teachConsidered teaching, but did not prepare or teachDid not consider, prepare, or teachPercent Earned credits incollegelevel math Earned credits in calculusand advanced math Collegelevel mathematics and calculus and advanced math are mutually exclusive categories.The Classification of Instructional Programs (CIP) course numbers inluded in each variable can be found in the B&B:09 PowerStats. For more information about how college courses are classified, see the 2010 College Course Map (CCM:2010) at http://nces.ed.gov/surveys/pets/ccm.asp . NOTE: Taughtincludes bachelor’s degree recipients who held K12 teaching jobs, worked as shortterm substitutes, or worked as teacher’s aides before or after completing their degree. Prepared to teachincludes bachelor’s degree recipients who took courses to prepare for teaching at the K12 level, completed student teaching, or were certified to teach at the K–12 level but had not taught. Considered teaching, but did not prepare or teachincludes bachelor’s degree recipients who reported that they were currently considering teaching in 200708 or 2009 but had not prepared to teach or taught by 2009. Did not consider, prepare, or teachincludes bachelor’s degree recipients who had not prepared to teach, taught, or reported considering teaching in 200708 or 2009. Estimates include students enrolled in Title IV eligible postsecondary institutions in the 50 states, the District of Columbia, and Puerto Rico.Standard error tables areavailable at http://nces.ed.gov/pubsearch/pubsinfo.asp?pubid=2014002 . SOURCE: U.S. Department of Education, National Center for Education Statistics, 2008/09 Baccalaureate and Beyond Study (B&B:08/09). 11 More than80 percent of graduates in each of the comparison groupearned undergraduate credits in science (fiure 7).However, about 41 percent of those who had not considered teacing and 38 percent of those who prepared to teach earned credits in avanced laboratory sciences, a higher proportion than among those who taught (33 percent) or considered teaching (34 percent). Among college graduates who earned credits in math and science, no measurable difference was found between those who taught and those who prepared to teach in the median number of credits earned (table 1). Medians rather than meansare reported throughout this study to minimize the influence of a small number of extremely low or high values, or outliers, on the estimates. FIGURE 7 . UNDERGRADUATE SCIENCE CREDITS Percentage of 200708 firsttime bachelor’s degree recipients who earned undergraduate credits in science and in advanced laboratory science, by teaching status: 2009 84 89 87 83 84 39 33 38 34 0 All undergraduatesTaughtPrepared to teachConsidered teaching, but did not prepare or teachDid not consider, prepare, or teachPercent Earned credits in science Earned credits in advancedlaboratory science Science and advanced laboratory scienceare mutually exclusive categories. The Classification of Instructional Programs (CIP)course numbers included in each variable can be found in the B&B:09 PowerStats. For more information about how college courses are classified, see the 2010 College Course Map (CCM:2010) at http://nces.ed.gov/surveys/pets/ccm.asp . NOTE: Taughtincludes bachelor’s degree recipients who held K12 teaching jobs, worked as shortterm substitutes, or worked as teacher’s aides before or after completing their degree. Prepared to teachincludes bachelor’s degree recipients who took courses to prepare for teaching at the K12 level, completed student teaching, or were certified to teach at the K–12 level but had not taught. Considered teaching, but did not prepare or teachincludes bachelor’s degree recipients whreported that they were currently considering teaching in 200708 or 2009 but had not prepared to teach or taught by 2009. Did not consider, prepare, or teachincludes bachelor’s degree recipients who had not prepared to teach, taught, or reported considering teaching in 200708 or 2009. Estimates include students enrolled in Title IV eligible postsecondary institutions in the 50 states, the District of Columbia, and Puerto Rico.Standard error tables are available at http://nces.ed.gov/pubsearch/pubsinfo.asp?pubid=2014002 . SOURCE: U.S. Department of Education, National Center for Education Statistics, 2008/09 Baccalaureate and Beyond Study (B&B:08/09). 12 TABLE 1. NUMBER OF CREDITS EARNED edian number of credits earned incollegelevel math, calculus andadvanced math, science, and advanced laboratory science among 08 firsttime bachelordegree recipients who earned undergraduate creditsin these subjects, by teaching status: 2009 Course type 1 All under graduates Taught Prepared to teach C onsidered teaching, but did not prepare or teach Did not consider prepare, or teach College - level math 3.7 3.8 3.0 3.0 3.8 Calculus and advanced math 4.0 5.0 4.0 3.8 4.8 Science 8.0 7.5 7.8 7.0 8.0 Advanced laboratory science 4.2 3.8 3.0 4.0 5.4 Collegelevel mathematics and calculus and advanced math are mutually exclusive categories, as are science and advanced laboratory science. The Classification of Instructional Programs (CIP) course numbers included in each variable can be found in the B&B:09 PowerStats. For more information about how college courses are classified, see the 2010 College Course Map (CCM:2010) at http://nces.ed.gov/surveys/pets/ccm.asp . NOTETaughtincludes bachelor’s degree recipients who held K12 teaching jobs, worked as shortterm substitutes, or worked as teacher’s aides before or after completing their degree.Prepared to teachincludes bachelor’s degree recipients who took courses to prepare for teaching at the Klevel, completed student teaching, or were certified to teach at the K–12 level but had not taught. Considered teaching, but did not prepare or teachincludes bachelor’s degree recipients who reported that they were currently considering teaching in 200708 or 2009but had not prepared to teach or taught by 2009. Did not consider, prepare, or teachincludes bachelor’s degree recipients who had not prepared to teach, taught, or reported considering teaching in 200708 or 2009.Estimates include students enrolled in Title IV eligible postsecondary institutions in the 50 states, the District of Columbia, and Puerto Rico.Standard error tables are available at http://nces.ed.gov/pubsearch/pubsinfo.asp?pubid=2014002 . SOURCE: U.S. Department of Education, National Center for Education Statistics, 2008/09 Baccalaureate and Beyond Study (B&B:08/09). 13 2 Do college graduates who taught, prepared to teach, considered teaching, and did not consider teaching differ in terms of their undergraduate borrowing and indebtedness and their salaries and job satisfaction ? UNDERGRADUATE BORROWING AND STUDENT LOAN DEBUndergraduate borrowing and student loan debt have been associated with the occupation choices that students make while enrolled and after gradution. For example, studies have found that recent graduates with relatively large student loan debt are less likely to work in comparatively lowpaying jobs, particularly in education, than are graduates with lower levels of student loan debt (Rothstein and Rouse 2011;Minicozzi 2005). While the analysis icluded in this Briefcannot examine the effects of graduates’ borrowing and debt levels on their careerchoices, it looks atthe association between borowing teacher status. Forexample, among 200708 graduates, about percent of graduateswhotaught,prepared to teach,or considered teacing had borrowed for their udergraduate education, compared withabout 64 percent of those who never considered teaching (figure 8). While borrowing rates differed, no statistical-ly significant differences were found in the median amounts owed in 2009 among the four groups. FIGURE 8 . UNDERGRADUATE BORROWING AND AMOUNT OWED Percentage of 200708 firsttime bachelor’s degree recipients who took out undergraduate loans and, among those who borrowed for their undergraduate education, the median amount owed, by teaching status: 66 68 69 71 0 All undergraduatesTaughtPreparedto teachConsidered teaching, but did not prepare or teachDid not consider, prepare, or teachPercent$20,100$20,000$20,900$22,300$20,000 NOTE: Excludes graduates who were not working for pay in 2009. Taughtincludes bachelor’s degree recipients who held K–12 teaching jobs, worked as shortterm substitutes, or worked as teacher’s aides before or after completing their degree. Prepared to teachincludes bachelor’s degree recipients who took courses to prepare for teaching at the K12 level, completed student teaching, or were certified to teach at the K12 level but had not taught. Considered teaching, but did not prepare or teachincludes bachelor’s degree recipients who reported that they were currently considering teaching in 08 or 2009 but had not prepared to teach or taught by 2009. Did not consider, prepare, or teachincludes bachelor’s degree recipients who had not prepared to teach, taught, or reported considering teaching in 200708 or 2009. Estimates include students enrolled in Title IV eligible postsecondary institutions in the 50 states, the District of Columbia, and Puerto Rico. Standard error tables are available at http://nces.ed.gov/pubsearch/pubsinfo.asp?pubid=2014002 . SOURCE: U.S. Department of Education, National Center for Education Statistics, 2008/09 Baccalaureate and Beyond Study (B&B:08/09). 14 POSTBACCALAUREATE EMPLOYMENT Studies have found a positive relatioship between teacher salary levels and successful teacher recruitment (Guarino, Santibanez, and Daley 2006); in addition, both job satisfaction and compensation affect teacher retention (Cha and CohenVogel 2011; Guarino, Santibanez, and Daley 2006). While findings from the current study cannot directly address issues of teacher rcruitment and retention, it may be of interest to compare compensation and job satisfaction among those who taught with those who prepared for, considered, or did not consider teacing. A higher percentage of graduates who taught before or after earning their bachelor’s degree (92 percent) were working for pay in 2009 than graduates who prepared for, consiered, or did not consider teaching (80 to 84 percent) (figure 9).The successful recruitment and retention of teachers in teaching employment has been linked to a number of jobrelated fators. Among graduates working for pay in 2009, the 2009 median annual earings of those who taught either before or after earning their bachelor’s degree ($33,00) did not differ measurably from that of those who did not consier teaching ($34,). However, graduates who taught had higher median earnings than those who were not teachingbut prepared to teach ($21,00) and those who considered teaching ($2 For respondents with multiple jobs, earnings are only for the primary job, which is the job at which the respondent worked the most hours. FIGURE9. EMPLOYMENT AND INCOMEPercentage of 200708 firsttim bachelor’s degree recipients who worked for pay and their median annual income, by teaching status: 32,000 33,00 21,00 2,00 0 10,00020,00030,00040,00050,000All undergraduatesTaughtPreparedto teachConsidered teaching, but did not prepare or teachDid not consider, prepare, or teachIncome$ Percent worked for pay NOTE: Taughtincludes bachelor’s degree recipients who held K12 teaching jobs, worked as shortterm substitutes, or worked as teacher’s aides before or after completing their degree. Prepared to teachincludes bachelor’s degree recipients who took courses to prepare for teaching at the K12 level, completed student teaching, or were certified to teach at the K–12 level but had not taught. Considered teaching, but did not prepare or teachincludes bachelor’s degree recipients who reported that they were currently considering teaching in 200708 or 2009 but had not prepared to teach or taught by 2009. Did notconsider, prepare, or teachincludes bachelor’s degree recipients who had not prepared to teach, taught, or reported considering teaching in 200708 or 2009. For respondents with multiple jobs, earnings are only for the primary job, which is the job at which the respondent worked the most hours. Estimates include students enrolled in TitleIV eligible postsecondary institutions in the 50 states, the District of Columbia, and Puerto Rico.Standard error tables are available at http://nces.ed.gov/pubsearch/pubsinfo.asp?pubid=2014002 . SOURCE: U.S. Department of Education, National Center for Education Statistics, 2008/09 Baccalaureate and Beyond Study (B&B:08/09). 15 Among graduates who were eployed in 2009, relatively more of those who taught (82 percent), wheter or not they were teaching when surveyed in 2009, expressed overall satisfaction with their jobs than did those who prepared to teach, consiered teaching, and did not consider teaching (58to 74 percent) (figure 10).Also, relatively more graduates who taught (61percent) reported satisfation with their compensation than did those whoprepared for or considered teaching (46 and 43 percent, respetively), but no measureable difference in compensation satisfaction was found between those who taught and those who did not consider teaching (58 percent). FIGURE 1 0 . JOB SATISFACTION Among 200708 firsttime bachelor’s degree recipients who were employed, percentage who reported satisfaction with their compensation and with their job overall, by teaching status: 2009 56 61 46 43 58 72 82 63 58 0 All undergraduatesTaughtPrepared to teachConsidered teaching, but did not prepare or teachDid not consider, prepare, or teachPercent Satisfaction with compensation Overall satisfaction NOTE: Taughtincludes bachelor’s degree recipients who held K12 teaching jobs, worked as shortterm substitutes, or worked as teacher’s aides before or after completing their degree.Prepared to teachincludes bachelor’s degree recipients who took courses to prepare for teaching at the K12 level, completed student teaching, or were certified to teach at the K–12 level but had not taught. Considered teaching, but did not prepare or teachincludes bachelor’s degree recipients who reported that they were currently considering teaching in 200708 or 2009 but had not prepared to teach or taught by 2009. Did not consider, prepare, or teachincludes bachelor’s degree recipients who had not prepared to teach, taught, or reported considering teaching in 200708 or 2009. Estimates include students enrolled in Title IV eligible postsecondary institutions in the 50 states, the District of Columbia, and Puerto Rico.Standard error tables are available at http://nces.ed.gov/pubsearch/pubsinfo.asp?pubid=2014002 . SOURCE: U.S. Department of Education, National Center for Education Statistics, 2008/09 Baccalaureate and Beyond Study (B&B:08/09). 16 FIND OUT MORE For questions about content or to order additional copies of this Statistics in Brief or view this report online, go to: http://nces.ed.gov/pubsearch/pubsinfo.asp?pubid=2014002 Readers may also be interested in the following NCES products related tothe topic of this Statistics in Brief:09 Baccalaureate and Beyond Longitudinal Study (B&B:08/09): A First Look at Recent College Graduates(NCES 2011236). http://nces.ed.gov/pubsearch/pubsinfo.asp?pubid= 2011236 Education and Certification Qualifications of Departmentalized Public High SchoolLevel Teachers of Core Subjects: Evidence From the 200708 Schools and Staffing Survey (NCES 2011317). http://nces.ed.gov/pubsearch/pubsinfo.asp?pubid= 2011317 Teacher Career Choices: Timing of Teacher Careers Among 199293 Bachelor’s Degree Recipients(NCES2008153). http://nces.ed.gov/pubsearch/pubsinfo.asp?pubid= 2008153 To Teach or Not to Teach? Teaching Experience and Preparation Among 199293 Bachelor’s Degree Recipients 10 Years After College(NCES 2007163). http://nces.ed.gov/pubsearch/pubsinfo.asp?pubid= 2007163 Attrition of New Teachers Among Recent College Graduates: Comparing Occupational Stability Among 93 College Graduates Who Taught and Those Who Worked inOther Occupations(NCES 2001189). http://nces.ed.gov/pubsearch/pubsinfo.asp?pubid= 2001189 17 TECHNICAL NOTESSurvey MethodologyThe estimates provided in this Statistics in Brief are based on data collected through the first followup of the 2008 Baccalaureate and Beyond Longitudnal Study (B&B:08/09), which describes the enrollment and employment expriences of a national sample of 200708 bachelor’s degree recipients 1 year ater graduation. The first followup study explores both undergraduate education experiences and early postbaccalaureate employment and enrollment. The second followup of this cohort began in 2012. B&B:08 is the third in a series of studies of bachelor’s degree recipients that have previously covered 199293 graduates through 2003 (B&B:93) and 19992000 gradates through 2001 (B&B:2000). The B&B studies allow researchers to address questions regarding the experiences of bachelor’s degree recipients, including participation in various undergraduate financial aid programs, undergraduate debt, and repayment of that debt; etrance into and progress through postbaccalaureate education; and postbaccalaureate employment, paticularly as elementary/secondary teachers. In B&B:08/09, students provided data through instruments administered via the Internet or telephone. In addition to student responses, data were col-lected from the institutions that grantedthe sampled students’ bachlor’s degrees, and the U.S. Department of Education supplied respondentlevel data on student loan and grant prgrams (i.e., the National Student Loan Data System) and federal student fnancial aid applications (i.e., the Central Processing System), matching student records using a common idetifier.Students’ transcripts through the 2008academic year were also col-lected as part of the Postsecondary Education Transcript Study (PETS), crating a record of academic enrollment including coursetaking, credit accumlation, academic performance, and degree receipt. Among the approximately 137,800 udergraduate students who were sampled for the 200708 National Postsecondary Student Aid Study (NPSAS:08), approximately 17,160 stdents were determined to be eligible for B&B:08/09. Eligible students were those who had enrolled at an instittion that was eligible to participate in Title IV federal student aid programs and was located in one of the 50 states, the District of Columbia, or Puerto Rico; ad completed requirements for a bachelor’s degree between July 1, 2007, and June 30, 2008; and were awarded a baccalaureate degree by the institution from which they were sapled no later than June 30, 2009. These students represent approximately 1.6 million students who completed the requirements for a baccalaureate dgree between July 1, 2007, and June 30, 2008. In this Brief, the 7 percent of 200708 bachelor’s degree recipients who had earned another bachelor’s (or higher) degree before the 2007bachelor’s were excluded from the analyses. Table A-1 provides detailed information about the B&B:08/09 data collection.The institution sampling frame for NPSAS:08 was constructed from the 200405 and 200506 Institutional Characteristics, Fall Enrollment, and Completions files of the Integrated Postsecondary Education Data System (IPEDS), which includes all U.S. postsecondary institutions that are elgible to participate in federal financial aid programs under Title IV of the Higher Education Act. The sampling design consisted of first selecting eligble institutionsandthen selecting students from these institutions. Insti-tutions were selected with probabilities proportional to a compsite measure of size based on expected 200708 enrollment. With approxtely 1,700 institutions participating in the study, the weighted institution response rate was 90 percent. Eligible sampled students were defined as study respondents if at least 11 key data elements were available from any data source. Approximately 114,undergraduates and 14,000 graduate students were study respondents, and the weighted student response rates for both levels were 96 percent.Estmates were weighted to adjust for the unequal probability of selection into the sample and for nonresponse. Data on graduate students from NPSAS:08 are not included in this study. 18 TABLE A - 1 . Selected statistics on B&B:08/09 data collections Statistic B&B:08/09 Target population BA recipients in 200 8 – 0 9 Target population size 1.6 million Sampling frame (institutions) 200405 and 200506 IPEDS IC Fall Enrollment, and Completion files Number of sampled institutions ( NPSAS ) 1,960 Number of eligible institutions (NPSAS) 1,940 Number of partic i pating institutions ( NPSAS ) 1,730 Percent of institutions that provided student enrollment lists (unweighted) 89.0 Percent of institutions that provided student enrollment lists (weighted) 90.1 Number of sampled students 18,500 Number of eligible students 17,160 for interview and transcript individual; 17,060 for combined (due to perturbation) Interview response rate (unweighted) 87.7 Interview response rate (weighted) 78.3 Combined interview and transcript response rate (unweighted) 82.2 Combined interview and transcript response rate (weighted) 73.1 Integrated Postsecondary Education Data System, Institutional Characteristics file. SOURCE: Henke, R.R., Cataldi, E.F., Green, C., Lew, T., Woo, J., Sheperd, B., and Siegel, P. (2011). 200809 Baccalaureate and Beyond Longitudinal Study (B&B:08/09): A First Look at Recent College Graduates(NCES 2011236). National Center for Education Statistics, Institute of Education Sciences, U.S. Department of Education. Washington, DC. Two broad categories of error occur in estimates generated from surveys: sampling and nonsampling errors. Sampling errors occur when observtions are based on samples rather than on entire populations. The standard eror of a sample statistic is a measure of the variation due to sampling and indcates the precision of the statistic. The complex sampling design used in NPSAS:08 must be taken into accountwhen calculating variance estimates such as standard errors. NCES’s online PowerStats, which generated the estmates in this Statistics in Brief, uses the balanced repeated replication(BRR) method to adjust variance estimation for the complex sample design Kaufman 2004; Wolter 1985). Nonsampling errors can be attributed to severalsources: incomplete infomation about all respondents (e.g., some students or institutions refused to participate, or students participated but answered only certain items); diferences among respondents in question interpretation; inability or unwillingness to give correct infomation; mistakes in recording or coding data; and other errors of col-lecing, processing, sampling, and imputing missing data.For more information on B&B:08/09 and NPSAS:08 methodology, see the following: 09 Baccalaureate and Beyond Longitudinal Study (B&B:08/09): A First Look at Recent College Graduates(NCES 2011236). http://nces.ed.gov/pubsearch/ pubsinfo.asp?pubid=2011236 08 National Postsecondary Student Aid Study (NPSAS:08) Fullscale Methodology Report(NCES 2011188). http://nces.ed.gov/pubsearch/ pubsinfo.asp?pubid=2011188 19 Response Rates NCES Statistical Standard 4-4-1 states that “[a]ny survey stage of data colletion with a unit or item response rate less than 85 percent must be evaluated for the potential magnitude of nonrsponse bias before the data or any analysis using the data may be rleased” (U.S. Department of Education 2002).In the case of B&B:08/09, this means that nonresponse bias analysis could be required at any of three levels: institutions, study respondents, or items. Because the institutional rsponse rate for NPSAS:08 was 90 percent, nonresponse bias analysis was not required at that level.Of 17,160 eligible sample students, the B&B:08/09 weighted interview rsponse rate was 78 percent, the transcript weighted response rate was 92 percent, and the combined inteview and transcript weighted response rate was 73 percent. Becausethe weighted rate is less than 85 percent for those who responded to the inteiew and those with both an interview and transcript, nonresponse bias analsis was required for those variables based in whole or in part on these sources. In this Brief, onevariable rquired nonresponse bias analysis: B1TSTATB (2009 teaching status (altenative)). For B1TSTATB, nonresponse bias analyses were conducted to dtermine whether respondents and nonrespondents differed on the fol-loingcharacteristics: institution sector, region, and total enrollment;student type, sex, and age group; whether e student had submitted the Free Application for Federal Stdent Aid, was a federalaid recipient, was a Pell Grant recipient, or took outStafford Loan; and the amount, if any, of a student’s Pell Grant or Stafford Loan.A summary of nonresponse bias alysis results for B1TSTATBappears in table Aelow. “Region, other jurisdictionsPR” was the characteristic with the greatest signifcant bias. Enrollment at an institution located in Puerto Ricoconstitutes 1 percent of all bachelor’s degree reciients, however, andtherefore the large bias exhibited between respondents and nonrespondents for this category is likely to have minimal impact when all bachelor’s degree recipients are considered. VARIABLES USED All estimates presented in this Statistics in Brief were produced using PowerStats, a webbased software application that allows users to generate tables for many of the postsecondary surveys conducted by NCES. See “Run Your Own Analysis With DataLab” below for more information on PowerStats. The variables used in this Brief are listed below. Visit the NCES DataLab website http://nces.ed.gov/datalab to view detailed information on how these variables were constructedand their sources. Under Codbooks, select B&B: 2008under Viewby subject or View by variablename. The program files that generated the statistics presented in this Brief can be found at http://nces.ed.gov/pubsearch/pubsinfo.asp?pubid=2014002 . Label Name 2009 teaching status (alternative) B1TSTATB Bachelor’s degree major (detailed) in 2007 – 08 MAJORS23 Borrowed any undergraduate loans through 2007 – 08 B1LOANS Cumulative amount owed for undergraduate education as of 2008 – 09 B1OWAMT1 Earned income in 2009 B1ERNINC Highest degree completed before 2007 – 08 bachelor’s degree HIOTHDEG Race/ethnicity RACE Satisfaction with employment in 2009: Compensation B1JBPAY Satisfaction with employment in 2009: Overall satisfaction B1JBOVER Sex GENDER Transcript: Advanced laboratory science: credits earned QEALBERN Transcript: Calculus/advanced math: credits earned QECLCERN Transcript: College - level mathematics: credits earned QEMATERN Transcript: Science: credits earned QESCIERN Undergraduate GPA as of 2007 – 08 GPA 20 TABLE A - 2 . Summary of item - level nonresponse bias fo r all students at all institution types: 2008–09 Variable name Preimputation Average percent difference across all categoriespre andpost imputation Median percent relative bias across charac teristics Percentage charac teristics with significant bias Charac teristic with greatest significant bias B1TSTATB 2009 teaching status (alternative) 1.31 43.24 Region, other juri diction - PR 0. 60 NOTE: Relative bias is computed by dividing a variable’s estimated bias for a given characteristic by the variable’s mean. Relative bias is defined as significant if its difference from zero is statistically significant at .05. SOURCE: U.S. Department of Education, National Center for Education Statistics, 2008/09 Baccalaureate and Beyond Study (B&B:08/09). Any bias due to nonresponse, however, is based upon responses prior to stchastic imputation in which missing data were replaced with valid data from the records of donor cases that matched the recipients on selected demographic, enrollment, institution, and financial aidrelated variables(Krotki, Black, and Creel 2005). Potetial bias may have been reduced due to imputation. Because imputation prcedures are designed specifically to identify donor cases with characteritics similar to those with missing data, the imputation procedure is assumed to reduce bias. While the level of itemlevel bias before imputation is measuable, the same measurement cannot be made after imputation. Although the magnitude of any change in itemlevel bias cannot be determined, the item estimates before and after imptation were compared to determine whether the imputation changed the biased estimate as an indication of a possible reduction in bias.For B1TSTATB, the estimatedpre/postimputationdifference for each categy (i.e., the percentage of students in that category before imputation minus the percentage of students in that caegory after imputation) was computed, after which the mean of the absolute value of those differences was coputed (tabl. The mean difference between pre- and postimputation percentages, 0.60, was not statistically significant, which suggests that imptation may not have reduced bias, that the sample size was too small to detect a significant difference, or that therwas little bias to be reduced.For more detailed information on nonresponse bias analysis and an overview of the survey methodology, see 09 Baccalaureate and Beyond Longitudinal Study (B&B:08/09): A First Look at Recent College Graduates(NCES 2011236). http://nces.ed.gov/pubsearch/ pubsinfo.asp?pubid=2011236 For more information, contact: National Center for Education StatisticsNCES.Info@ed.gov (800) 6776987Statistical ProceduresComparisons of means, medians, and proportions were tested using Stdent’s t statistic.Differences between estimates were tested against the probability of a Type I erroror signifi-cance level. The statistical significance of each comparison was determined by calculating the Student’s t value for the difference between each pair of means or proportions and comparing the value with published tables of signifcance levels for twotailed hypothesis sting. Student’s t values were coputed to test differences between independent estimates using the fol-lowing formula: 12sese where and are the estimates to be compared and and are their coresponding standard errors.There are hazards in reporting statistcal tests for each comparison. First, comparisons based on large t statistics may appear to merit special attention. Differences between medians were tested using Student’sstatistic because nonparametric tests of differences in rank do not take the complex sample design of these data into account when estimating variance. For more information, see Shao and (1996) and Francisco and Fuller (1991)A Type I error occurs when one concludes that a difference observed in a sample reflectsa true difference in the population from which the sample was drawn, when no such difference is present. 21 This can be misleading because the magnitude of the t statistic is related not only to the observed differences in means or percentages but also to the number of respondents in the specific categories used for comparison. Hence, a small difference compared across a large number of respondents would produce a large (and thus possibly sttistically significant) t statistic.A second hazard in reporting statistical tests is the possibility that one can rport a “false positive” or Type I error. Statistical tests are designed to limit the risk of this type of error using a val-ue denoted by alpha. The alpha level of .05 was selected for findings in this Brief and ensures that a difference of a certain magnitude or larger would be produced when there was no actual difference between the quantities in the underlying populationno more than 1 time out of 20. When analysts test hypotheses that show alpha values at the .05 level or smaller, they reject the null hypothesis that there is no diference between the two quantities. Failing to reject a null hypothesis (i.e., detect a difference), however, does not implythat the values are the same or equivalent. No adjustments were made for multiple comparisons. 22 REFERENCESAchinstein, B., Ogawa, R., Sexton, D., and Freitas, C. (2010). Retaining Teachers of Color: A Pressing Problem and Potential Strategy for “HardStaff” Schools. Review of Educational Research, 801): 71107.Alt, M., and Henke, R. (2007). To Teach or Not to Teach? Teaching Experience and Preparation Among 199293 Bachelor’s Degree Recipients 10 Years After College(NCES 2007163). National Center for Education Statistics, Institute of Edcation Sciences, U.S. Department of Education. Washington, DC.Anderson, S. (2008). Teacher Career Choices: Timing of Teacher Careers Among 199293 Bachelor’s Degree Recipients(NCES 2008153). National Center for Education Statistics, Institute of Education Sciences, U.S. Department of Education. Washington, DC.Aud, S., Hussar,W., Kena, G., Bianco, K., Frohlich, L., Kemp, J., and Tahan, K. (2011).The Condition of Education (NCES 2011033).National Ceter for Education Statistics, Institute of Education Sciences, U.S. Department of Education. Washington, DC.Bacolod, M. (2007). Who Teaches and Where They Choose to Teach: College Graduates of the 1990s. Education Evaluation and Policy Analysis(3): 168.Cha, S.H., andCohengel, L. (2011). Why They Quit: A Focused Look at Teachers Who Leave for Other Opations. School Effectiveness and School Improvement(4): 371D’Agostino, J.V., and Powers, S.J. (2009). Predicting Teacher Performance With Test Scores and Grade Point Average: A Metanalysis. American Educational Research Journal, 46(1): 146182.Elfers, A., Plecki, M., and Knapp, M. (2006). Teacher Mobility: Looking More Closly at “The Movers” Within a State System.Peabody Journal of Education, (3): 94127.ancisco, C., and Fuller, W. (1991). Quantile Estimation With Complex Survey Design. The Annals of Statistics (1): 4469.Goldin, C., Katz, L.F., andKuziemko, I. (2006). The Homecoming of American College Women: The Reversal of the Colege Gender Gap (No. 12139). Cambridge, MA: National Bureau of Economic Research.Guarino,C.M., Santibanez, L., andDaley, G.A. (2006). Teacher Recruitment and Retention: A Review of the Rcent Empirical Literature. Review of Eductional Research(2): 173208.Henke, R., Peter, K., Li, X., and Geis, S. (2005). Elementary/Secondary School Teaching Among Recent College Grauates: 1994 and 2001(NCES 2005161). National Center for Education Statitics, Institute of Education Sciences, U.S. Department of Education. Wasington, DC.Ingersoll, R., and May, H. (2011a). The Mnority Teacher Shortage: Fact or Fable? Phi Delta Kappan,(1): 62Ingersoll, R., andMay, H. (2011). Re-cruitment, Retention, and the Minority Teacher Shortage. Philadelphia: Cosortium for Policy Research in Education, University of Pennsylvaniaand Center for Educational Research in the Interest of Underserved Stdents, University of California, SantaCruz.Ingersoll, R., and Merrill, L. (2010). Who’s Teaching Our Children? Educational Leadership(8): 14Ingersoll, R., and Perda, D. (2010). Is the Supply of Mathematics and Science Teachers Sufficient? American Eductional Research Journal(3): 563Jacob, B., Kane, T., Rockoff, J., and Staiger, D. (2011). Can You Recognize an Effective Teacher When You Recruit One? Education Finance and Policy, (1): 4374.Kaufman, S. (2004). Using the Bootstrap in a TwoStage Design When Some SecondStage Strata Have Only One Unit Allocated. Proceedings of the American Statistical Association, Setion on Survey Research Methods. Alexandria, VA: American Statistical Association.Krotki, K., Black, S., and Creel, D. (2005). Mass Imputation. In Proceedings of the Section on Survey Research Methods,American Statistical Association [CDROM]. Alexandria, VA: American Statistical Association.KuklaAcevedo, S. (2009). Do Teacher Characteristics Matter? New Results on the Effects of Teacher Preparation on Student Achievement. Economics of Education Review, 28(1):57. 23 Minicozzi, A. (2005). The Short Term Efect of Educational Debt on Job Decisions. Economics of Education Rview(4): 417430.Provasnik, S., and Dorfman, S. (2005). bility in the Teacher Workforce: Findings from the Condition of Education 2005(NCES 2005114). National Center for Education Statistics, Institute of Edcation Sciences, U.S. Department of Education. Washington, DC.Rothstein, J., and Rouse, C. (2011). Constrained After College: StudenLoans and EarlyCareer Occupational Choices. Journal of Public Economics2): 149163.Scafidi, B., Sjoquist, D., and Stinebrickner, T. (2007). Race, Poverty, and Teacher Mobility. Economics of Education Rview, 26(2): 145Shao, J.and Tu, D.(1996). The Jackknife and Bootstrap. New York: SpringerVerlag.Tyack, D.andHansot, E. (1992). Learning Together: A History of Coeducation in American Public SchoolsNew York: Russell Sage Foundation Publications.U.S. Bureau of Labor Statistics. (2012). U.S. Department of Labor, Occupational Outlook Handbook, 201213 EditionRetrieved May 20, 2013 from http://www.bls.gov/ooh/education trainingandlibrary/home.htm . U.S. Department of Education, National Center for Education Statistics. (2002). NCES Statistical Standards(NCES 2003061). Washington, DC.Villegas, A., and Davis, D. (2008). Prepaing Teachers of Color to Confront Racial/Ethnic Disparities inEductional Outcomes. In M. CochranSmith, S. FeimanNemser, and J. McItyre (Eds.), Handbook ofResearch in Teacher Education: Enduring Issues in Changing Contexts(pp. 583605). Mahwah, NJ:Lawrence Earlbaum.Villegas, A., and Irvine, J. (2010). Diversifing the Teaching Force: An Examination of Major Arguments. Urban Review, 42(3): 175192.Wolter, K. (1985). Introduction to Variance Estimation. New York: SpringerVerlag.Young, T., and Fusarelli, B. (2011). The itics of Education and Equity in Turbulent Times: An Introduction. Peabody Journal of Education: 214. 24 RUN YOUR OWN ANALYSIS WITH DATALAB You can replicate or expand upon the figures and tables in this report, or even create your own. DataLab has several different tools that allow you to cutomize and generate output from a variety of different survey datasets. Visit DataLab at: http://nces.ed.gov/datalab/ Cover artwork © iStockphoto.com/ centauria.