/
U.S. Department of the Interior U.S. Department of the Interior

U.S. Department of the Interior - PDF document

lindy-dunigan
lindy-dunigan . @lindy-dunigan
Follow
381 views
Uploaded On 2017-11-27

U.S. Department of the Interior - PPT Presentation

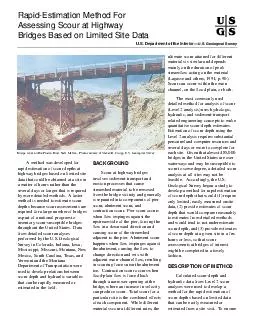
RapidEstimation Method For Assessing Scour at Highway Bridges Based on Limited Site Data Bridge scour on Rio Puerco River New Mexico Photo courtesy of Steven D Craigg US Geological Survey wo ID: 610555

Rapid-Estimation Method For Assessing Scour

Share:

Link:

Embed:

Download Presentation from below link

Download Pdf The PPT/PDF document "U.S. Department of the Interior" is the property of its rightful owner. Permission is granted to download and print the materials on this web site for personal, non-commercial use only, and to display it on your personal computer provided you do not modify the materials and that you retain all copyright notices contained in the materials. By downloading content from our website, you accept the terms of this agreement.


Presentation Transcript

U.S. Department of the InteriorÑU.S. Geological SurveyA method was developed for highway bridges based on limited site several days or longer that is required by more detailed methods. A faster required for a large number of bridges inventory scour-susceptible bridges Survey in Colorado, Indiana, Iowa, Mississippi, Missouri, Montana, New Mexico, South Carolina, Texas, and Vermont and the Montana Department of Transportation were used to develop relations between scour depth and hydraulic variables BACKGROUNDScour at highway bridges involves sediment-transport and streambed material to be removed scour, abutment scour, and contraction scour. Pier scour occurs when ßow impinges against the upstream side of the pier, forcing the ßow in a downward direction and adjacent to the pier. Abutment scour happens when ßow impinges against the abutment, causing the ßow to adjacent main-channel ßow, resulting in scouring forces near the abutment ßood-plain ßow is forced back through a narrower opening at the bridge, where an increase in velocity can produce scour. Total scour for a particular site is the combined effects of each component. While different materials scour at different rates, the ultimate scour attained for different streamßow acting on the material (Level 2 analysis) uses hydrologic, related engineering concepts to make quantitative scour-depth estimates. Level 2 analysis requires substantial several days or more to complete for each site. Given that almost 485,000 bridges in the United States are over waterways and may be susceptible to scour to some degree, a detailed scour feasible. Accordingly, the U.S. Geological Survey began a study to develop a method for rapid estimation of scour depths that would (1) require data, (2) provide estimates of scour depth that would compare reasonably and would tend to not underestimate scour depth, and (3) provide estimates of scour depth at a given site in a few fashion.Calculated scour-depth and hydraulic data from Level 2 scour analyses were used to develop a estimated from a site visit. To ensure Rapid-Estimation Method For Assessing Scour at Highway Bridges Based on Limited Site Data Bridge scour on Rio Puerco River, New Mexico. Photo courtesy of Steven D. Craigg, U.S. Geological Survey. would be applicable to a wide range used to develop the method.explicitly calculated using the Level 2 equations, complex hydraulic variables in some equations cannot be Þeld. Surrogate variables that could substituted for the more complex variables in the Level 2 scour equations to arrive at simpler forms of the scour equations. These simpler equations were used to develop the surrogate variables. To ensure that the rapid-estimation method would tend to overestimate rather than surrogate variables were based on envelope curves rather than best-Þt curves.For example, important variables for estimation of pier scour ßow angle of attack, and the average Froude number of ßow in the bridge section. Froude number is a hydraulic term related to ßow depth and velocity. Of these variables, pier width was the most signiÞcant. The other variables were combined with pier-scour depth to form a term called from Level 2 analyses were thus plotted and an envelope curve was used to encompass the data. The envelope curve is used to determine a value for the pier scour function (Þg. pier-scour depth.In a similar manner, envelope curves for abutment scour and developed. Hydraulic variables needed to apply the envelope curves range from as few as two for abutment conditions of contraction scour. 012 2 4 6 8 PIER WIDTH, IN FEET 0240 2 4 6 8 10 12 14 16 18 20 22 PIER-SCOUR FUNCTION (x), IN FEET F To apply the rapid-estimation method, a peak discharge having a 100-year recurrence interval is estimated using existing USGS Jennings and others (1994). The 100-year discharge is divided by estimated width of ßow at the bridge section to yield a term called unit discharge at the bridge. A graph developed from Level 2 data (Þg. 3) is used to estimate velocity at the bridge from unit discharge, and a second graph backwater from velocity at the bridge. Backwater, the increase in ßow depth used to estimate upstream ßow depth and other variables required for application of the envelope curves. Figures 3 and 4 were developed from of variables on the basis of Þgures 3 that moderate estimates of velocity and backwater result, which are then the envelope curves. Estimated scour depths from the envelope curves are various qualitative observations about that may affect scour. Scour prisms, drawings as described by Richardson threat to pier or abutment foundations (Þg. 6). The total scour depth used for plotting purposes on design drawings and for assessment of scour-scour plus abutment scour for abutments. FLOW ANGLEAND VELOCITYLENGTHTOP VIEW OF PIER WIDTHDEPTHSECTION VIEW OFBRIDGE CROSSING BRIDGEPIER Figure 1. Variables used for estimation ofpier scour. EVALUATION AND LIMITATIONS OF METHODTwo approaches were used to method. In the Þrst approach, several individuals experienced in bridge scour-related Þelds independently selected sites, and the averages of individual results were compared to mean and standard deviation each individual for each site were variability among individuals. Results showed generally good In addition to the two comparison approaches used, it was scour, 28 of 33 scour-depth estimates equaled or exceeded corresponding 0180 20 40 60 80 100 120 140 160 VELOCITY SQUARED, IN FEET SQUARED PER SECOND SQUARED 060 1 2 3 4 5 BACKWATER, IN FEET Figure 4. Graph for estimation of backwater atbridge. Figure 3. Graph for estimation of velocity at bridge. 11,000 10 100 UNIT DISCHARGE AT BRIDGE, IN CUBICFEET PER SECOND PER FOOT 1502 3 4 5 7 10 20 30 40 VELOCITY AT BRIDGE, IN FEET PER SECOND Figure 6. Sketch of scour prism showing possible threat to left abutment and pier foundations. Figure 5. Side view of stream showing backwater and hydraulic variables at and upstream from bridge. Fact Sheet FS-Ð96depths calculated by the Level 2 method; for pier scour, 17 of 24 estimates by the method exceeded corresponding Level 2 depths; and for abutment scour, 55 of 66 estimates by the method equaled or exceeded corresponding Level 2 depths. On the components investigated by Þve different individuals, it was found that no more than about two hours was required to conduct and report scour-The evaluation effort described above involved in applying the rapid-individual possessing knowledge and experience in the Þelds of bridge scour, hydraulics, and ßood hydrology. Although the rapid-potentially scour-critical bridges, it replacement of bridges. The rapid-scour. The development, application, and evaluation of the rapid-Holnbeck and Parrett (1997). This the Level 2 method in detail (Lagasse understood before undertaking any Holnbeck, S.R., and Parrett, Charles, scour at highway bridges based on Survey Water-Resources Investiga-Jennings, M.E., Thomas, W.O., and mary of U.S. Geological Survey regional regression equations for estimating magnitude and frequency U.S. Geological Survey Water-Resources Investigations ReportLagasse, P.F., Schall, J.D., Johnson, F., Richardson, E.V., Richardson, J.R., Chang, F., 1991, Stream stability at highway structures: U.S. Depart-ment of Transportation No. FHWA-Richardson, E.V., Harrison, L.J., Richard-son, J.R., and Davis, S.R., 1993, Evaluating scour at bridges (2d ed.): U.S. Department of Transpor-FOR MORE INFORMATIONUSGS State representative301 South Park AvenueFederal Building, Room 428Email: dc_mt@usgs.govAdditional earth scienceinformation can be found byaccessing the USGS Home Pageon the World Wide Web athttp://www.usgs.gov/For more information onall USGS reports and products(including maps, images,and computerized data), call provides maps,reports, and information toto manage, develop, and protectAmericaÕs water, energy, mineral,biological, and land resources.We help Þnd the natural resourcesneeded to build tomorrow, andneeded to help minimize or mitigatethe effects of natural hazards andenvironmental damage caused bynatural and human activities. Theresults of our efforts touch thedaily life of almost every American. May 1997 and Charles Parrett