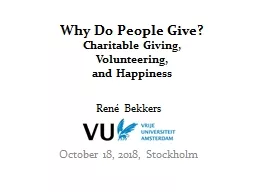
/
The Gift of Trust René Bekkers The Gift of Trust René Bekkers

The Gift of Trust René Bekkers - PowerPoint Presentation

littleccas
littleccas . @littleccas
Follow
342 views
Uploaded On 2020-08-06

The Gift of Trust René Bekkers - PPT Presentation

Global Trust Research Consortium https globaltrustresearchwordpresscom BigSurv18 Conference October 27 2018 Would you say In general most people can be trusted OR You cant be too careful in dealing with ID: 800237

data trust https ess trust data ess https 2018 analysis bekkers europe osf amp age surveys cohort survey sandberg

Share:

Link:

Embed:

Download Presentation from below link

Download The PPT/PDF document "The Gift of Trust René Bekkers" is the property of its rightful owner. Permission is granted to download and print the materials on this web site for personal, non-commercial use only, and to display it on your personal computer provided you do not modify the materials and that you retain all copyright notices contained in the materials. By downloading content from our website, you accept the terms of this agreement.


Presentation Transcript

Slide1

The Gift of Trust

René BekkersGlobal Trust Research Consortiumhttps://globaltrustresearch.wordpress.com/BigSurv18 Conference, October 27, 2018

Slide2

Would you say…

In general most people can be trusted? OR: You can’t be too careful in dealing with

other people?

Slide3

Fundamental Questions

Are we losing faith in each other?How does trust develop over the life cycle?How do generations differ in trust?Why are citizens in some countries more trusting than in other countries?How is trust based on experience?How does trust affect health, income, well-being, and prosocial behavior?

Slide4

Yet we work like…

Slide5

Slide6

Beta blockers

Slide7

Slide8

Slide9

Slide10

Consortium Benefits

Huge n – more power. Generalization.Validity in comparative research.Efficient use of existing data.Publications.

https://globaltrustresearch.wordpress.com/

Slide11

n per year

Slide12

Ex Post Survey Data Harmonization

A process:in which different survey datasets that were not specifically designed to be compared are pooled and adjusted (i.e. recoded, rescaled, or transformed) to create a new integrated dataset that could be analyzed as a typical single-source dataset; and

that is based on clear criteria that specify which datasets are included into the new dataset and clear methods for how variables in the new dataset are created.

Dubrow

&

Tomescu-Dubrow

, 2014

Slide13

Work flow

Identify a survey not yet includedCategorize the methodology: trust measure, data collection modeProvide code for harmonizationAdd harmonized data

See resultsAnalyze data

Slide14

Mega-analysis

An analysis of data pooled from different sources, with characteristics of the data sources as covariates. 

A trust response depends on characteristics of the responder, the measurement, time, and context – all cross-nested.

Bekkers, R. (2016). Introducing Mega-analysis. July 27, 2016.

https://renebekkers.wordpress.com/2016/07/27/introducing-mega-analysis/

Slide15

Slide16

Meta vs Mega-analysis

Meta-analysis also allows scholars to analyze the collective evidence on a certain phenomenonBut meta is only possible on released reports, and susceptible to publication biasPower is limited to the #studies Meta-analysis of Individual Patient Data (IPD) = Mega-analysis

Slide17

Global Trust Research Consortium

René Bekkers, Bart Sandberg, Eric Uslaner, Zhongsheng Wu, Tom van der Meer, Arjen de Wit, Erik van Ingen, Lisanne de Blok, M. Kent Jennings, Bert Bakker, Dustin Gilbreath, Rati Shubladze, Matthew Eckel

, Cengiz Enrisen, Gino Pauselli, Thessalia

Merivaki

, Laura Morales, Sonja

Zmerli

Open Science Framework:

https://osf.io/qfv76/

You

are most

welcome to

join us!

Slide18

Harmonized Trust Database

Multinational surveys: ISSP, WVS, EVS, ESS, EQLS, Eurobarometer, Survey of Adult Skills (PIAAC), CID, ICCS, ICILS, PGPENational: general social surveys, national election surveys, longitudinal panel studiesWe have identified ~365 surveys since 1953.Rough estimate: these surveys include about 2/3 of all trust responses ever collectedThe currently harmonized data include almost 4 million observations

Slide19

Trust Score by Country

Slide20

Slide21

Slide22

Number of surveys per country

Slide23

Varieties of trust items

Would you say… In general most people can be trusted? OR: You can’t be too careful in dealing with other people? = ‘Forced choice’ format (0 – 1), the Rosenberg original (1953), probably from Noelle-Neumann (1942)With option ‘It depends’ offeredWith option ‘Don’t know’ addedThese poles as Likert items on various scales1-4, 1-5, 1-7, 1-10, 0-10 == ESS

Other statements about human nature (1-5)

Slide24

ESS 0-10 scale yields more trust

Bekkers, R. & Sandberg, B. (2018).

Grading Generalized Trust Across Europe. Paper

presented

at

the

6th ESS workshop,

March

16, 2018, The Hague.

https://osf.io/qntze/

Slide25

ESS 0-10 scale yields more trust

Bekkers, R. & Sandberg, B. (2018).

Grading

Generalized

Trust

Across

Europe. Paper

presented

at

the

6th ESS workshop,

March

16, 2018, The Hague.

https://osf.io/qntze/

Slide26

ESS 0-10 scale yields more trust

Bekkers, R. & Sandberg, B. (2018).

Grading

Generalized

Trust

Across

Europe. Paper

presented

at

the

6th ESS workshop,

March

16, 2018, The Hague.

https://osf.io/qntze/

Slide27

ESS 0-10 scale yields more trust

Bekkers, R. & Sandberg, B. (2018).

Grading

Generalized

Trust

Across

Europe. Paper

presented

at

the

6th ESS workshop,

March

16, 2018, The Hague.

https://osf.io/qntze/

Slide28

HTD at 5 levels

CountryTimeSurveyScaleIndividual

154

1953-2017

365

8

3,828,342

Slide29

Variance in trust at 5 levels

CountryTimeSurveyScale

Individual

154

1953-2017

365

8

3,828,342

9.9%

5.6%

11.4%

3.3%

80~85%

Percentages are ICC estimates: Intra Class Correlation coefficients (

ρ

in

‘empty’

intercept-only models

) for levels 1 to 4 in separate regressions

Slide30

Development of Trust in the US

N = 307,502

Slide31

Age Differences in the US

N = 307,502

Slide32

Cohort Differences in the US

N = 307,502

Slide33

Cohort Differences in the US

N = 307,502

Slide34

Generational Decline at Age 17-20

Monitoring the Future, n = 114,402

Slide35

Age and Cohort in the US

N = 307,502

Slide36

Age and Cohort in the UK

N = 324,272

Slide37

Age and Cohort in Germany

N = 81,959

Slide38

Age and Cohort in the Netherlands

N = 57,710

Slide39

Income Inequality Fosters Distrust

Slide40

Slide41

r

= -.42

Violence and Trust

Slide42

Relation within Europe

strongly

negative

r

= -.36

Slide43

r

= -.46

Relation outside Europe also strongly negative

El Salvador and

Hunduras

omitted; if included

r

= -.38

Slide44

Trust makes Europeans give

https://renebekkers.wordpress.com/2018/03/22/the-force-of-everyday-philanthropy

/

r

= .52

Slide45

Relation much weaker outside Europe

r

= .11

Slide46

Let’s collaborate.

René Bekkers

@

renebekkers

r.bekkers@vu.nl

This project is on the Open

Science Framework,

https://osf.io/qfv76/

Slide47

Potential Methods Effects

Question order: before / after questions that generate a ‘warm glow’Response category format: 0-1, 1-5, 1-7, 1-10, 0-10Mode of data collection: face-to-face, paper-and-pencil, onlineData quality: response rate, #missings, interviewer ratings of ‘cooperativeness’

Slide48

Comparable projects

Luxemburg Income Study [LIS]International Stratification and Mobility File [ISMF] in SociologyCross-national Survey Data Harmonization [SDH] ProjectDurand et al. on political trust

Slide49

Slide50

Slide51

Pp. 77-100 in: Van Lange, P.A.M.,

Rockenbach

, B., & Yamagishi, T. (Eds.). Trust in Social Dilemmas. Series in Human Cooperation, Volume 2. Oxford: Oxford University Press.

https://osf.io/umdxg/

Slide52

Average trust in World Values Survey and proportion of wallets returned

in Reader’s Digest experiment – Figure from Knack, 2001

Slide53