PDF-Example:(DatatakenfromMooreandMcCabe{IntroductiontothePracticeofStatis
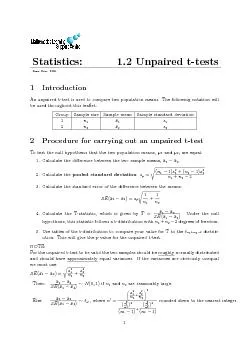
Group
Samplesize
Samplemean
Samplestandarddeviation
Beef
20
15685
2264
Poultry
17
12247
2548
Sowehavex1x215685122473438Thestandarddeviationsareapproximatelyequalsowecancalculatethepoole
Download Presentation
"Example:(DatatakenfromMooreandMcCabe{IntroductiontothePracti " is the property of its rightful owner. Permission is granted to download and print materials on this website for personal, non-commercial use only, provided you retain all copyright notices. By downloading content from our website, you accept the terms of this agreement.
Presentation Transcript
Transcript not available.