/
Kelley Kelley

Kelley - PowerPoint Presentation

lois-ondreau
lois-ondreau . @lois-ondreau
Follow
421 views
Uploaded On 2016-07-15

Kelley - PPT Presentation

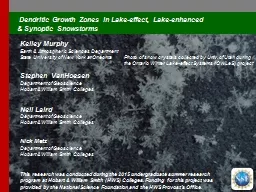
Murphy Earth amp Atmospheric Sciences Department State University of New York at Oneonta Photo of snow crystals collected by Univ of Utah during the Ontario Winter Lakeeffect Systems OWLeS project ID: 406072

amp lake effect utc lake amp utc effect dgzs snowfall synoptic snow dgz growth cold temperature supersaturation precipitation dendritic

Share:

Link:

Embed:

Download Presentation from below link

Download Presentation The PPT/PDF document "Kelley" is the property of its rightful owner. Permission is granted to download and print the materials on this web site for personal, non-commercial use only, and to display it on your personal computer provided you do not modify the materials and that you retain all copyright notices contained in the materials. By downloading content from our website, you accept the terms of this agreement.


Presentation Transcript

Slide1

Kelley

Murphy

Earth & Atmospheric Sciences DepartmentState University of New York at Oneonta Photo of snow crystals collected by Univ. of Utah during the Ontario Winter Lake-effect Systems (OWLeS) project Stephen VanHoesen Department of GeoscienceHobart & William Smith CollegesNeil Laird Department of GeoscienceHobart & William Smith CollegesNick Metz Department of Geoscience Hobart & William Smith Colleges This research was conducted during the 2015 undergraduate summer research program at Hobart & William Smith (HWS) Colleges. Funding for this project was provided by the National Science Foundation and the HWS Provost's Office.

Dendritic Growth Zones in Lake-effect, Lake-enhanced

& Synoptic SnowstormsSlide2

From Baxter, A. A., C. E. Graves, J. T. Moore, 2005: A Climatology of Snow-to-Liquid Ratio for the Contiguous United States. Wea. Forecasting, 20, 729–744.

INTRODUCTION

: Snow-to-Liquid Ratio ClimatologySlide3

INTRODUCTION: Forecasting Snowfall

NWP models do a better job at indicating the temporal and spatial distribution of forcing for precipitation, than they do forecasting the actual

QPFDuring big snowfalls, much of the snow falls within a small time windowFrom an impact standpoint, forecasting these brief periods of intense snowfall are as important (and maybe more important) than forecasting the total amountsFrom Mahoney, Waldstreicher, and Niziol, 2003: Using Bufkit to Visualize Precipitation Amount and Type. Warning Decision Training Branch Presentation. Winter Weather WorkshopSlide4

INTRODUCTION: Forecasted Omega & Dendritic Growth Intersection

From

Mahoney, Waldstreicher, and Niziol, 2003: Using Bufkit to Visualize Precipitation Amount and Type. Warning Decision Training Branch Presentation. Winter Weather WorkshopSlide5

INTRODUCTION:

Ice Crystal relation to Temperature & Supersaturation

From Nakaya, U., (1954): Snow Crystals: Natural and ArtificialDendritic Ice Crystal Growth most often occurring with:Temperature Range-12°C to -18°CSupersaturation w.r.t. Ice> 8%Slide6

Objective:

Understand the

characteristics of dendritic growth zones (DGZs) associated with different types of snowfall events Data & Methods:Buffalo, NY region October – March of 2010/2011 through 2014/2015 (5 cold seasons)Identify Snowfall events22 – 02 UTC & 10 – 14 UTC (4-hr periods centered on 00 & 12 UTC soundings)Region within 167 km (100 mi) radius from KBUFSNODAS hourly snowfall product; > trace LWE snowfall (NOHRSC)Archived surface, upper-air analyses, & lake temperatures (UCAR; CSU; GLERL)Archived KBUF WSR-88D radar data (NCDC)DGZ analyses653 archived KBUF 00 UTC & 12 UTC soundings (Univ. Wyoming)SPSS statistical software

RESEARCH OBJECTIVES & METHODSSlide7

METHODS: Lake-effect, Lake-enhanced, & Synoptic

LAKE-EFFECT:

temperature difference of about 13°C or greater between the lake surface and 850 hPa. ex: cold front passes through the region w/ cold air moving over warm lake, leading to precipitation bandsLAKE-ENHANCED: lake-effect band within synoptic precipitationSYNOPTIC: solely synoptic cyclone moving through the region or a passing front w/ precipitation ahead of or along front, precipitation is usually more wide-spread LAKE-EFFECT18 Nov 201412 UTC

LAKE-ENHANCED17 Dec 201412 UTCSYNOPTIC6 Dec 201412 UTCSlide8

METHODS: Lake-effect, Lake-enhanced, & Synoptic

297

45.5%30045.9%568.6%Slide9

METHODS: Dendritic Growth Zone (defined by T: -12°C to -18°C)

Pressure (hPa)

Temperature (°C)4005006007008009001000-40 -30 -20 -10 0 10

-18°C

-12°CDGZ-bDGZ-aKBUF 7 December 2013 12 UTCSlide10

RESULTS: Base Height of DGZs

N=653Slide11

N=653

RESULTS: Depth of DGZsSlide12

RESULTS: Mean Temperature within DGZs

N=653Slide13

RESULTS: Mean Mixing Ratio in DGZs

N=653Slide14

RESULTS: Mean Supersaturation (Ice) in DGZs

N=653Slide15

Lake Effect

DGZs reflect a dry environment with the passing of a cold front, high supersaturation values, and a short distance for dendrites to fall to the surface (low DGZ base height)

Could indicate that lake-effect storms have the largest potential for rapid snowfall accumulationLake EnhancedDGZs reflect the greatest potential for dendritic growth (largest depth). Moisture, temperature, and supersaturation values fall between those of lake-effect and synoptic storms.SynopticDGZs reflect a moist environment with largest distances from the surface to DGZ base. Supersaturation is consistently lower than lake-effect DGZs. SeasonalityDuring the “peak” months of the cold season, DGZ base height drops and the variability of layer depth increases Supersaturation values for all snow events generally decreases across the cold seasonSUMMARY