/
Milkman et al. prompting concrete construals and focusing decision mak Milkman et al. prompting concrete construals and focusing decision mak

Milkman et al. prompting concrete construals and focusing decision mak - PDF document

lois-ondreau
lois-ondreau . @lois-ondreau
Follow
418 views
Uploaded On 2015-09-05

Milkman et al. prompting concrete construals and focusing decision mak - PPT Presentation

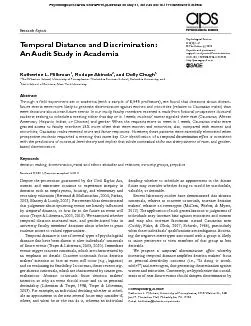
2 Temporal Distance and Discrimination ranking of the faculty member and studentfaculty racial analyses see Analysis in the Supplemental Materialmuch weaker in the now condition Table 1 Expone ID: 122415

2 Temporal Distance and Discrimination ranking

Share:

Link:

Embed:

Download Presentation from below link

Download Pdf The PPT/PDF document "Milkman et al. prompting concrete constr..." is the property of its rightful owner. Permission is granted to download and print the materials on this web site for personal, non-commercial use only, and to display it on your personal computer provided you do not modify the materials and that you retain all copyright notices contained in the materials. By downloading content from our website, you accept the terms of this agreement.


Presentation Transcript

2 Milkman et al. prompting concrete construals and focusing decision makers’ an event could occur rather than whether it to occur. In this context, concerns about desirability (and a reliance on stereotypes in addressing those concerns) should be secondary to concerns about feasibility.To test for the temporal discrimination effect, we conducted university faculty members. We studied professors’ willingness to meet with prospective doctoral students in the future ing event. Specifically, we analyzed faculty members’ responstudents’ names were selected to signal different races and genders. Given that in academia (our study context), Caucastereotypes, we predicted that faculty members would exhibit greater bias against female and minority students (relative to access that day. (For more details about the stereotypes associWe measured three dependent variables: (a) whether a quickly the recipient responded. We predicted that students would receive relatively undifferentiated treatment in the now condition because concerns about feasibility would dominate faculty members’ attention; however, we predicted that in the later condition, faculty members’ concerns about the desirabilTo select study participants, we identified all 6,300 doctoral programs across all academic disciplines at the top 260 U.S. universities (U.S. News & World Report, 2010); approximately 200,000 faculty members were affiliated with these We then selected one to two faculty members from each doctoral program’s Web site, for a total of 6,548 professors of known race, academic rank, and gender. We oversampled minority faculty members to achieve sufficient statistical we selected names to signal prospective students’ race (Caucasian, African American, Hispanic, Indian, or Chinese) and 20 names; for details about our analysis confirming the simiAnalysis in the Supplemental Material). An independent samEach participant in our main experiment received one the academic year. (To read the template for e-mails sent in Material.) All messages were sent at 8:00 a.m. and were identical except for two randomized elements: (a) the sender’s race versity of Pennsylvania and Columbia University.Emergence of the temporal crimination when seeking access to faculty in the distant future than when seeking access to faculty in the near future. A of the behavior of all participants in our study revealed that faculty members in the now condition responded at similar rates to Caucasian males (69%) and to minority and female students (67%), logit  = 3,241) = = .368. However, in the later condition, faculty members responded at a significantly higher rate to Caucasian males = 3,307) = () rates revealed a similar pattern: In the now condition, faculty members agreed to meet with Caucasian males (36%) and (1, = 3,241) = 0.03, = .857; however, in the later condition, = 3,307) = .001 (Fig. 1b). In the later condition, participants also dents, whereas there was no such gap in the now condition (see We next used logistic and ordinary least squares regressions to predict whether students’ e-mails elicited a response predictors (temporal distance, minority or female identity, and and controlling for faculty race, gender, and rank; school Temporal Distance and Discrimination ranking of the faculty member; and student-faculty racial analyses, see Analysis in the Supplemental Material.)much weaker in the now condition (Table 1). Exponentiating the beta weights for Model 1 in Table 1 indicated that the odds a Caucasian male; thus, minority and female students’ requests response by 0.79. In other words, Caucasian males fared better when they requested to meet later. However, this pattern was reversed for female and minority students, for whom making a request to meet now (rather than later) multiplied the odds of receiving a response by 1.12. All results held if only Caucasian faculty members’ responses were examined or sample weights The temporal discrimination effect in faculty members’ responses to same-race studentsFor minorities, across conditions, contacting a professor of the same race (rather than a professor of a different race) multiplied the odds of receiving a response by a factor of 1.28 (Table 1, Model 1). However, even professors who received e-mails from ior in the later condition than in the now condition, and our faculty racial match and temporal distance. In other words, the temporal discrimination effect persisted even in the case of faculty members’ responses to students of their own race, a result consistent with prior research demonstrating that individuals nic group (Fershtman & Gneezy, 2001).The persistence of the temporal discrimination effect across negatively stereotyped groupsBecause there are meaningful differences in stereotypes pertaining to different groups (Cuddy et al., 2007), we disaggregated our analyses to examine the effect of temporal distance on faculty members’ responses to students from each group females relative to Caucasian males. Despite differences in stereotypes and empirical differences in levels of bias, participants’ responses to every minority group studied showed a temporal discrimination trend (Table 2), such that each group effect-size estimates and values by group, see Table S5 in the see Analysis in the Supplemental Material).Supplementary analyses: corroborating the effect of temporal distance on construal levelWe content-coded a random sample of faculty members’ replies in order to perform two analyses to test the effective to do so (coded as 1). Replies in the now condition 50556570Request for NowRequest for LaterE-mails That Receiveda Response (%)*** a 3035455055Request for NowRequest for LaterE-mails That Receivedan Acceptance (%)***b Caucasian Male StudentsOther Students Fig. 1. Percentage of faculty members who (a) responded to and (b) agreed to meet with Caucasian male students and other (i.e., female and minority) students as a function of condition (now vs. later). All percentages are sample weighted. Asterisks indicate significant differences between the two groups of students (*** .001). 4 Milkman et al. construal-level theory, results revealed that this was indeed the = 11.39, = 4,392). Our results from these analyses offer convergent evidence that temporal distance shifts decision makers’ than do decisions about near-future events, a phenomenon we call the temporal discrimination effect. We propose that construal-level theory offers the most parsimonious explanation for our findings: Temporal distance generates abstract construals (Trope & Liberman, 2003), which trigger increased Table 1. Results of Regression Analyses Predicting Responses to E-mails From Prospective Students ( PredictorModel 1: response regression)Model 2: response elicited (ordinary least squares regression)Model 3: meeting regression)Model 4: meeting accepted (ordinary least squares regression)Model 5: response speed (Cox proportional-hazards model)Primary predictorsMinority or female studentRequest to meet that dayRequest to Meet That Day × Minority or Female Student Recipient’s ethnicity Recipient’s School Recipient’s faculty rankAssistant professorAssociate professorLog pseudolikelihoodNote: The table presents beta coefficients, with standard errors in parentheses. The dependent variable for Models 1 and 2 was whether the e-mail elicited a response; the dependent variable for Models 3 and 4 was whether the participant accepted the fictional student’s request for a meeting; and the dependent variable for Model 5 was how quickly the participant responded to the e-mail (when a response was not received within 1 week, data were treated as censored). Sample weights were included in all analyses to adjust for oversampling of minority faculty and unequal assignment of participants to conditions; standard errors were clustered by student name. Both ordinary least squares and logistic regression models predicting whether a response was elicited and whether the request was accepted are presented to demonstrate the robustness of the findings to the imperfections of both types of models (ordinary least squares estimates are imperfect for binary outcomes, whereas logit estimates are imperfect for interaction terms, as discussed in Results: Additional Tables and Information, in the Supplemental Material).The highest possible ranking was 1; the lowest-ranked schools were tied for a ranking of “Tier 4,” or 225 (U.S. News & World Report, 2010). 10. * 05. ** 01. *** .001. Temporal Distance and Discrimination 5 +1%+3%–3%+0%+0%–2%–12%–5%–5%–3%–8%–6%–1%–10%–11%–15%–20%–10%–25–20–50510CaucasianFemalesAfricanAmericanFemalesAfricanAmericanMalesAfricanAmerican Females AfricanAmerican Males HispanicFemalesHispanicMalesIndianFemalesIndianMalesChineseFemalesChineseMalesCaucasianFemalesHispanicFemalesHispanicMalesIndianFemalesIndianMalesChineseFemalesChineseMalesResponse Rate Relative to Caucasian Males (%)Request for NowRequest for Later a +5%+8%+0%+1%+1%+4%–8%–4%+1%–1%–8%–9%–3%–6%–16%–16%–11%–14%–25–20–5010Meeting-Acceptance RateRelative to Caucasian Males (%)b Fig. 2. Sample-weighted (a) response rates and (b) meeting-acceptance rates for minorities and females (relative to Caucasian males) in the now and later conditions. The percentage label for each bar is rounded to the nearest whole number. Response rates for Caucasian males were 69% in the now condition and 74% in the later condition; meeting-acceptance rates for Caucasian males were 36% in the now condition and 48% in the later condition. 6 Milkman et al. Table 2. Results of Regression Analyses Predicting Responses to E-mails From Prospective Students in Each of the Minority Groups PredictorModel 6: response regression)Model 7: response elicited (ordinary least squares regression)Model 8: (logistic regression)Model 9: meeting accepted (ordinary least squares regression)Model 10: response speed (Cox proportional-hazards model)Student’s ethnicity or genderFemaleAfrican American × FemaleHispanic × FemaleIndian × FemaleChinese × FemalePrimary predictorsthat dayRequest to Meet That Day × Minority or Female Student Recipient’s ethnicity Recipient’s School Recipient’s faculty rank Assistant professorAssociate professor recipient African recipient Hispanicrecipient Indianrecipient Chinese Log pseudolikelihoodNote: The table presents beta coefficients, with standard errors in parentheses. The dependent variable for Models 6 and 7 was whether the e-mail elicited a response; the dependent variable for Models 8 and 9 was whether the participant accepted the fictional student’s request for a meeting; and the dependent variable for Model 10 was how quickly the participant responded to the e-mail (when a response was not received within 1 week, data were treated as censored). Sample weights were included in all analyses to adjust for oversampling of minority faculty and unequal assignment of participants to conditions; standard errors were clustered by student name.The highest possible ranking was 1; the lowest ranked schools were tied for a ranking of “Tier 4,” or 225 (U.S. News & World Report, 2010). * ** *** 8 Milkman et al. Observations are sample weighted (similarly, all regressions level mind-set mediated the observed effects, because we used the content of participants’ e-mails as a measure of their mind-sets, we effect was driven by nonrespondents, mediation analysis was not The temporal discrimination effect for Asians was smaller for e-mails sent to faculty members in other fields, but this difference ReferencesBertrand, M., & Mullainathan, S. (2004). Are Emily and Greg more employable than Lakisha and Jamal? A field experiment on labor The American Economic ReviewBodenhausen, G. V., & Macrae, C. N. (1998). Stereotype activation and inhibition. In R. S. Wyer, Jr. (Ed.), Stereotype activation and inhibition: Advances in social cognition (Vol. 11, pp. 1–52). Cochran, W. G. (1963). . New York, NY: Wiley.Cuddy, A. J., Fiske, S. T., & Glick, P. (2007). The BIAS map: Behaviors from intergroup affect and stereotypes. Journal of PersonalDovidio, J. F., & Gaertner, S. L. (2000). Aversive racism and What do we know, how do we know it, and what do we need to Teachers College Record, 1119–1146.Fershtman, C., & Gneezy, U. (2001). Discrimination in a segmented society: An experimental approach. 116Greenwald, A. G., Oakes, A. M., & Hoffman, H. G. (2003). Targets of discrimination: Effects of race on responses to weapon holders. Hugenberg, K., & Bodenhausen, G. V. (2003). Facing prejudice: Psychology of Women QuarterlyLiberman, N., & Trope, Y. (1998). The role of feasibility and desirability considerations in near and distant future decisions: A test of temporal construal theory. Loewenstein, G. (1996). Out of control: Visceral influences on behavior. Organizational Behavior and Human Decision ProcessesMassey, D. S., & Lundy, G. (2001). Use of black English and racial discrimination in urban housing markets: New methods and findUrban Affairs ReviewMcCrea, S. M., Wieber, F., & Myers, A. L. (2012). Construal level Milkman, K. L., Rogers, T., & Bazerman, M. H. (2008). Harnessing our inner angels and demons: What we have learned about Schwab, S. J. (1986). Is statistical discrimination efficient? Shiv, B., & Fedorikhin, A. (1999). Heart and mind in conflict: The interplay of affect and cognition in consumer decision making. Journal of Consumer ResearchSkiba, R. J., Michael, R. S., Nardo, A. C., & Peterson, R. L. (2002). The color of discipline: Sources of racial and gender disproporStephan, E., Liberman, N., & Trope, Y. (2010). Politeness and psychological distance: A construal level perspective. Trope, Y., & Liberman, N. (2003). Temporal construal. 110Trope, Y., & Liberman, N. (2010). Construal-level theory of psycho117U.S. News & World Report. (2010). . Retrieved from http://colleges.usnews.rankingsand