/
National Health Expenditures  Highlights In  U National Health Expenditures  Highlights In  U

National Health Expenditures Highlights In U - PDF document

lois-ondreau
lois-ondreau . @lois-ondreau
Follow
407 views
Uploaded On 2015-06-14

National Health Expenditures Highlights In U - PPT Presentation

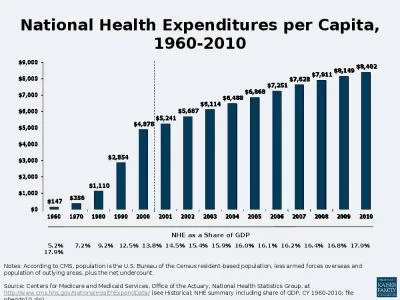
S health care spending increased 36 percent to reach 29 trillion or 9255 per person the fifth consecutive year of slow growth in the range of 36 percent and 41 percent The share of the economy devoted to health spending has remained at 174 percent si ID: 86143

health care spending increased

Share:

Link:

Embed:

Download Presentation from below link

Download Pdf The PPT/PDF document "National Health Expenditures Highlights..." is the property of its rightful owner. Permission is granted to download and print the materials on this web site for personal, non-commercial use only, and to display it on your personal computer provided you do not modify the materials and that you retain all copyright notices contained in the materials. By downloading content from our website, you accept the terms of this agreement.


Presentation Transcript

National Health Expenditures 201 7 Highlights U.S. health care spending increased 3.9 percent to reach $ 3 . 5 trillion , or $ 10, 739 per person in 201 7 . Health care spending growth in 201 7 was similar to average growth from 2008 to 2013, which preceded the faster growth experienced during the 2014 - 15 period that was marked by insurance coverage expansion and high rates of growth in retail prescription drug spending. The overall share of gr oss domestic product (GDP) related to health care spending was 17.9 percent in 201 7 , similar to that in 2016 (18.0 percent) . H ealth Spending by Type of Service or Product:  Hospital Care ( 33 percent share ) : S pending for hospital care increased 4. 6 percent to $1.1 trillion in 201 7 , which was slower than the 5. 6 percent growth in 201 6 . The slower growth in 201 7 was driven by slower growth in th e use and intensity of services. Hospital c are expenditures slowed among the major payers — private health insurance , Medicare, and Medic aid .  Physician and Clinical Services (20 percent share ) : Spending on p hysician and c linical services increased 4.2 percent to $ 6 94 . 3 billion in 201 7 . Growth for physician and clinical services slowed in 2017 and was driven by growth in non - price factors such as use and intensity of services. Although slowing, g rowth in clinical services continued to outpace the growth in physician services in 2017 .  Retail Prescription Drugs (10 percent share) : Growth in r etail p rescription drug spending slowed in 201 7 , increasing 0 . 4 percent to $3 33 . 4 billion . The slower growth in 2017 follow ed 2.3 percent growth in 2016, and was the lowest growth in retail prescription drug spending since 2012, when several blockbuster drugs los t patent protection. The key drivers of the slower growth w ere a continued shift to lower - cost generic drugs and slower growth in the sales volume of some high - cost drugs.  Other Health, Residential, and Personal Care Services (5 percent share) : Spending for other health, residential, and personal care services grew 5.6 percent in 2017 to $ 183.1 billion after increasing 5.3 percent in 2016 . The slight acceleration was driven by faster growth in residential mental health and substance abuse facilities and a mbulance services. This category includes expenditures for medical services that are generally delivered by providers in non - traditional settings such as schools, community centers, and the workplace; as well as by ambulance providers and residential menta l health and substance abuse facilities.  Nursing Care Facilities and Continuing Care Retirement Communities (5 percent share): Growth in s pending for freestanding nursing care facilities and continuing care retirement communities decelerated in 2017, grow ing 2.0 percent to $166.3 billion compared to 3.1 percent growth in 2016. The slower growth in 2017 is largely attributable to slower spending growth in both out - of - pocket and private health insurance spending .  Dental Services (4 percent share) : Spending for dental services increased 3.2 percent in 2017 to $ 129 . 1 billion , decelerating from 5.2 percent growth in 2016 . Private health in suranc e (which accounted for 45 percent of dental spending ) increased 2 .8 percent in 201 7 — a slowdown from growth of 5.3 percent in 2016 . Out - of - pocket spending for dental services (which accounted for 41 percent of dental spending) also slowed, growing 2.5 percent in 2017 , after growth of 5.0 percent in 2016 .  Home Health Care (3 percent share) : Spending for freestanding home health care agencies increased 4.3 percent in 2 01 7 , the same rate as 2016 , to $ 97.0 billion . S lower growth in Medicaid spending and private health insurance spending was offset by faster Medicare spending and out of pocket spending . Medicare and Medicaid together made up 76 percent of home health spending in 201 7 .  Other Professional Services (3 percent share): Spending for other professional services reached $96.6 billion in 2017 and increased 4.6 percent, a slower rate of growth co mpared to the increase of 5.1 percent in 2016. Spending in this category includes establishments of independent health practitioners (except physicians and dentists) that primarily provide services such as physical therapy, optometry, podiatry, or chiropra ctic medicine.  Other Non - durable Medical Products (2 percent share) : Retail s pending for other non - durable medical products, such as over - the - counter medicines, medical instruments, and surgical dressings, grew 2.2 percent (slower than the rate of growth in 2016 of 4.1 percent) to $ 64.1 billion in 2017 .  Durable Medical Equipment (2 percent share) : Retail s pending for durable medical equipment , which includes items such as contact lenses, eyeglasses and hearing aids, reached $54.4 billion in 2017 and increased 6.8 percent , which was faster than the 4.9 percent growth in 2016 . The faster growth was driven by an acceleration in Medicare spending as well as continued strong growth in private health insurance and out of pocket spending which account for almost 70 percent of total durable medical equipment spending. Health Spending by Major Sources of Funds:  Private Health Insurance (34 percent share) : P rivate health insurance spending increased 4.2 percent to $ 1.2 trillion in 2017 , which was slower than 6.2 percent growth in 2016 . The deceleration was driven in part by slower growth in medical benefits and a decline in fees and taxes resulting from the Consolidated Appropriations Act of 2016, which suspended collection of the health insurance plan fee in 2017.  Medicare (20 percent s hare) : Medicare spending grew 4.2 percent to $ 705.9 billion in 2017 , which was similar to the rate of growth in 2016 of 4.3 percent. The growth in 2017 reflected slower growth in spending for Medicare fee - for - service ( 2. 6 percent in 2016 to 1. 4 percent in 2017 ) that was almost entirely offset by faster growth in Medicare spending for private health plans ( 8.1 percent in 2016 to 10.0 percent in 201 7 ) .  Medicaid (17 percent share) : Total Medicaid spending decelerate d in 2017 , increasing 2 .9 percent to $581.9 billion compared to growth of 4.2 percent in 2016 . The slower growth in 2017 was influenced by slower growth in enrollment and a reduction in the Medicaid net cost of health insurance. S tate and local Medicaid expenditures grew 6.4 percent , while f ederal Medic aid expenditures increased 0.8 percent in 2017 .  Out - of - Pocket (1 0 percent share) : Out - of - pocket spending grew 2.6 percent in 2017 to $ 3 65 . 5 billion , which was slower than 4.4 percent growth in 2016 . Health Spending by Type of Sponsor 1 :  I n 2017 , the federal government and households accounted for the largest share s of spending ( at 2 8 percent each ) followed by private businesses (20 percent), and state and local governments (17 percent).  Federal government s pending on health slowed in 201 7 , increasing 3. 2 percent after 4.9 percent growth in 2016 . The deceleration was largely associated with slower federal Medicaid spending . Despite the slower growth , the federal government’s share of health care spending remained at 28 percent.  Health spending by households grew at a rate of 3.8 percent , which was a deceleration from 4.8 percent in 2016 . The slower growth in 2017 was largely due to a deceleration in out - of - pocket spending . Out - of - pocket expenditures, the largest category of hous ehold spending (37 percent share), increased 2.6 percent in 2017 compared to growth of 4.4 percent in 2016 . Despite the slower growth in 2017 , households represented 28 of health care spending, a share that has remained unchanged since 2014.  Health care financed by s tate and local government s grew 4. 1 percent in 2017, an acceleration from 3 .8 percent growth in 2016 . The faster growth was driven by increases in state and local Medicaid spending , which represent ed 37 percent of state and local g overnment health spending. S tate and local government’s share of health care spending remained at 17 percent, a share that has been relatively stable since 2014.  Spending on health care by p rivate businesses slowed in 2017 , increasing 4.1 percent compared to 5.5 percent growth in 2016 . The largest category of private business health care costs are employer - sponsored premiums , which increased 4. 6 percent in 2017 . The private business share of overall health spending remained fairl y steady s ince 2010, at about 20 percent. 1 Type of sponsor is defined as the entity that is ultimately responsible for financing the health ca re bill, such as private business es , household s, and government s . These sponsors pay health insurance premiums and out - of - pocket costs, or finance health care through dedicated taxes and/ or general revenues. �� &#x/Att;¬he; [/; ott;&#xom ];&#x/Sub;&#xtype;&#x /Fo;&#xoter;&#x /Ty;&#xpe /;&#xPagi;&#xnati;&#xon 0;&#x/Att;¬he; [/; ott;&#xom ];&#x/Sub;&#xtype;&#x /Fo;&#xoter;&#x /Ty;&#xpe /;&#xPagi;&#xnati;&#xon 0; &#x/MCI; 0 ;&#x/MCI; 0 ;Despite the slower growth, the federal government’s share of health care spending remained at 28 percent. Health spending by households grew at a rate of 3.8 percent, which was a deceleration from 4.8 percent in 2016. The slower growth in 2017 was largely due to a deceleration in out-of-pocket spending. Out-of-pocket expenditures, the largest category of household spending (37 percent share), increased 2.6 percent in 2017 compared to growth of 4.4 percent in 2016. Despite the slower growth in 2017, households represented 28 of health care spending, a share that has remained unchanged since 2014. Health care financed by state and local governments grew 4.1 percent in 2017, an acceleration from 3.8 percent growth in 2016. The faster growth was driven by increases in state and local Medicaid spending, which represent37 percent of state and local government health spending. tate and local government’s share of health care spending remained at 17 percent, a share that has been relatively stable since 2014. Spending on health care by private businesses slowed in 2017, increasing 4.1 percent compared to 5.5 percent growth in 2016. The largest category of private business health care costs are employer-sponsored premiums, which increased 4.6 percent in 2017. The private business share of overall health spending remained fairly steady since 2010, at about 20 percent. 1 Type of sponsor is defined as the entity that is ultimately responsible for financing the health care bill, such as private business, households, and governments. These sponsors pay health insurance premiums and out-of-pocket costs, or finance health care through dedicated taxes and/or general revenues. �� &#x/MCI; 0 ;&#x/MCI; 0 ;National Health Expenditures 2017 Highlights U.S. health care spending increased 3.9 percent to reach $3.5 trillion, or $10,739 per person in 2017. Health care spending growth in 2017 was similar to average growth from 2013, which preceded the faster growth experienced during the 2014-15 period that was marked by insurance coverage expansion and high rates of growth in retail prescription drug spending. The overall share of gross domestic product (GDP) related to health care spending was 17.9 percent in 2017, similar to that in 2016 (18.0 percent).Health Spending by Type of Service or Product: Hospital Care (33 percent share)Spending for hospital care increased 4.6 percent to $1.1 trillion in 2017which was slower than the 5.6 percent growth in 2016. The slower growth in 2017 was driven by slower growth in the use and intensity of services. Hospital care expenditures slowed among the major payersprivate health insurance, Medicare, and Medicaid. Physician and Clinical Services (20 percent share): Spending onphysician and clinical services increased 4.2 percent 94.3 billion in 2017. Growth for physician and clinical services slowed in 2017 and was driven by growth in non-price factors such as use and intensity of services. Although slowing, growth in clinical services continued to outpace the growth in physician services in 2017. Retail Prescription Drugs (10 percent share): Growth inretail prescription drug spending slowed in 2017, increasing 0.4 percent to $333.4 billion. The slower growth in 2017 followpercent growth in 2016, and was the lowest growth in retail prescription drug spending since 2012, when several blockbuster drugs lost patent protection. The key drivers of the slower growth were a continued shift to lower-cost generic drugs and slower growth in the sales volume of some high-cost drugs. Other Health, Residential, and Personal Care Services (5 percent share): Spending for other health, residential, and personal care services grew 5.6 percent in 2017 to $183.1 billion after increasing 5.3 percent in 2016. The slight acceleration was driven by faster growth in residential mental health and substance abuse facilities and ambulance services. This category includes expenditures for medical services that are generally delivered by providers in non-traditional settings such as schools, community centers, and the workplace; as well as by ambulance providers and residential mental health and substance abuse facilities. Nursing Care Facilities and Continuing Care Retirement Communities (5 percent share): Growth in spending for freestanding nursing care facilities and continuing care retirement communities decelerated in 2017, growing 2.0 percent to $166.3 billion compared to 3.1 percent growth in 2016. The slower growth in 2017 is largely attributable to slower spending growth in both out-of-pocket and private health insurance spending. Dental Services (4 percent share)Spending for dental services increased 3.2 percent in 2017 to 129.1 billion, decelerating from 5.2 percent growth in 2016. Private health insurance (which accounted for 45 percent of dental spending) increased 2.8 percent in 2017a slowdown from growth of 5.3 percent in 2016.Out-of-pocket spending for dental services (which accounted for 41 percent of dental spending) also slowed, growing 2.5 percent in 2017, after growth of 5.0 percent in 2016. Home Health Care (3 percent share)Spending for freestanding home health care agencies increased 4.3 percent the same rate as 2016to $97.0billion. Slower growth Medicaid National Health Expenditures 2017 Highlights U.S. health care spending increased 3.9 percent to reach $3.5 trillion, or $10,739 per person in 2017. Health care spending growth in 2017 was similar to average growth from 2013, which preceded the faster growth experienced during the 2014-15 period that was marked by insurance coverage expansion and high rates of growth in retail prescription drug spending. The overall share of gross domestic product (GDP) related to health care spending was 17.9 percent in 2017, similar to that in 2016 (18.0 percent).Health Spending by Type of Service or Product: Hospital Care (33 percent share)Spending for hospital care increased 4.6 percent to $1.1 trillion in 2017which was slower than the 5.6 percent growth in 2016. The slower growth in 2017 was driven by slower growth in the use and intensity of services. Hospital care expenditures slowed among the major payersprivate health insurance, Medicare, and Medicaid. Physician and Clinical Services (20 percent share): Spending onphysician and clinical services increased 4.2 percent 94.3 billion in 2017. Growth for physician and clinical services slowed in 2017 and was driven by growth in non-price factors such as use and intensity of services. Although slowing, growth in clinical services continued to outpace the growth in physician services in 2017. Retail Prescription Drugs (10 percent share): Growth inretail prescription drug spending slowed in 2017, increasing 0.4 percent to $333.4 billion. The slower growth in 2017 followpercent growth in 2016, and was the lowest growth in retail prescription drug spending since 2012, when several blockbuster drugs lost patent protection. The key drivers of the slower growth were a continued shift to lower-cost generic drugs and slower growth in the sales volume of some high-cost drugs. Other Health, Residential, and Personal Care Services (5 percent share): Spending for other health, residential, and personal care services grew 5.6 percent in 2017 to $183.1 billion after increasing 5.3 percent in 2016. The slight acceleration was driven by faster growth in residential mental health and substance abuse facilities and ambulance services. This category includes expenditures for medical services that are generally delivered by providers in non-traditional settings such as schools, community centers, and the workplace; as well as by ambulance providers and residential mental health and substance abuse facilities. Nursing Care Facilities and Continuing Care Retirement Communities (5 percent share): Growth in spending for freestanding nursing care facilities and continuing care retirement communities decelerated in 2017, growing 2.0 percent to $166.3 billion compared to 3.1 percent growth in 2016. The slower growth in 2017 is largely attributable to slower spending growth in both out-of-pocket and private health insurance spending. Dental Services (4 percent share)Spending for dental services increased 3.2 percent in 2017 to 129.1 billion, decelerating from 5.2 percent growth in 2016. Private health insurance (which accounted for 45 percent of dental spending) increased 2.8 percent in 2017a slowdown from growth of 5.3 percent in 2016. Out-of-pocket spending for dental services (which accounted for 41 percent of dental spending) also slowed, growing 2.5 percent in 2017, after growth of 5.0 percent in 2016. Home Health Care (3 percent share)Spending for freestanding home health care agencies increased 4.3 percent the same rate as 2016to $97.0 billion. Slower growth Medicaid