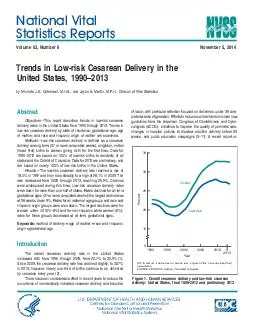
/
National Vital Statistics Reports Volume  Number Novem National Vital Statistics Reports Volume  Number Novem

National Vital Statistics Reports Volume Number Novem - PDF document

lois-ondreau
lois-ondreau . @lois-ondreau
Follow
496 views
Uploaded On 2015-04-08

National Vital Statistics Reports Volume Number Novem - PPT Presentation

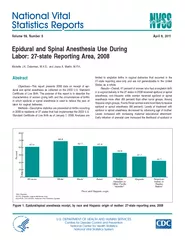
K Osterman MHS and Joyce A Martin MPH Division of Vital Statistics Abstract Objectives This report describes trends in lowrisk cesarean delivery rates in the United States from 1990 through 2013 Trends in lowrisk cesarean delivery by state of residen ID: 49949

Osterman MHS and Joyce

Share:

Link:

Embed:

Download Presentation from below link

Download Pdf The PPT/PDF document "National Vital Statistics Reports Volume..." is the property of its rightful owner. Permission is granted to download and print the materials on this web site for personal, non-commercial use only, and to display it on your personal computer provided you do not modify the materials and that you retain all copyright notices contained in the materials. By downloading content from our website, you accept the terms of this agreement.


Presentation Transcript

Statistics Reports VolumeTrendsM.P.H.,Vital 15 20 25 0 30 35 SOURCE: CDC/NCHS, National Vital Statistics System. Year Overall Low risk Figure 1. Overall cesarean delivery and low-risk cesarean delivery: United States, final 1990–2012 and preliminary 2013 U.S. DEPARTMENT OF HEALTH AND HUMAN SERVICES Centers for Disease Control and Prevention National Center for Health Statistics National Vital Statistics System ��2 National VitalVol.ingly,, singleton, vertex (head first) presentation] cesarean delivery rate among women with no prior cesarean (14). Similarly,Commission’sdelivery,however,Trendsmother,mother.differentdifferencesTechnicaldifferencesTechnicaldifferencesTableyear,delivery,TableTableVirginiaTableYearTotalTotal20111,1978,411797,119 delivery.TableTechnical ��3 National VitalVol.TableTableTableTableTableTableTableTableTable11%)Table 10%–14% decline 15% or more decline 5%–9% decline 1%–4% decline WA OR CA NV ID MT WY UT CO AZ NM AK TX OK KS NE SD ND MN IA MO AR LA MS TN KY IN WI MI OH NY ME IL AL GA FL SC NC VAWV PA HI MD DE NJ CT RI MANH VT DC SOURCE: CDC/NCHS, National Vital Statistics System. delivery, ��4 National VitalVol.Tableoffdifferhowever,Technicaldifference.study,TechnicalTechnicaldelivery,labor,EffortsCommission’sTabledelivery,mother, 20132009 20 22 0 26 30 32 28 Percent 37–38 37 38 39–40 39 40 41 42 or more SOURCE: CDC/NCHS, National Vital Statistics System. Late term Postterm delivery, ��5 National VitalVol. Percent 40 and over Age of mother SOURCE: CDC/NCHS, National Vital Statistics System. delivery, ��6 National VitalVol. ��7 National VitalVol.Availablehttp://www.cdc.gov/nchs/data/nvsr/nvsr62/nvsr62_09.pdfAvailablehttp://www.cdc.gov/nchs/data/nvsr/nvsr63/nvsr63_02.pdf110(6):1501.labor.114(2):386–97.Dang-KilduffAvailablehttp://www.39weeksfl.comEF,T.labor.118(6):1473–4.2011.KoffordeffectivenessWomen’sAvailablehttp://www.health4mom.org/11.baby.Availablehttp://www.marchofdimes.com/pregnancy/getready_atleast39weeks.1996–2011.1. Hyattsville, MD: National Center for Health Statistics. Availablehttp://www.cdc.OfficeWashington,Availablehttp://www.healthypeople.gov/2010 NOTES: Low risk is defined as nulliparous, term, singleton births in a vertex (head first) presentation. Thirty seven and 38 weeks are early term; 39 and 40 weeks are full term; SOURCE: CDC/NCHS, National Vital Statistics System. * * Non-Hispanic white Non-Hispanic black Hispanic Percent Race and Hispanic origin 37 38 39 40 41 42 or more Gestational age (weeks) delivery, ��8 National VitalVol.AvailableEF,118(1):29–38.2011.113(1):33–40.WashingtonF.TrendsAvailableAvailableOfficeWashington,Availablehttp://www.healthypeople.gov/2020/topicsobjectives2020/objectiveslist.Availabledelivery.123(3):693–711.Availablehttp://www.cdc.gov/nchs/data/dvs/birth11Availablehttp://www.cdc.gov/nchs/data/pregnancy.122(5):1139–40.OfficeTablesdelivery,andpreliminary201310delivery,11delivery,preliminary201312 ��9 National VitalVol.Tableable place of residence. Data are based on a continuous file of records received from the states] &#x/MCI; 3 ;&#x/MCI; 3 ;Number &#x/MCI; 4 ;&#x/MCI; 4 ;Percent &#x/MCI; 5 ;&#x/MCI; 5 ;Percent change &#x/MCI; 50;� 00;&#x/MCI; 50;� 00;1997 and &#x/MCI; 50; 00;&#x/MCI; 50; 00;2009 and &#x/MCI; 50; 00;&#x/MCI; 50; 00;Area &#x/MCI; 49; 00;&#x/MCI; 49; 00;2013 &#x/MCI; 50; 00;&#x/MCI; 50; 00;2009 &#x/MCI; 50; 00;&#x/MCI; 50; 00;1997 &#x/MCI; 49; 00;&#x/MCI; 49; 00;2013 &#x/MCI; 49; 00;&#x/MCI; 49; 00;2009 &#x/MCI; 49; 00;&#x/MCI; 49; 00;1997 &#x/MCI; 50; 00;&#x/MCI; 50; 00;2009 &#x/MCI; 50; 00;&#x/MCI; 50; 00;2013 &#x/MCI; 17;&#x 000;&#x/MCI; 17;&#x 000;United States ................. &#x/MCI; 18;&#x 000;&#x/MCI; 18;&#x 000;341,532 &#x/MCI; 19;&#x 000;&#x/MCI; 19;&#x 000;382,896 &#x/MCI; 20;&#x 000;&#x/MCI; 20;&#x 000;241,734 &#x/MCI; 21;&#x 000;&#x/MCI; 21;&#x 000;26.9 &#x/MCI; 22;&#x 000;&#x/MCI; 22;&#x 000;28.1 &#x/MCI; 23;&#x 000;&#x/MCI; 23;&#x 000;18.4 &#x/MCI; 24;&#x 000;&#x/MCI; 24;&#x 000;53 &#x/MCI; 25;&#x 000;&#x/MCI; 25;&#x 000;–4 &#x/MCI; 26;&#x 000;&#x/MCI; 26;&#x 000;Alabama.................... &#x/MCI; 27;&#x 000;&#x/MCI; 27;&#x 000;6,016 &#x/MCI; 28;&#x 000;&#x/MCI; 28;&#x 000;6,940 &#x/MCI; 29;&#x 000;&#x/MCI; 29;&#x 000;4,664 &#x/MCI; 30;&#x 000;&#x/MCI; 30;&#x 000;31.2 &#x/MCI; 31;&#x 000;&#x/MCI; 31;&#x 000;32.4 &#x/MCI; 32;&#x 000;&#x/MCI; 32;&#x 000;21.5 &#x/MCI; 33;&#x 000;&#x/MCI; 33;&#x 000;51 &#x/MCI; 34;&#x 000;&#x/MCI; 34;&#x 000;–4 &#x/MCI; 35;&#x 000;&#x/MCI; 35;&#x 000;Alaska ..................... &#x/MCI; 36;&#x 000;&#x/MCI; 36;&#x 000;7136805032,116932869647 Idaho ..................... 1,336 1,438 724 19.8 19.5 12.8 52 * Illinois ..................... 12,941 15,601 10,101 25.3 27.2 16.8 62 –7 Indiana .................... 6,614 7,161 5,102 24.3 25.1 17.9 40 –3 Iowa ...................... 3,027 3,283 1,931 24.3 25.2 16.0 58 * Kansas .................... 2,965 3,329 1,897 24.2 24.8 15.5 60 * Kentucky ................... 5,782 6,303 3,431 30.7 31.5 19.1 65 * Louisiana ................... 5,910 7,821 5,264 31.4 35.6 23.1 54 –12 Maine ..................... 1,125 1,307 819 24.5 25.2 16.6 52 * Maryland ................... 7,495 8,043 4,671 30.6 30.4 19.8 54 * Massachusetts................. 5,303 8,091 5,008 22.9 28.2 16.8 68 –19 Michigan.................... 10,522 10,250 7,651 28.1 27.2 17.4 56 3 Minnesota ................... 4,737 5,385 2,992 21.4 23.0 14.6 58 –7 Mississippi................... 3,538 4,545 3,324 30.7 32.9 23.5 40 –7 Missouri .................... 6,039 7,054 4,132 24.9 27.0 16.8 61 –8 Montana .................... 1,004 1,022 573 25.1 24.3 15.9 53 1,711NewYork11,892–11733686401–11968–11727784503 TennesseeTexasVermont523597344Virginia11,898WashingtonWestVirginiaWyoming555606300100 VitalVol. Tabledelivery,YearTotalTotal2011 201127,411201,611 68,511119,950116,920100 ��National VitalVol.Tabledelivery,Year2011 54,113201154,511211,370 8,91174,51173,114155,117100 Tabledelivery,–116,811 –11–11648617 801–11–11852764410471–11177161858 928902539536184165VitalVol. Tabledelivery, –115,115–11 2,5113,112735721226185 –11308282118100VitalVol. VitalVol.Technical‘‘Births:2013’’Prevention’sVitalyear,Table‘‘UserFile’’order,plurality,delivery.‘‘GuideWorksheetsRevision)’’Table‘‘UserFile’’VertexVertexdifferentlyTodelivery,TableYearTotal20114,1 4,1delivery. ��National VitalVol.‘‘finaldelivery’’‘‘methoddelivery’’differentmother,mother’sinfant’smother’smother,mother.Office‘‘UserFile’’ VitalVol.DEPARTMENTHEALTHSERVICES3311ToledoPOSTAGEPAIDPENALTYPRIVATE$300Forhttp://www.cdc.gov/nchs/products/nvsr.htm StateofresidenceGestationalageAgeofmotherRaceandHispanicoriginDataqualityListofDetailedTablesTechnicalNotesVitalreview.OfficeStaff:Trendshowever,VitalM.P.H.,M.P.H.,P.M.P.,http://www.cdc.gov/nchs/govdelivery.htmTel:TTY:http://www.cdc.gov/nchs2014–1120