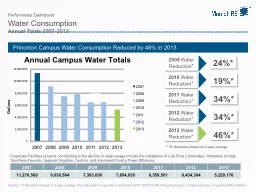
Water Consumption Annual Totals 20072013 Princeton Campus Water Consumption Reduced by 46 in 2013 2007 2008 2009 2010 2011 2012 2013 11276589 9036564 7393606 7854030 6359501 ID: 243282
Download Presentation The PPT/PDF document "Performance Dashboard" is the property of its rightful owner. Permission is granted to download and print the materials on this web site for personal, non-commercial use only, and to display it on your personal computer provided you do not modify the materials and that you retain all copyright notices contained in the materials. By downloading content from our website, you accept the terms of this agreement.
Slide1
Performance Dashboard
Water ConsumptionAnnual Totals 2007-2013
Princeton Campus Water Consumption Reduced by 46% in 2013
2007
20082009201020112012201311,276,5899,036,5647,393,6067,854,0306,359,5016,434,3045,229,176
2009 Water Reduction*
Gallons
24%*
2010
Water Reduction*
19%*
Source:* % Reduction based on 5-year average of actual water consumption billed from 2002–2007 (9,708,648 gallons) prior to implementation of sustainability initiative
* % Reduction based on 5-year average
Corporate Facilities projects contributing to the decline in water usage include the installation of Low Flow Commodes, Waterless Urinals, Touchless Faucets, Upgrade Irrigation Controls, and Improved Cooling Tower Efficiency.
2011 Water Reduction*
34%*
2012
Water Reduction
*
34%*
2013
Water Reduction
*
46%*