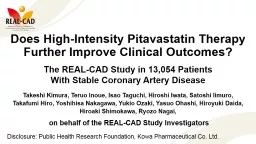
/
Does High-Intensity Pitavastatin Therapy Further Improve Clinical Outcomes? Does High-Intensity Pitavastatin Therapy Further Improve Clinical Outcomes?

Does High-Intensity Pitavastatin Therapy Further Improve Clinical Outcomes? - PowerPoint Presentation

luanne-stotts
luanne-stotts . @luanne-stotts
Follow
393 views
Uploaded On 2018-03-21

Does High-Intensity Pitavastatin Therapy Further Improve Clinical Outcomes? - PPT Presentation

The REALCAD Study in 13054 Patients With Stable Coronary Artery Disease Disclosure Public Health Research Foundation Kowa Pharmaceutical Co Ltd Takeshi Kimura Teruo Inoue Isao Taguchi Hiroshi Iwata Satoshi Iimuro ID: 659743

patients pitavastatin years study pitavastatin patients study years event statins ldl coronary dose therapy cad endpoint high 214 revascularization

Share:

Link:

Embed:

Download Presentation from below link

Download Presentation The PPT/PDF document "Does High-Intensity Pitavastatin Therapy..." is the property of its rightful owner. Permission is granted to download and print the materials on this web site for personal, non-commercial use only, and to display it on your personal computer provided you do not modify the materials and that you retain all copyright notices contained in the materials. By downloading content from our website, you accept the terms of this agreement.


Presentation Transcript

Slide1

Does High-Intensity Pitavastatin Therapy Further Improve Clinical Outcomes?The REAL-CAD Study in 13,054 Patients With Stable Coronary Artery Disease

Disclosure: Public Health Research Foundation, Kowa Pharmaceutical Co. Ltd.

Takeshi Kimura, Teruo Inoue, Isao Taguchi, Hiroshi Iwata, Satoshi Iimuro,

Takafumi Hiro, Yoshihisa Nakagawa, Yukio Ozaki, Yasuo Ohashi, Hiroyuki Daida, Hiroaki Shimokawa,

Ryozo

Nagai,

on behalf of the REAL-CAD Study InvestigatorsSlide2

BackgroundsRecommendations for Lipid-lowering Therapy in Patients with Established CADACC/AHA guideline: High-intensity statin therapyatorvastatin 40/8

0mg, rosuvastatin 20/40mg, or simvastatin 8

0

mg

Previous “More versus Less” Statins Trials

More vs less statinPROVE−ITTNTIDEALSEARCHA to Z

0.650.620.550.390.30

  406 (11.3%) 889 (4.0%) 938 (5.2%)1,347 (3.6%) 257 (7.2%)

  458 (13.1%)1,164 (5.4%)1,106 (6.3%)1,406 (3.8%) 282 (8.1%)

Trend: χ21=12.4(p=0.0004)

0.85 (0.82-0.89)p<0.0001

LDL-C Reduction (mmol/L)

Events (% per annum)

Statin/more

Control/less

Unweighted RR (CI)

Cholesterol Treatment Trialists’ (CTT) Collaboration. Lancet 2010; 376: 1670-81.

4,416/19,783

(5.3%)

3,837/19,829

(4.5%)

0.51

Subtotal (5 trials)Slide3

Backgrounds and ObjectivesHowever, the high-intensity statins are not widely used in daily clinical practice, particularly in Asia. No clear evidence regarding “more versus less” statins has been established in Asian population. Most of the doses of high-intensity statin therapy defined in the ACC/AHA guideline are not approved in Japan. Furthermore, maximum approved doses of statins are prescribed only very infrequently in Japan.

Therefore, we sought to determine whether higher-dose statin therapy would be beneficial in Japanese patients in the largest-ever trial comparing the efficacy of high-dose versus low-dose statin therapy in patients with established stable CAD. Slide4

REAL-

C

AD

(

Randomized Evaluation of Aggressive or Moderate

Lipid Lowering Therapy with

Pitavastatin

in Coronary Artery Diseas

e

)

A prospective, multi-center, randomized, open-label, blinded endpoint, physician-initiated trial to determine whether high-dose as compared with low-dose

pitavastatin

therapy within the approved

dose range could reduce CV events in Japanese patients with stable CAD.

Eligibility:

Consent

for

enrollment

Pitavastatin

1

mg/day

Randomization

Pitavastatin

1

mg/day

Pitavastatin

4

mg/day

LDL-C <12

0

mg/

dL

Jan. 2010

~ Mar. 2013

Jan. ~ Mar. 2016

Run-in Period (>1 month)

Follow-up (36-60 months)

Pitavastatin

1

mg and

4

mg have LDL-C lowering effect comparable to atorvastatin

5

mg and 2

0

mg, respectively.

Men and women, 20-8

0

years of age

Stable CAD:

ACS or PCI/CABG >

3

months

Clinical diagnosis of CAD with coronary stenosis ≥5

0

% diameter stenosis

LDL-C <12

0

mg/

dL

on

pitavastatin

1

mg/day during the run-in periodSlide5

Study DesignPrimary Endpointa composite of CV death, non-fatal MI, non-fatal ischemic stroke, or unstable angina requiring emergency hospitalization

Sample size calculation

Hypothesis: 16% relative risk reduction with the high-dose

pitavastatin

TxAssumptions: Annual primary endpoint event rate of 2.5%, Drop-out rate of 10%Sample size: 12,600 patients were to be enrolled with anticipated 1,033 events during the planned 3 years of enrollment and at least 3 years of follow-up.Power: 80%, Alpha: 0.05

The actual event rate was lower than anticipated. On October 27, 2015, the steering committee decided not to extend the study further despite the original event-driven trial design, because substantial number of centers were reluctant to extend the study further.Slide6

Study Patient Flow

Enrolled

N=14,774

Randomized

N=13,054

Excluded

N=1,720

Withdrawal/Missing consent

N=790

Other reasons

N=930

Pitavastatin

1

mg

N=6,528

Pitavastatin

4

mg

N=6,526

Withdrawal/Missing consent

N=100

Withdrawal/Missing consent

N=136

Safety analysis set (SAS)

N=6,428

Safety analysis set (SAS)

N=6,390

Not meeting the eligibility

N=214

ACS within 3 months N=35LDL-C <100 mg/

dL without statins N=76 LDL-C ≥120 mg/dL at randomization N=105

Not meeting the eligibility N=191ACS within 3 months N=16LDL-C <100 mg/dL without statins N=76LDL-C ≥120 mg/dL at randomization N=101

Full analysis set (FAS) N=6,214

Full analysis set (FAS) N=6,199

Follow-up period [median]: 3.9 (0.0-5.9) years1 year FU completed: 96.9%

 Final FU completed beyond Jan. 2016: 83.2%Follow-up period [media

n]: 3.9 (0.0-5.8) years1 year FU completed: 97.0% Final FU completed beyond Jan. 2016: 83.4%

Jan. 2010 – Mar. 2013

733 Japanese centersSlide7

Baseline Characteristics

Variables

Pitavastatin 1 mg (N=6,214)

Pitavastatin 4 mg (N=6,199)

Age — years

68.1±8.3

68.0±8.3

Male sex

83%

83%

BMI — kg/m

2

24.6±3.4

24.6±3.3

Hypertension

75%

76%

Diabetes mellitus

40%

40%

Current smoking

16%

17%

History of ACS

72%

72%

ACS within 1 year before randomization

24%

24%

Coronary revascularization

91%

90%

Revascularization within 1 year before randomization

28%

28%

Ischemic stroke

7%

7%

Peripheral vascular disease

7%

7%

CKD (

eGFR

<60 mL/min/1.73m

2

)

36%

35%

Aspirin

93%

92%

DAPT

45%

44%

Statins before enrollment

91%

91%Slide8

Serial Changes in Lipid Parameters and

hs

-CRP

LDL-C

TG

HDL-C

hs-CRP

Baseline

0.5

1

Years

Years

Years

Months

2

3

6

,

214

88.1

1

mg

6

,

031

89.4

5

,

615

91.1

5

,

252

91.1

4

,

509

91.0

6

,

199

87.7

4

mg

1

mg

4

mg

5

,

890

73.7

5

,

518

75.

5

5

,

203

76.

6

4

,

405

76.

6

6

,

212

50.7

6

,

028

50.6

5

,

596

51.6

5

,

238

51.6

4

,

498

51.7

6

,

198

50.7

5

,

890

51.0

5

,

482

52.

2

5

,

174

52.

3

4

,

388

52.

3

6

,

208

125.4

1

mg

6

,

032

125.5

5

,

606

122.3

5

,

245

122.4

4

,

507

121.5

6

,

195

127.1

4

mg

1

mg

4

mg

5

,

896

117.5

5

,

498

115.0

5

,

183

114.

5

4

,

402

114.

5

6

,

032

0.59

5

,

734

0.59

5

,

994

0.57

5

,

585

0.49

Baseline

0.5

Baseline

6

1

2

3

Baseline

0.5

1

2

3

Pitavastatin 1

mg

Main effect p< 0.001

Interaction

p< 0.001

Main effect p< 0.001

Interaction

p= 0.17

Pitavastatin 4

mg

No. of Patients

No. of Patients

No. of Patients

No. of Patients

Main effect p< 0.001

Interaction

p= 0.77

70

0

0

75

80

85

90

95

100

0

0

110

115

120

125

130

0.45

0.

50

0.55

0.60

0.65

50

51

52

53

54

55

LDL-C (mg/

dL

)

TG (mg/

dL

)

hs

-CRP (mg/L)

HDL-C (mg/

dL

)

Main effect p< 0.001Slide9

Primary Endpoint (CV death/ MI/

Ischemic stroke/

UA)

1

mg

4

mg

6,214

6,199

5,743

5,631

5,321

Years

5,256

4,501

4,427

2,760

2,730

593

616

No. at

r

isk

Cumulative incidence

(

%

)

10

2

4

6

8

0

4.2

5.6

1.4

1.2

3.5

2.3

2.9

4.6

0

1

2

3

4

5

NNT for 5 years=63

log-rank P=0.01

No. of patients with event: 4

mg 266 (4.3%), 1

mg 334 (5.4%)

HR 0.81

(95% CI, 0.69-0.95), Cox P=0.01

Pitavastatin

1

mg

Pitavastatin

4

mgSlide10

Secondary Endpoint

Primary Endpoint plus Coronary Revascularization*

log-rank P=0.002

8.0

10.4

2.8

2.5

6.7

4.7

5.8

8.5

20

18

16

14

12

8

6

4

2

10

0

5,660

5,556

5,166

5,131

4,327

4,277

2,627

2,617

561

588

Cumulative incidence

(

%

)

1

mg

4

mg

No. at

r

isk

0

1

2

3

4

5

6,214

6,199

Years

NNT for 5 years=41

No. of patients with event: 4

mg 489 (7.9%), 1

mg 600 (9.7%)

HR 0.83

(95% CI, 0.73-0.93), Cox P=0.002

:

Excluding TLR for lesions treated at prior PCI

*

Pitavastatin

1

mg

Pitavastatin

4

mgSlide11

Other Secondary EndpointsOutcomes

1mg

(n=6,214)

Death from any cause

CV death

MIIschemic strokeHemorrhagic strokeUnstable angina requiring emergency hospitalization

Coronary revascularization (All)Coronary revascularization (non-TLR)Coronary revascularization (TLR)No. of patients with event (%)

4mg(n=6,199)260 (4.2)

112 (1.8) 72 (1.2) 83 (1.3) 30 (0.5) 90 (1.4)

 626 (10.1)356 (5.7)

319 (5.1)

207 (3.3) 86 (1.4) 40 (0.6)

84 (1.4) 43 (0.7) 76 (1.2)

529 (8.5)277 (4.5)

276 (4.5)

HR(95% CI)

P Value0.81 (0.68-0.98)0.78 (0.59-1.04)

0.57 (0.38-0.83)

1.03 (0.76-1.40)1.46 (0.92-2.33)0.86 (0.63-1.17)0.86 (0.76-0.96)0.79 (0.68-0.92)0.88 (0.75-1.03)

0.030.090.0040.840.110.340.008

0.0030.121

4

mg Better

1

mg Better

Slide12

Subgroup Analyses

Primary Endpoint

(CV death/

MI/

Ischemic stroke/

UA)

Subgroup

No. of

patients

Event rate (%)

1

mg

HR (95% CI)

P value for

interaction

Overall

Age

Sex

Diabetes

LDL-C

hs-CRP

HDL-C

TG

BMI

<

65

65

Male

Female

Yes

No

<

95

mg/dL

95

mg/dL

<

1

mg/L

1

mg/L

40

mg/dL

>

40

mg/dL

<

150

mg/dL

150

mg/dL

<

25

25

12,413

4,009

8,404

10,253

2,160

4,978

7,435

7,865

4,548

8,510

3,516

2,607

9,803

8,045

4,358

6,693

4,788

5.4

5.0

5.6

5.7

3.8

6.5

4.6

5.0

5.9

4.9

6.7

6.5

5.1

5.1

5.9

5.3

5.7

4.3

3.3

4.8

4.6

3.0

4.8

4.0

4.0

4.8

3.6

6.0

5.0

4.1

4.3

4.2

4.5

4.4

0.81

(0.69-0.95)

0.67

(0.49-0.91)

0.87

(0.72-1.05)0.81 (0.68-0.96)0.81 (0.51-1.28)0.75 (0.59-0.95)0.86 (0.69-1.08)0.81 (0.66-1.00)0.81 (0.63-1.05)0.75 (0.61-0.92)

0.89 (0.68-1.16)0.78 (0.56-1.08)0.82 (0.68-0.99)0.86 (0.70-1.06)0.73 (0.56-0.96)0.87 (0.70-1.07)0.78 (0.60-1.00)0.160.990.390.970.320.78

0.340.531

4

mg4 mg Better1 mg BetterSlide13

Safety Outcomes

Event

Pitavastati

n 1

mg

(N=6,428)

Pitavastati

n

4 mg (N=6,390)

P value

Adverse event

s—

N (%)

Rhabdomyolysis

1 (0.0)

2 (0.0)

0.62

Muscle-complaints

45 (0.7)

121 (1.9)

<0.001

New onset of diabetes mellitus

279 (4.3)

285 (4.5)

0.76

Laboratory test abnormalitie

s—

N (%)

Elevation of ALT, AST, or both ≥3ULN

174 (2.7)

187(2.9)

0.46

Elevation of CK ≥5ULN

40 (0.6)

42 (0.7)

0.83

Study

drug discontinuation

N (%)

503 (8.1)

610

(

9.8)

<0.001Slide14

Study LimitationsThe present study was conducted as an open-label trial with its inherent limitations. However, considering the limitations of the open-label trial design, the primary endpoint was defined as not including coronary revascularization procedures.

The present study was prematurely terminated despite the original event-driven trial design, although we observed significant risk reduction for the primary endpoint. 3. Final follow-up was not completed in a substantial proportion of patients,

reflecting a limitation of physician-initiated study relying upon voluntary

efforts of the site investigators.

Slide15

Conclusions and ImplicationsHigh-dose (4 mg/day) as compared with low-dose (1 mg/day) pitavastatin therapy significantly reduced CV events in Japanese patients with stable CAD.

The present study suggests that the administration of maximum tolerable doses of statins within the range of local approval would be the preferred statins therapy in Japanese patients with established CAD regardless of the baseline LDL-C levels.