/
Establishment and selected characteristics of the Hady coppice and coppice with standards Establishment and selected characteristics of the Hady coppice and coppice with standards

Establishment and selected characteristics of the Hady coppice and coppice with standards - PDF document

luanne-stotts
luanne-stotts . @luanne-stotts
Follow
392 views
Uploaded On 2017-03-26

Establishment and selected characteristics of the Hady coppice and coppice with standards - PPT Presentation

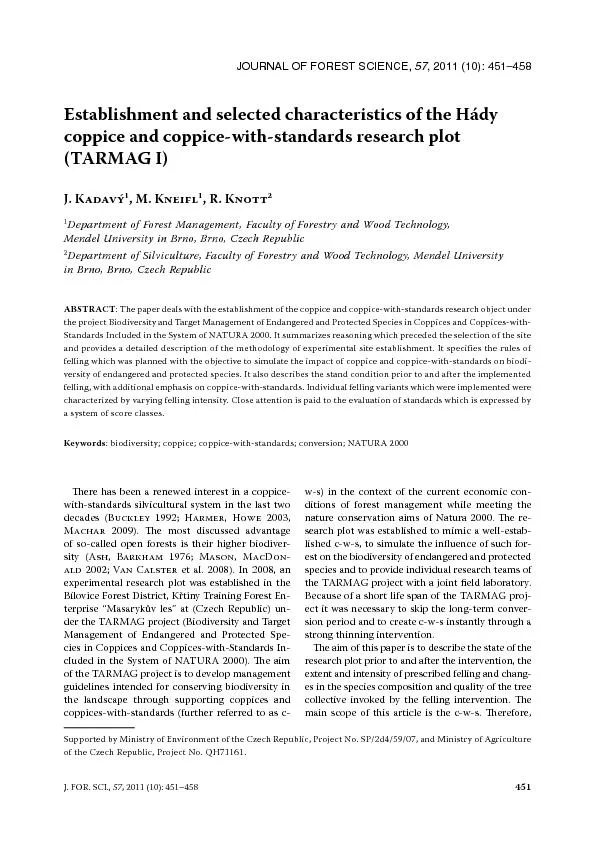
J FOR SCI 57 2011 10 451150458 451 coppice and coppicewithstandards research plot TARMAG I J K 1 M K 1 R K 2 1 Department of Forest Management Faculty of Fores ID: 331385

FOR. SCI. 2011

Share:

Link:

Embed:

Download Presentation from below link

Download Pdf The PPT/PDF document "Establishment and selected characteristi..." is the property of its rightful owner. Permission is granted to download and print the materials on this web site for personal, non-commercial use only, and to display it on your personal computer provided you do not modify the materials and that you retain all copyright notices contained in the materials. By downloading content from our website, you accept the terms of this agreement.


Presentation Transcript

J. FOR. SCI., 57 , 2011 (10): 451–458 451 Establishment and selected characteristics of the Hády coppice and coppice-with-standards research plot (TARMAG I) J. K 1 , M. K 1 , R. K 2 1 Department of Forest Management, Faculty of Forestry and Wood Technology, Mendel University in Brno, Brno, Czech Republic Department of Silviculture, Faculty of Forestry and Wood Technology, Mendel University in Brno, Brno, Czech Republic ABSTRACT : The paper deals with the establishment of the coppice and coppice-with-standards research object under the project Biodiversity and Target Management of Endangered and Protected Species in Coppices and Coppices-with- Standards Included in the System of NATURA 2000. It summarizes reasoning which preceded the selection of the site felling which was planned with the objective to simulate the impact of coppice and coppice-with-standards on biodi - versity of endangered and protected species. It also describes the stand condition prior to and after the implemented felling, with additional emphasis on coppice-with-standards. Individual felling variants which were implemented were characterized by varying felling intensity. Close attention is paid to the evaluation of standards which is expressed by a system of score classes. Keywords biodiversity; coppice; coppice-with-standards; conversion; NATURA 2000 JOURNAL OF FOREST SCIENCE, 57 , 2011 (10): 451–458 ere has been a renewed interest in a coppice- with-standards silvicultural system in the last two decades ( B 1992 ; H, H 2003, M 2009). e most discussed advantage of so-called open forests is their higher biodiver - sity ( A, B 1976 ; M, MD -  2002 ; V C et al. 2008 ). In 2008, an experimental research plot was established in the Bílovice Forest District, Ktiny Training Forest En - terprise “Masaryk\rv les” at (Czech Republic) un - Management of Endangered and Protected Spe - cies in Coppices and Coppices-with-Standards In - cluded in the System of NATURA 2000). e aim of the TARMAG project is to develop management guidelines intended for conserving biodiversity in the landscape through supporting coppices and coppices-with-standards (further referred to as c- w-s) in the context of the current economic con - ditions of forest management while meeting the - search plot was established to mimic a well-estab - lished c-w-s, to simulate the in\fuence of such for - est on the biodiversity of endangered and protected species and to provide individual research teams of the TARMAG project with a joint eld laboratory. Because of a short life span of the TARMAG proj - ect it was necessary to skip the long-term conver - sion period and to create c-w-s instantly through a strong thinning intervention. e aim of this paper is to describe the state of the research plot prior to and after the intervention, the extent and intensity of prescribed felling and chang - es in the species composition and quality of the tree collective invoked by the felling intervention. e main scope of this article is the c-w-s. erefore, Supported by Ministry of Environment of the Czech Republic, Project No. SP/2d4/59/07, and Ministry of Agriculture of the Czech Republic, Project No. QH71161. 452 J. FOR. SCI., 57 , 2011 (10): 451–458 the parts where clear cut was applied will not be mentioned. Basic facts on conversion into c-w-s and its silviculture e c-w-s silvicultural system has been described in expert literature many times ( K\n 1931; P - \t 1947; P\t et al. 1956). Since thicker timber yields higher nancial returns, there are ef - forts to leave as many standards as possible. ere - fore both P\t et al. (1956) and P (1999) distinguished the following types of c-w-s: low standing volume ( 3 ·ha –1 ) and number of standards (50–100 trees·ha –1 ), medium standing volume (100–200 m 3 ·ha –1 ) and number of standards (100–160 trees·ha –1 ), high standing volume (200–400 m 3 ·ha –1 ) and number of standards (160–200 trees·ha –1 ). e number of standards in c-w-s should be as high as to allow the lower storey to thrive, as the latter produces fuel wood as well as it ful ls the soil-protection function. e lower storey also con - tributes to natural pruning of standards ( K 2005). The most important tree species of coppice and c-w-s in central Europe was the oak (sessile and pedunculate). Unfortunately, no papers have been published recently describing the conversion of high forest into coppice-with-standards. On the contrary, the conversion of pedunculate or ses - sile oak coppice into high forest was described for instance by K\b (1989), P (1999) and D et al. (2009). According to C et al. ( 1995 ) and R and K ( 2005 ) cop - pice-with-standards could be utilized as interlink in conversion from coppice to high forest. K-  (2007) reported on return to c-w-s man - agement in a former 40-years abandoned c-w-s. From the historical point of view, there are sev - eral methods of conversion of high forest (possi - bly also false high forest) applied in the past. Ac - cording to C (1845), in a forest enterprise to be converted, mature stands should be cut after natural regeneration appeared. Mid-aged stands should be treated as high forest except for future standards which should be released carefully. Younger stands, after they reached the age of cop - pice rotation, should be clear cut except for a cer - tain number of future standards. P\t et al. (1956) did not recommend conversions of larger forest units via one-off cutting down into c-w-s, because this would disrupt the felling balance and thus yield continuity. Nanquett’s method ( D 1951; S\t et al. 1953; V 1958; U 2004) appeared in the mid-19 th century in France as a combination of direct and indirect conversions of coppice forests. It was divided into four stages with respect to the biology of oak. It does not pre - dominantly take into account arti cial regenera - tion. W ’s method (1912) recommended the in - tegration of the fast-growing European larch into the conversion process to minimize production losses. We also need to mention the methodology applied in municipal forests of Moravský Krumlov (Czech Republic) in recent years ( U 2004, 2006), as well as the methodology of another proj - ect supported by the Ministry of Agriculture of the Czech Republic for 2007–2011 ( F et al. 2009; K\b\t et al. 2009). MATERIAL AND METHODS Research plot establishing, data collection methodology and implemented felling measures In 2008, an experimental research plot was estab - lished in forest stand 380C10 at the Ktiny Training Forest Enterprise Masaryk\rv les, Bílovice Forest District. e plot is situated approximately 0.5km north-east of the Brno city border, in the South Moravian Region of the Czech Republic (GPS co - ordinates: 49°13'29.87''N, 16°40'55.391''E). Accord - ing to the currently valid Forest Management Plan (2003–2012), it is a single-storey, fully-stocked, 98-year-old stand comprising 54% of sessile oak, 18% of Norway spruce, 15% of hornbeam, and 10% of European larch. e predominant forest type is 2H2 (i.e. loamy beech-oak forest on plateaus and gentle slopes with Carex pilosa ), while a minor part covers the 2 × 2 forest type (cornelian cherry-oak forest with admixed beech on rendzina). Despite being of vegetative origin (nowadays at the stage of so called false high forest), the stand belongs to management set of stands No. 245 (oak stands on rich sites at lower altitudes) with rotation period of 150 years. e plot covers 200 × 200 m and is divid - ed into 16 cells (50 × 50 m each). Four neighbour - ing cells constitute an area of 100 × 100 m within which four variants of dierent felling intensity and therefore of varying number of standards are represented. In all cells, the position of every liv - ing tree with DBH 5 cm at minimum has been sur - veyed and recorded in the project database along with its species code, DBH, total tree height, and living crown bottom. J. FOR. SCI., 57 , 2011 (10): 451–458 453 In Fig. 1, white colour depicts clear cut (cells No. 6, 8, 14 and 16), light grey colour depicts very high felling intensity (cells No. 2, 4, 10 and 12), mid-grey colour depicts high intensity (cells No. 1, 3, 9 and 11) and dark grey colour depicts medium high fell - ing intensity (cells No. 5, 7, 13 and 15). Further - more, two control plots (each 50 × 50 m) were es - tablished in neighbouring forest stands. Stand data prior to felling attest the presence of two strata with diameter frequency peaks at approx - imately 12 cm and 28 cm. We took advantage of the presence of two diameter strata to mimic a well- established c-w-s by establishing two quasi storeys (thinner–younger, thicker–older). Although we did not test the age dierence of the strata, we further refer to them as the younger and the older storeys. A standard has to meet general qualitative re - quirements ( K\n 1931; U 2004): (a)perfect health condition (no dead branches in the crown, no wounds), (b)at least 6 m long straight branchless trunk, (c)a dense, long and healthy crown. According to the plot design, on average 24, 35 and 46 future standards were marked in cells with very high, high and medium high felling intensity, respectively. In all cells, we attempted to achieve a 1:3 ratio between the number of standards in the older and the younger storey. Preferentially, individuals of Quercus petraea and Sorbus torminalis that met the given quality crite - ria were selected as future standards. e thickest trees (DBH over 50 cm) were not marked as stan - dards due to advanced age. Prior to felling, all future standards (in both older and younger storey) were marked by a green stripe on the trunk. At the turn of 2008/2009, all un - marked trees and shrubs were cut down and trans - ported out of the plot. Subsequently, the whole plot was fenced. Data processing Standing volume of all trees was calculated us - ing volume equations published by P\n , P (1991). Furthermore, the score number expressing a complex value was calculated for each standard: SN = (T 2 + V + P + K 3 ) (1) 4 where: SN – score number, T – diameter class (from 1 to 4), V – height class (from 1 to 4), P – trunk length class (from 1 to 4), K – crown length class (from 1 to 4). Score numbers were subsequently used to de - scribe the change caused by the felling in a complex way. e score number is a modi cation of the origi - nal quality number published by V ( 1949). e individual trees were then classi ed into three score classes A, B and C which included stan - dards of high score (1  SN  8.6), medium score (8.7  SN  13.4) and low score (13.5  SN  22), respectively. Subsequently, release indices and felling intensities were calculated. e release index is de ned as the extent of release of standards for the analysed cell (50 × 50 m). Index I A evaluates the extent of planned felling volume per standard. Index I B provides infor - mation on the number of felled trees per standard: I A = V F /N S (2) I B = N F /N S (3) where: V F – volume of scheduled felling (m 3 ·ha –1 ), N F – number of trees planned for felling (trees·ha –1 ), N S – number of standards (trees·ha –1 ). Felling intensity I FA de nes the percentage rate of felling from the total volume. On the other hand, I FB provides information on the percentage share of trees scheduled for felling from the total number of trees. I FA = (V F /V) × 100 Fig. 1. Design of the research plot 454 J. FOR. SCI., 57 , 2011 (10): 451–458 I FB = (N F /N) ×100 where: I FA, I FB – felling intensities (%), V F – planned felling volume (m 3 ·ha –1 ), V – standing volume prior to planned felling (m 3 ·ha –1 ), N F – number of trees to fell (trees·ha –1 ), N – total number of trees prior to planned felling (trees·ha –1 ). Finally, the aggregation index according to C and E\b (1954) was calculated to record the stand structure in individual cells prior to and after the implemented felling: 11 2 FN N rRNi (6) where: R – aggregation index, r i – distance of the i -th tree to its nearest tree, N – number of trees on the site, F – area of the site in m 2 . Generally, the aggregation index ranges from 0 to 2.1491. R sts clustering while R � 1 sug - gests ordering. RESULTS Basic characteristics of individual tree species prior to felling A total of 16 tree species have been recorded in the research plot. e most frequent is Quercus pe - traea , which accounts for 47% of the total number of treey and/or for 78% of the total volume. e second most frequent species is Carpinus betulus . Prior to the implemented felling, there were on av - erage 660 trees per hectare, with average standing stock of 308 m 3 . e principal level of the upper canopy is composed primarily of Quercus petraea (approx. 20 m). On average, trees of Quercus pe - traea reach 29 cm in diameter and 11 m in crown bottom height. Larix decidua and Pinus sylvestris reach above this level. e remaining tree species ll in the below-crown space and are individually uniformly distributed over the plot area. Site structure with regard to marked standards On average, 141 standards were marked and left per 1 ha. ese include individuals of Quercus pe - traea (76%) and Sorbus torminalis (2 %). e per - centage ratio of standards with respect to storeys (older to younger) is 39:61. e older storey is almost exclusively composed of Quercus petraea (93%). e younger storey consists of Quercus petraea (65%) and Sorbus torminalis (35%). e diameter structure of the standards is slightly right-skewed. In cells subjected to very high felling intensity six trees were removed from the vicinity of each standard (a total of 2.71 m 3 ) and 77% of the volume (82% of the number of trees) were felled on average (Table 1). In cells subjected to high felling intensity, on average four trees were removed per standard (1.32 m 3 ) and 63% of the volume (82% of the num - ber of trees) were felled on average, while in areas subjected to medium-high felling intensity three trees were removed from the immediate vicinity of a standard (0.86 m 3 ) and 54% of the volume (84% of the number of trees). Scores, numbers and volumes of standards On average, the volume of standards left in cells subjected to very high felling intensity is 19 m 3 (76m 3 ·ha –1 ) (Table 2). Out of this volume, approxi - mately 40% account for trees which are classi ed in the older storey. e ratio of percentage distribu - tion according to score classes (A:B:C) is 28:66:6. Areas subjected to high felling intensity have an av - erage volume of 28 m 3 (112 m 3 ·ha –1 ) left. Out of this volume, approx. 59% account for trees which are classi ed in the older storey. e ratio of percent - age distribution according to score classes (A:B:C) is 31:56:13. Areas subjected to medium-high fell - Table 1. Mean values of release indices (I A and I B ) and felling intensities (I FA and I FB ) Felling intensity Release index Felling intensity I A (m 3 o.b.) I B (pcs) I FA (% from m 3 o.b.) I FB (% from No.) Very high 2.71 ± 0.250 5.9 ± 0.76 77 ± 3 82 ± 4 High 1.32 ± 0.329 3.8 ± 0.55 63 ± 4 82 ± 5 Medium-high 0.86 ± 0.071 3.5 ± 1.36 54 ± 6 84 ± 16 J. FOR. SCI., 57 , 2011 (10): 451–458 455 ing intensity have an average standing volume of 34 m 3 (136 m 3 ·ha –1 ) left in the form of standards. Out of this volume, approx. 63% account for trees which are classi ed in the older storey. e ratio of percentage distribution according to score classes (A:B:C) is 28:63:9. Stand structure in cells prior to and after implemented felling e implemented felling slightly tipped the hori - zontal structure towards an ordered distribution in all cells (Table 3). Cells with very high felling in - tensity were subjected to the highest impact on the horizontal structure. After felling the aggregation index increased by 7% towards the ordered struc - ture. Cells with high felling intensity showed an in - crease of 4% and those subjected to medium-high felling intensity an increase of 2% towards the or - dered horizontal structure. DISCUSSION In the past, former c-w-s forests growing in this country were converted into high forests for vari - ous reasons (timber production purposes being stressed the most frequently). At present, we may witness an increased focus on the re-introduction Table 2. Mean numbers and volumes of standards classi ed according to score classes, storeys and felling intensities Felling intensity Storey Number of trees per cell (trees per 0.25 ha) (standing volume per cell [m 3 o.b. per 0.25 ha]) score class total A B C Very high older 1.3 ± 0.94 (2.14 ± 1.431) 3.8 ± 1.30 (5.22 ± 2.536) 0.0 ± 0.00 (0.00 ± 0.000) 5.0 ± 1.55 (7.35 ± 2.435) younger 3.8 ± 0.43 (3.12 ± 0.581) 11.5 ± 2.06 (6.93 ± 1.243) 3.5 ± 2.18 (1.12 ± 0.924) 18.8 ± 4.11 (11.17 ± 2.593) total 5.0 ± 1.25 (5.26 ± 1.043) 15.3 ± 4.24 (12.15 ± 2.173) 3.5 ± 2.18 (1.12 ± 0.924) 23.8 ± 3.77 (18.52 ± 2.547) High older 4.0 ± 1.22 (6.06 ± 3.003) 8.5 ± 1.66 (8.68 ± 2.093) 1.8 ± 0.43 (1.59 ± 0.294) 14.3 ± 3.06 (16.32 ± 3.614) younger 3.0 ± 0.71 (2.56 ± 0.809) 12.8 ± 3.11 (6.86 ± 2.320) 5.3 ± 2.05 (2.02 ± 1.538) 21.0 ± 4.71 (11.44 ± 2.736) total 7.0 ± 1.12 (8.62 ± 2.808) 21.3 ± 3.28 (15.54 ± 2.389) 7.0 ± 2.29 (3.61 ± 1.128) 35.3 ± 4.13 (27.76 ± 3.307) Medium-high older 5.8 ± 2.17 (5.71 ± 2.816) 14.8 ± 2.68 (14.27 ± 2.486) 1.5 ± 0.5 (1.50 ± 0.660) 22.0 ± 5.88 (21.48 ± 5.748) younger 5.8 ± 2.38 (3.83 ± 2.071) 14.5 ± 3.57 (7.34 ± 2.819) 4.0 ± 1.87 (1.54 ± 1.243) 24.3 ± 5.33 (12.71 ± 3.208) total 11.5 ± 2.28 (9.54 ± 2.644) 29.3 ± 3.16 (21.61 ± 4.365) 5.5 ± 1.85 (3.04 ± 0.995) 46.3 ± 5.6 (34.19 ± 4.879) Table 3. Mean values of Clark-Evans aggregation indices Felling intensity very high high medium-high Prior to felling Quercus petraea 1.15 ± 0.09 1.14 ± 0.07 1.11 ± 0.12 Sorbus torminalis 1.31 ± 0.20 0.99 ± 0.20 0.98 ± 0.29 total 1.16 ± 0.04 1.13 ± 0.05 1.14 ± 0.05 After felling Quercus petraea 1.34 ± 0.11 1.35 ± 0.16 1.22 ± 0.12 Sorbus torminalis 1.38 ± 0.33 0.95 ± 0.10 1.02 ± 0.31 total 1.30 ± 0.04 1.22 ± 0.12 1.19 ± 0.06 456 J. FOR. SCI., 57 , 2011 (10): 451–458 of coppice and c-w-s silvicultural systems into the forest management not only in this country (detailed surveys e.g. in U 2004, 2006 or K\b  et al. 2006). Recommendations for the re-introduction of these silvicultural systems are also declared in the National Forest Program for the period by 2013 ( A 2008). e establishment of the Hády research plot (TARMAG I) drew on general principles of man - agement of c-w-s. Let us then emphasize those which we consider essential and which aected the plos establishment, and as such became the basis of c-w-s conversion in the site. Obviously, it is of immense importance to primarily consider the his - tory (origin) of the converted stand, tree species composition, type and age of the site. Only then we may deduce its feasible sprouting capacity and the consequent reaction of standards to their release. is means that we may determine the actual oc - currence and degree of the so-called open stand increment. A su­cient number of good-quality standards forms a basis of c-w-s. e trees should primarily be of generative origin and the conver - sion method through false c-w-s should be well ap - plied. Numbers of standards and their distribution into individual canopy layers should not be set me - chanically. e conversion should be implemented gradually to make sure that forest stands are well prepared with respect to both their management and biology. Primarily the Nanquett’s method can be considered highly inspirational ( D 1951; S\t et al. 1953 ; V 1958 ; U 2004). Data obtained from the established experimental c-w-s forest site reveal that the implemented felling failed to follow the recommended tree distribution according to individual storeys ( K\n 1931 ; P - \t 1947 ; P\t et al. 1956), which may primarily be ascribed to the fact that only two sto - reys occur at the research site at present. Never - theless, the achieved state may be assessed as satis - factory, as the percentage distribution of standards according to storeys (older storey to younger sto - rey) corresponds to the ratio 39:61. If we desired to characterize the cells within the established ex - perimental research plot in accordance with the diagram of c-w-s types ( P\t et al . 1956 ; P 1999), then the very high felling variant may be characterized as c-w-s with low standing volume and a small number of standards, high felling variant may be characterized as c-w-s with standard standing volume and an average number of standards and the medium-high felling may be seen as c-w-s with standard standing volume and a high number of standards. Paradoxically, the most intensive intervention (very high felling intensity) did not lead to the highest percentage of score class A. It was probably caused by the lower initial quality of trees in the respective cells. We are con dent that in the long-term perspec - tive the results from our research plots will enable us to answer the question whether this manage - ment approach may be viewed as viable or not. CONCLUSION A coppice and c-w-s research plot was estab - lished in the Ktiny Training Forest Enterprise “Masaryk\rv les”, Czech Republic. To simulate a coppice and c-w-s forest structure, the four-hect - are-plot was divided into 16 cells (50 × 50 m each) in which four felling intensities were applied in four replications. On average, the implemented measures reduced the total tree number from orig - inal 660 to 141 individuals per hectare. e aver - age standing volume was reduced from 308 to 108 m 3 ·ha –1 . In cells with high felling intensity on aver - age 6 trees were removed per one standard, while under high felling and medium-high intensity vari - ants only 4 and 3 trees per one standard were re - moved, respectively. An average of 96 standards per hectare (76 m 3 ·ha –1 ) were left in cells where high felling intensity measures were implemented, an average of 140 trees per hectare (112 m 3 ·ha –1 ) in cells subjected to high felling intensity and 184trees per hectar (136m 3 ·ha –1 ) in cells subjected to medium-high felling intensity. e performed measures increased the relative numbers of trees in the medium and highest score classes. However, the felling interventions did not change the relative distribution of timber volume in score classes and thus copied virtually the distribution prior to the measures. e medium score class is of dominant volume occurrence. e implemented measures did not improve the mean score numbers of indi - vidual score classes signi cantly. Trees classi ed in the older storey tended to reach better score num - bers than those in the younger storey. Relative frequencies of standards in score class - es (A:B:C) were balanced and corresponded to the mean ratio of 22:63:15. The relative distribution of timber volume in score classes (A:B:C) was also balanced and corresponded on average to the final ratio of 29:62:9. The analysis of aggregation index has shown that the implemented felling slightly shifted the horizontal structure from group-wise towards an ordered distribution. In cells subjected J. FOR. SCI., 57 , 2011 (10): 451–458 457 to very high felling intensity the mean aggregation index increased by 8%, in those subjected to high felling intensity it rose by 10% and under medium- high felling intensity the resulting increase was 5%. Acknowledgements We would like to thank two anonymous review - ers for numerous notes that helped us to improve the article quality. References A J.E., B J.P. (1976): Changes and variability in the eld layer of a coppiced woodland in Norfolk, England. Journal of Ecology, 64 : 697–712. A (2008): National Forest Program for the Pe - riod until 2013. Praha, ÚHÚL Brandýs nad Labem: 20. (in Czech) C O., C E., I\b F., M G. (1995): Coppice-with-standards, an alternative forest management system: An experimental study. Italia Forestale e Montana. 50 : 371–389. C P.J., E\b F.C. (1954): Distance to nearest neighbour as a measure of spatial relationships in populations. Ecol - ogy, 35 : 445–453. C H . (1845): Handbook of Silviculture. Dresden und Leipzig: 102–151. (in German) B G.P. (1992): Ecology and Management of Coppice Woodlands. London, Chapman-Hall: 336. D B . (1951): Forest Management of Conversions. In: General Part of the Forest Management Plan. University of Agriculture in Brno, Faculty of Forestry, Training Forest Enterprise Ktiny: 131–147. (in Czech) D A., D B., C M . (2009): Conversion possibilities of oak ( Quercus sp. L.) coppices into high forests in Bartin, Turkey. Bart€n Orman Fakültesi Dergisi. 11 (15): 51–59 F M., H V., K\b\t J., K‚ M., K R., S\b M. (2009): Coppice and coppice with standards as a small and middle-scale forest property management. Lesnická práce, 88 (2): 20–21. (in Czech) H R., H J. (2003): e silviculture and manage - ment of coppice woodlands. Edinburgh, Forestry Com - mission: 88. K\b\t J., K‚ M., K R., S\b M., H V. (2009): Coppice and coppice with standards as a small and middle-scale forest property management. Project Annual Report 2008. Brno, Mendel University in Brno: 89. (in Czech) K Z . (2005): Notes on oak silviculture. Lesnická práce, 84 (4): 176–177. (in Czech) K\b  M., ƒ L., B\n J . (2006): Endangered In - sects of Lowland Forests: Protection and Management. Olomouc, Sagittaria: 79. (in Czech) K\n J. (1931): A Brief Description of Forest Establish - ment and Silviculture in the Biological Concept. Písek: 552. (in Czech) K\b I . (1989): Conversion of Quercus cerris / Q. petraea and Q. cerris / Q. frainetto coppice stands into high forest. Gorsko Stopanstvo. 45 (9): 6–8. K H. ( 2007 ): Ingolstadt counts on with coppice-with- standards. LWF Aktuell, 58 : 46 . ( in German ) M I. ( 2009 ): Coppice-with-standards in \foodplain forests – a new subject for nature protection. Journal of Forest Science, 55 : 306–311. M C. F., MD S.M. (2002): Responses of ground \fora to coppice management in english woodland – a study using permanent quadrants. Biodiversity and Conserva - tion, 11 : 1773–1789. P\n R., P J . (1991): e system of Czech-Slovak vol - ume equations of the main tree species. Lesnícky „asopis, 31 (1): 49–56. (in Slovak) P K . (1999): Conversion of the sessile oak Quercus petraea Matt. (Liebl.) coppices into high forests. Radovi Šumarskog Fakulteta Univerziteta u Sarajevu, 29 (1): 1–10. P\t B. (1947): Handbook of Silviculture. Brno, Kni…nice „inu, Edice dobrého hospodáe, 3: 205. (in Czech) P\t B. (ed.) (1956): Silviculture, Part III. Praha, SZN: 595. (in Czech) P Z . (1999): Conversion of coppice-with-standards into high forest (shown on example of ƒeský Kras lanscape protection area). Journal of Forest Science, 45 : 566–571. (in Czech) R E., K C. ( 2005 ): Previous and current silvi - cultural management of \foodplain forests of the Upper Rhine Valley in special consideration of pedunculate oak. In: Silvicultural Management of Floodplain Forests of the Upper Rhiine Valley in Special Consideration of Peduncu - late Oak ( Quercus robur L.). Schriften aus der forstlichen Fakultät der Universität Göttingen und der niedersächsis - chen forstlichen Versuchsanstalt J.D. Sauerländer’s Verlag, Frankfurt am Main, 140: 7–20. S\t F. et al. (1953): Conversions of Coppice.Bratislava, ŠPN: 142. (in Slovak) U D . (2004): Conversions of Coppice into Coppice-with- Standards in the Municipal Forest of Moravský Krumlov (Es - tablishment of Research Plots). [Dissertation.] Brno, Mendel University of Agriculture and Forestry: 124. (in Czech) U D . (2006): A return to coppice-with-standards forest management in the municipal forest of Moravský Krumlov. Lesnická práce, 85 (2):11–13. (in Czech) V C H., C\b R., W B., A† F., V K., H M. (2008): Long-term seed bank dynamics in a temperate forest under conversion from 458 J. FOR. SCI., 57 , 2011 (10): 451–458 coppice-with-standards to high forest management. Ap - plied Vegetation Science, 11 : 251–260. V M . (1949): e importance of positive selection to silvicultural practice. Lesnická práce, 28 : 337–369. V M . (1958): Silviculture of Oak. Praha, SZN: 284. (in Czech) W J . (1912): Conversions of Coppice, Neglected and Dwarfed Forests into High Forest. Praha, 4: 113–165. (in Czech) Received for publication August 31, 2010 Accepted after corrections June 21, 2011 Corresponding author: Ing. R‡ K , Ph.D., Mendel University in Brno, Faculty of Forestry and Wood Technology, Department of Silviculture, Zemˆdˆlská 3, 613 00 Brno, Czech Republic e-mail: knott@mendelu.cz