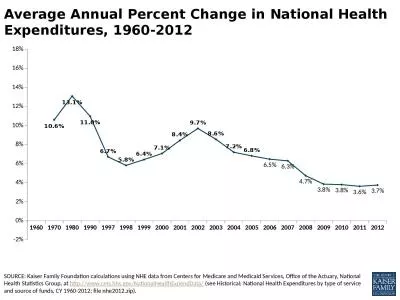
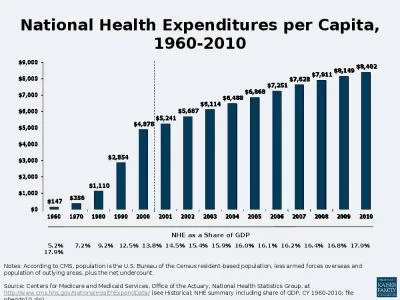
Discussions of health spending often focus on averages but spending varies considerably across the population Contribution to total health expenditures by individuals 2012 Source Kaiser Family Foundation analysis of Medical Expenditure Panel Survey Agency for Healthcare Research and Quality ID: 408675
Download Presentation The PPT/PDF document "How do health expenditures vary across t..." is the property of its rightful owner. Permission is granted to download and print the materials on this web site for personal, non-commercial use only, and to display it on your personal computer provided you do not modify the materials and that you retain all copyright notices contained in the materials. By downloading content from our website, you accept the terms of this agreement.
Slide1
How do health expenditures vary across the population?Slide2
Discussions of health spending often focus on averages, but spending varies considerably across the population
Contribution to total health expenditures by individuals, 2012
Source:
Kaiser Family Foundation analysis of Medical Expenditure Panel Survey, Agency for Healthcare Research and Quality, U.S. Department of Health and Human ServicesSlide3
Family spending is also very concentrated, with half of all families accounting for nearly all health spending
Contribution to total health spending per family, 2012
Source:
Kaiser Family Foundation analysis of Medical Expenditure Panel Survey, Agency for Healthcare Research and Quality, U.S. Department of Health and Human ServicesSlide4
Out-of-pocket spending on health services is almost as concentrated as overall health spending
Out-of-pocket spending on health services, 2012
Source:
Kaiser Family Foundation analysis of Medical Expenditure Panel Survey, Agency for Healthcare Research and Quality, U.S. Department of Health and Human ServicesSlide5
Most of the population reports being in good or better health
Reported health status, 2012
Source:
Kaiser Family Foundation analysis of Medical Expenditure Panel Survey, Agency for Healthcare Research and Quality, U.S. Department of Health and Human ServicesSlide6
There is considerable concentration of
spending, even among populations with relatively high average costs
Source:
Kaiser Family Foundation analysis of Medical Expenditure Panel Survey, Agency for Healthcare Research and Quality, U.S. Department of Health and Human Services
Distribution of health spending among those
Distribution
of health spending among
elderly
reporting fair
or poor
health, 2012
population (age 65+), 2012Slide7
People age 55 and over account for about half of total health spending
Share of total health spending by age group, 2012
Source:
Kaiser Family Foundation analysis of Medical Expenditure Panel Survey, Agency for Healthcare Research and Quality, U.S. Department of Health and Human ServicesSlide8
While health spending increases throughout adulthood for both men and women, spending varies by age
Average health spending by age and gender, 2012
*
Indicates that, for the age range, the difference in estimates for males and females is statistically significant (p<.05)
Source:
Kaiser Family Foundation analysis of Medical Expenditure Panel Survey, Agency for Healthcare Research and Quality, U.S. Department of Health and Human ServicesSlide9
Diagnosis with a serious or chronic health condition is associated with higher health spending
Source:
Kaiser Family Foundation analysis of Medical
Expenditure Panel Survey, Agency for Healthcare Research and Quality, U.S. Department of Health and Human
Services
Per capita health spending based on diagnosis status, in U.S. Dollars, 2012Slide10
Whites have higher health spending in most age categories than people in other groups
Average health spending by age and race/ethnicity, 2012
*
Indicates that, within the age range, the difference from the average of other racial/ethnic groups is statically significant (p<0.05)
Source:
Kaiser Family Foundation analysis of Medical Expenditure Panel Survey, Agency for Healthcare Research and Quality, U.S. Department of Health and Human Services
*
*
*
*
*
*
*
*
*
*
*
*Slide11
People with some insurance have much higher health spending than people who are uninsured all year
Average health spending by age and insurance, 2012
* Indicates that, within the age
range,
the difference in estimates for the insured and uninsured is statistically significant (p<0.05)
Source:
Kaiser Family Foundation analysis of Medical Expenditure Panel Survey, Agency for Healthcare Research and Quality, U.S. Department of Health and Human ServicesSlide12
People with public coverage tend to spend more on health, while the uninsured tend to have low spending
Average health spending by age and insurance type, 2012
* Indicates that, within the age
range,
the difference
from the average of the other coverage categories is
statistically significant (p<0.05)
Source:
Kaiser Family Foundation analysis of Medical Expenditure Panel Survey,
Agency
for Healthcare Research and Quality, U.S. Department of Health and Human Services
*
*
*
*
*
*
*
*
*
*
*
*
*Slide13
A substantial share of the population spends $200 or less out-of-pocket on health care services
Average out-of-pocket spending in $US Dollars, 2012
Source:
Kaiser Family Foundation analysis of Medical Expenditure Panel Survey, Agency for Healthcare Research and Quality, U.S. Department of Health and Human Services