/
Mass Spectrometry:  Quadrupole Mass Filter The mass spectrometer is es Mass Spectrometry:  Quadrupole Mass Filter The mass spectrometer is es

Mass Spectrometry: Quadrupole Mass Filter The mass spectrometer is es - PDF document

luanne-stotts
luanne-stotts . @luanne-stotts
Follow
505 views
Uploaded On 2016-07-16

Mass Spectrometry: Quadrupole Mass Filter The mass spectrometer is es - PPT Presentation

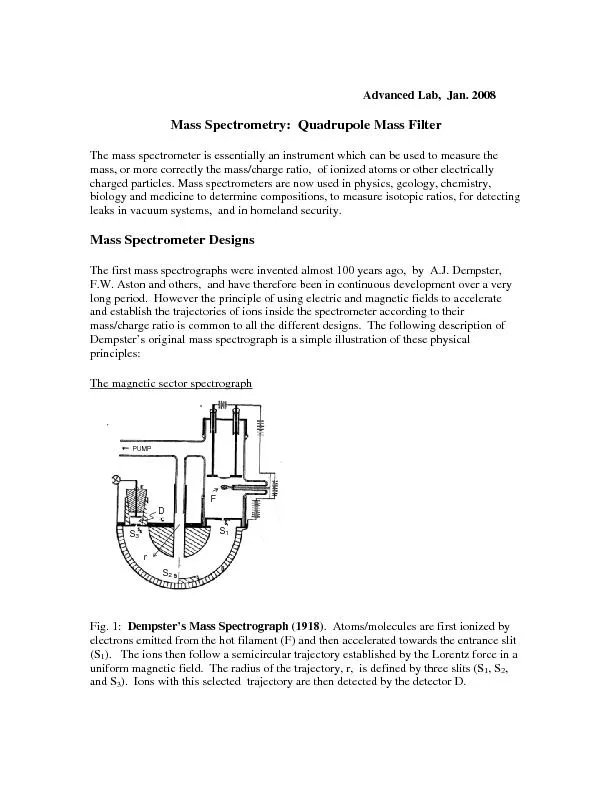
PUMP How the magnetic sector mass spectrograph works qvB mv B the magnetic field m is the mass of the Classically the speed of the ion v is related ID: 407344

PUMP How the magnetic sector mass

Share:

Link:

Embed:

Download Presentation from below link

Download Pdf The PPT/PDF document "Mass Spectrometry: Quadrupole Mass Filt..." is the property of its rightful owner. Permission is granted to download and print the materials on this web site for personal, non-commercial use only, and to display it on your personal computer provided you do not modify the materials and that you retain all copyright notices contained in the materials. By downloading content from our website, you accept the terms of this agreement.


Presentation Transcript

Mass Spectrometry: Quadrupole Mass Filter The mass spectrometer is essentially an instrument which can be used to measure the PUMP How the magnetic sector mass spectrograph works: qvB = mv), B the magnetic field, m is the mass of the Classically, the speed of the ion, v, is related to its accelerating voltage V, by Eliminating v from (1) and (2) gives: = B2 2 mass/charge ratio m/q can be isolated and measured by an appropriate combination of magnetic field B and accelerating voltage V. In these early designs, it was convenient to fix B (using a permanent magnet) and scan V in order to measure the mass spectrum of the different species present in the vacuum chamber of the spectrometer. The Quadrupole Mass Spectrometer In practice, it is difficult to achieve very stable and spatially uniform magnetic fields, especially with permanent magnets. These difficulties can lead to degradation of the mass resolution and drifts in the calibration of the instrumentof stray magnetic fields can affect other instruments that may be used in conjunction with a mass spectrometer, for example, electron was realized, by W. Paul (shared Nobel Prize in Physics, 1989) that use of magnetic fields could be eliminated altogether ds rather than magnetic fields, hence the name Quadrupole Mass Spectrometer. This is the design that is lent mass resolution. With high sensitivity electron multipliers, it can measure partial pressures down to 10-14meter (QMS) is not quite so simple to understand as the magnetic sector design, but it is extremely elegant and involves some beautiful mathematics, and therefore the deta The Mathieu equations can only be solved numerically. The important characteristic of the solutions is that they are only stable (real) for a e the stable solutions of both 4(a) [x-motion] and 4(b) [y-motion] intersect is where the quadrupole mass fSpectrometry, Journal of Mass Spectrometry y for QMS trajectories obeying Mathieu’s Equation. X-motion is stable in the purple band and Y-motion in the magenta band. The stable operating condition for a given mass/charge is where these two bands overlap (pink).1. Turn on the vacuum gauge. This is a composGauge (for measuring pressure in the region between atmospheric pressure (~760 Torr) and approximately 10 Torr. At this lower pressure the Penning Gauge will be activated automatically. The Penning Gauge uses the small electrical current generated by the motion of residual ionized gas molecules betwhousing. For further details on vacuum gaWikipedia. 2. Turn on the vacuum pump by pressing the panel. The roughing pump and the turbo pump will start together. You will hear the stator of the turbo pump slowminutes the pressure should Torr as the turbo comes up to itspressure does not come down to this value, check that the leak valve is fully closed (use clockwisefeel a modest resistance, stop turning. Clockwise to close the leak valve – clockwise to open it. Do not proceed to step 3 unless the pressure is below 10marked with a circle with a vertical line controls the Quadrupole Mass Spectrometer. When you see the window for the operation of the QMS, go to the “Head” menu on the toolbar and select “ V X-stable region X,Y-stable region Y-stable region Grey -unstable region ”. When the dialog box comes up showshow as active on the list. A green LED (5 one from the left, labeled RS 232) will light on the back of the unit when the comput4. At this point you can activate a scan, but the sensitivity will not be so good because you didn’t yet turn on the filament of the electron impact ionizer. Try it with the filament mass spectrum just from whatever ions are gas. Next turn on the filament either from the “Head” menu, or by pressing the icon for the filament on the toolbar. Before you turn on the filament, check that the pressure is less than 10DO NOT OPERATE the QMS at pressures greater than 10. When the filament is activated, a green LED will he second LED from the left) Suggested Experiments inside the vacuum chamber at weak peaks from low concentratioO. Note that molecules can be dissociated and each may cause more than one peak. For example, nitrogen can , etc. Compare the concentrations of the tables of atmospheric constituents. Questions: is the concentration of these constituents the same as in the atmosphere outside the vacuum chamber? Why not? you cannot account for? Why are they there? A number of other features of the mass spectrum may strike you as surprising. You can explore them with There is a cylinder of neon gas near the mass spectrometer. Open the main valve on the cylinder. Set the pressure regulator on thessure gauge. Open the small valve slightly for a few Torr on the vacuum gauge. Record a mass spectrum. The lower mass one has a mass of 19.999 amu. Find the mass of the other isotope of neon and use the ratio of the two peak heights to estimate the ratio . You may have noticed by now thmeasure in these experiments are not exactly what you expected, lighter atoms and molecules like oxygen, nifrom and why is there so much of it?). You may also have noticed that there is a slight excess of the lighter species relative to the heavier atoms. This is because the type of