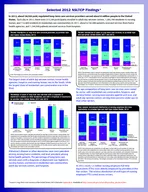
Data Online Query System Overview httpwwwcdcgovnchsdoqs NCHS DOQS lets you run custom queries display results in tables and charts and export data for storing and further analysis Easy to use NCHS DOQS runs in nearly all browsers and can be run without JavaScript ID: 502735
Download Presentation The PPT/PDF document "National Center for Health Statistics" is the property of its rightful owner. Permission is granted to download and print the materials on this web site for personal, non-commercial use only, and to display it on your personal computer provided you do not modify the materials and that you retain all copyright notices contained in the materials. By downloading content from our website, you accept the terms of this agreement.
Slide1
National Center for Health Statistics Data Online Query SystemOverview
http://www.cdc.gov/nchs/doqs/Slide2
NCHS DOQS lets you run custom queries, display results in tables and charts, and export data for storing and further analysis.
Easy to use, NCHS DOQS runs in nearly all browsers and can be run without JavaScript.
Begin your query by selecting a dataset.Slide3
This page contains important information about using ED data with NCHS DOQS. It is recommended that all ED data users review it at least once to ensure that they understand how best to build their queries and how to correctly interpret their output. Slide4
This page contains valuable information about mistakes to avoid when building your query, available statistical measures, proper citation of data, etc.
When you have finished reviewing
Getting
Started with ED
Data
,
return to
Emergency Department Visits
to start building your
query
.Slide5
Next, select the measure you wish to explore. In our first example, we wish to find the annual number of ED visits by age and sex for 2008. Begin by selecting
Estimated
Numbers
of ED Visits
.Slide6
Before you run your first query, you must agree to the NCHS DOQS Data Use Agreement.Slide7
Example 1
It is important to note that Steps 1-12 are only necessary if you want to LIMIT your selections to certain subpopulations. In our example, we want 2008 data for males and females. So,
we begin by making selections in Step 1.
Step 1: You
can select any or all years of
data - the default is the most recent year.
If all years are selected, estimated numbers of visits
returns
cumulative totals, not multi-year averages
. Select
2008.Slide8
Example 1 (cont.)
Since we want data for both males and females, we don’t need to use Step 3 to restrict our selection to one or the other. Instead, just scroll down to Step 13 where you can specify how you would like to display the results of your query.
Step 13:
S
elect
Sex
as the row variable and
Year
as the column variable. The default age group is the
6
standard age groups used in many NCHS reports
When you are ready, click
Submit
to run the query.Slide9
Output from Example 1 QuerySlide10
You can go back and revise your selections for Steps
1-13 by selecting Modify Query.
If you would like to build a new query using a different measure, select
Begin a New Query.Slide11
In our second example, we want to find the percent distribution of ED visits for persons under 18 years of age by expected primary source of payment for 2007-2008. Begin by selecting
Estimated Percentage Distribution of ED Visits.Slide12
Example 2
Step 1: Select 2007 and
2008
,
which will give us a bigger sample size and more reliable estimates. Slide13
Example 2 (cont.)
Step 2: Select the 13 age
groups
category variable and
select
all age
groups under
18 (i.e.
Under 1 year, 1-4 years, 5-9 years, 10-14 years, 15-17 years
).Slide14
Example 2 (cont.)
Step 13: Select
Expected Primary Source of Payment
as the row variable. Note that we are looking for results for ages under 18 as a group, so it is not necessary to select Age Group as a row or column variable.
In
the
Chart
G
raphic Type
dropdown menu,
select
Pie
.
Click
Submit
when you are finished.Slide15
Output from
Example 2 QuerySlide16
In our third example, we want to find the annual rate of injury-related ED visits by persons 65 years and over for 2005-2010. Begin by selecting
Estimated Crude Rates of ED Visits.Slide17
Example 3Step 1: Select All years of
data.Step 2: Select age groups 65-74 years and 75+ years
from the
6
standard age
groups.Slide18
Example 3 (cont.)
Step 7: Select MDC with sub-category
, then
Injury and Poisoning
, then check the first 11 boxes to get just the injury diagnoses. (Or enter a custom range for Primary diagnosis using the
boxes
provided.Slide19
Example 3 (cont
.)Step 13: Select Age Group
as the row variable and
Year
as the column variable. Select
Vertical Bar
as the chart graphic type.
When you are finished, click
Submit
.Slide20
Output from
Example 3 QuerySlide21
In our last example, we want to find the age-adjusted rate of ED visits for chest pain for males and females in 2005 and 2010.
Begin by selecting Estimated Age-adjusted Rates of ED Visits.Slide22
Example 4
Step 1: Select 2005 and
2010
.Slide23
Example 4 (cont.)
Step 7: Select Chest Pain using the
MDC with
sub-category
option.
Click on
Symptoms, Signs
and Ill-Defined Conditions
, then click on
Chest Pain
.Slide24
Example 4 (cont.)
Step 13: Select Year
as the row variable and
Sex
as the
column variable
. By selecting Year,
your table will show separate results for 2005
and 2010. If you had not selected Year, an estimate reflecting the combination of the two years would be displayed
. For
Chart Graphic Type
, select
Horizontal Bar
.
When you are finished, click
Submit
.Slide25
Output from
Example 4 QuerySlide26
Once you complete your query, you can save it in Excel by selecting
Output to Excel.Slide27
You can save the spreadsheet to your hard drive or network, save the data as a CSV file for importing into other statistical software, and take advantage of Excel’s expanded graphing capabilities.Slide28
We welcome your feedback!
Please visit the Contact Us
page to send
any
questions or comments about the data, the application, and your overall experience with NCHS DOQS. Slide29
Thank you for using NCHS DOQS!