PDF-Wavelength (Angstroms)
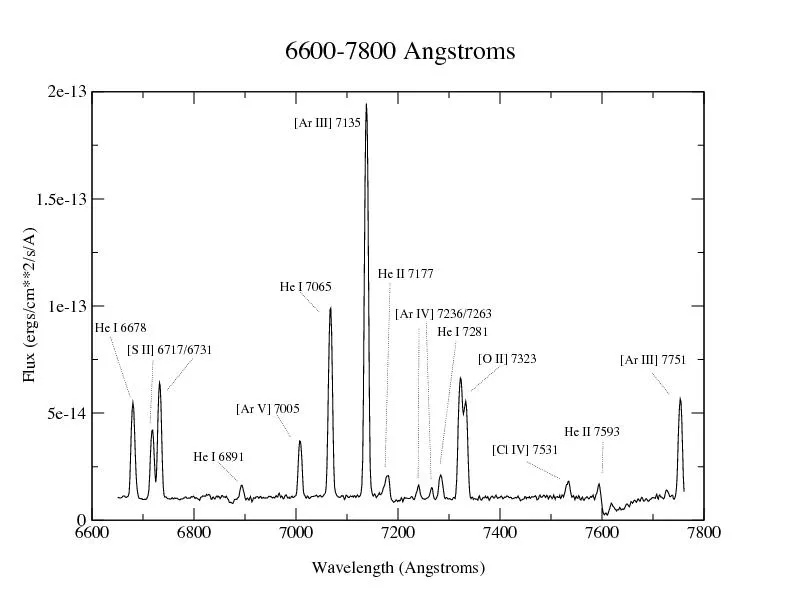
Author : luanne-stotts | Published Date : 2016-10-06

6600 6800 7000 7200 7400 7600 7800 0 5e14 1e13 15e13 2e13 Flux ergscm2sA 66007800 Angstroms He I 6678 S II 67176731 He I 6891 Ar V 7005 He I 7065 Ar III 7135 He

Presentation Embed Code

Download Presentation

Download Presentation The PPT/PDF document "Wavelength (Angstroms)" is the property of its rightful owner. Permission is granted to download and print the materials on this website for personal, non-commercial use only, and to display it on your personal computer provided you do not modify the materials and that you retain all copyright notices contained in the materials. By downloading content from our website, you accept the terms of this agreement.

Wavelength (Angstroms): Transcript


6600 6800 7000 7200 7400 7600 7800 0 5e14 1e13 15e13 2e13 Flux ergscm2sA 66007800 Angstroms He I 6678 S II 67176731 He I 6891 Ar V 7005 He I 7065 Ar III 7135 He II 7177 Ar IV 723. Roberto J. Pérez (UPRM). Charles . Kankelborg. (MSU). Sarah . Jaeggli. (MSU). Abstract. The AIA instrument on the Solar Dynamics Observatory obtains images of the sun in seven different extreme ultraviolet wavebands. Each filter produces images with distinctive appearance that is apparent to experienced observers. Subjective descriptions abound in the literature and in conference presentations, as do qualitative explanations of the physical reasons for these differences. We seek a quantitative description of the image properties, with the aim of understanding what the general image properties indicate about the temperature structure of the corona. Our preliminary results, obtained at multiple heliocentric angles above and below the limb, show that some channels consistently present a high or low intensity contrast which we attribute to the differing temperature, density and filling factor of the structures imaged. We also investigate the power spectra characteristic of each waveband. . Shaker. Family K+ Channel. Stephen B. Long, Ernest . B. Campbell, Roderick . MacKinnon. Presented by: Nathan Lin. March 3, 2011. What is a . Shaker. . Kv. 1.2?. Voltage dependent potassium ion channel. Dr . Fadhl. . Alakwaa. 2013-2014. Third Year. Biomedical Engineering Department. www.Fadhl-alakwa.weebly.com. AGENDA. Atomic Absorption Spectrometry. Photometry: Atomic Emission . Spectroscopy. Fluorometer. many narrow, adjacent wavelength Plot Wavelength (micrometers) 0.00.20.40.62.21.71.20.7 A plot of the brightness valuesversus wavelength shows thecontinuous spectrum for theimage cell, which can be u Page | 1 G oniometer - Contact Angle & Surface Tension Users Manual Coral name: none䀀 Model: Firsttenangstroms ( FTA 3 2 ) Location: Nanofab, Building 215 Contact: nanofab Waves:. Given that yellow light is about 600 nm and blue light is 500 nm, . W. hich has the higher frequency?. Higher energy?. Black Body Radiation. Graphical Reasoning/Synthesis questions. Given the graphs: Which would you expect to look “whiter” to the human eye, a lightbulb operating at 3300K or 2700K? Why or why not?. Physics 2102. Gabriela Gonz. á. lez. Light is a wave. When two beams of light combine, we can have constructive or destructive “interference.” . http://www.colorado.edu/physics/2000/applets/fourier.html. Contents:. Problems in nucleus land. Spectral lines and Rydberg’s formula. Photon wavelengths from transition energies. Electron in a box. Schr. ö. dinger. Limitations of Bohr’s model. .  .                               . Frequency. Medium. Vibration. Sound Waves. Compression . Rarefaction. What is a sound wave?. What section are seen in a sound wave?. amplitude. a. mplitude. :. . is the maximum distance a particle travels from rest. . 3.76 . x 10. 14. s. -1. ?. λ = c/ν = . 3.00 x 10. 8. m/s. . = . 7.98 x 10. -7. m. . . 3.76 x 10. 14. s. -1. . . What is the frequency of a 6.9 x 10. -13. m wave?. 1. . A certain violet light has a wavelength of 413 nm. What is the frequency of this light?. 2. . What is the wavelength of radiation whose frequency is 1.50 x 10. 13. Hz?. 3. . How much energy is associated with a photon in the microwave region of the spectrum with a frequency of 6.6 x 10. Examples are cyanine dyes – Cy3 and Cy5 . There is a spectrum for excitation and emission for each molucule. . We want to observe light emitted at a wavelength separate from the excitation.. If the spectra of different molecules do not overlap too much we can use them together.. Measuring Waves: Variables Recap. Frequency. . ( f ). # of waves passing a point in 1 second. SI unit: Hertz (Hz). shorter wavelength .  higher frequency  higher energy. 1 second. Range for human hearing =. Laura Kasper. 1. , Abbas Zein Al-Din. 1. , Rudolf Volkmer. 2. ,. . Jürgen Bruns. 1. , and Klaus Petermann. 1. 1. Technische Universität Berlin, FG Hochfrequenztechnik - Photonik, Einsteinufer 25, Berlin, 10587, Germany.

Download Document

Here is the link to download the presentation.
"Wavelength (Angstroms)"The content belongs to its owner. You may download and print it for personal use, without modification, and keep all copyright notices. By downloading, you agree to these terms.

Related Documents