/
Neural Tube Defect Surveillance in Botswana: Neural Tube Defect Surveillance in Botswana:

Neural Tube Defect Surveillance in Botswana: - PowerPoint Presentation

luna
luna . @luna
Follow
28 views
Uploaded On 2024-02-03

Neural Tube Defect Surveillance in Botswana: - PPT Presentation

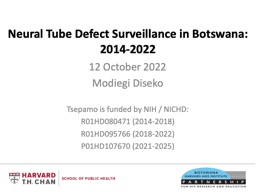
20142022 12 October 2022 Modiegi Diseko Tsepamo is funded by NIH NICHD R01HD080471 20142018 R01HD095766 20182022 P01HD107670 20212025 Tsepamo Study AIMS In 201213 when the concept of ID: 1044596

deliveries ntds tsepamo 000 ntds deliveries 000 tsepamo conception 2014 study year ntd results aug defects sites botswana 2022

Share:

Link:

Embed:

Download Presentation from below link

Download Presentation The PPT/PDF document "Neural Tube Defect Surveillance in Botsw..." is the property of its rightful owner. Permission is granted to download and print the materials on this web site for personal, non-commercial use only, and to display it on your personal computer provided you do not modify the materials and that you retain all copyright notices contained in the materials. By downloading content from our website, you accept the terms of this agreement.


Presentation Transcript

1. Neural Tube Defect Surveillance in Botswana:2014-202212 October 2022Modiegi DisekoTsepamo is funded by NIH / NICHD:R01HD080471 (2014-2018) R01HD095766 (2018-2022)P01HD107670 (2021-2025)

2. Tsepamo Study AIMSIn 2012/13, when the concept of Tsepamo was started, Botswana had rolled out Atripla (TDF/FTC/EFV) as first-line HIV treatment for everyone.Animal data suggested pre-conception exposure to EFV was associated with CNS defects in monkeysWith the rollout of Atripla (TDF/FTC/EFV) in adults living with HIV, we knew there would be a large number of women on EFV at the time of conception The primary aim of Tsepamo was to evaluate the prevalence of neural tube defects with conception exposure to EFV in Botswana

3. Tsepamo Study OverviewSurveillance at maternity wards throughout Botswana8 original sites opened in 2014~ 45% of births in BotswanaExpanded to 18 sites in 2018 ~ 72% of births in Botswana2 sites closed at present (for cost) Tsepamo Sites in Botswana>95% of women deliver in a healthcare facilityObstetric record available at delivery for >99% of womenNo/minimal prenatal diagnosis or termination of pregnancyFactors that make Tsepamo possible:

4. Tsepamo Data Capture LogisticsL&D or MaternityPre-hospital deliveries (excluded)Nurse calls study team if congenital abnormality detected Pre-hospitalL&DMaternity WardUse logbook to confirm all deliveries(open record for each delivering woman in REDCap)Study team confirms ARVs and key data for WLHIVAt discharge home, obstetric card collected by study team for entrycards held for study team on weekends, holidaysIf card is missing (rare), use just logbook data to maintain denominatorIf infant admitted to hospital ward, record is kept open for 28 days

5. Procedure for Congenital AbnormalitiesNeonatal surface exam is part of routine care by midwivesTraining by Tsepamo team on surface exam (using WHO materials)When an abnormality noted, the midwife contacts the Tsepamo RAMidwife receives cell phone creditTsepamo team consents mother for a photographAdditional “congenital abnormalities form” completedPhotographs of major abnormalities (and unclear findings) are reviewed regularlyReview by pediatric geneticist, who is blinded to exposure information

6. Limitations of Newborn Surveillance for AbnormalitiesSurface exam only:Unable to evaluate for cardiac defects (common) or other internal organ defects (rare)Unable to include defects that are not consistently and reliably evaluatedUndescended testesIsolated cleft palateHip DysplasiaChallenge to classify some abnormalities by still photos (eg club foot)However, neural tube defects are:Almost always visible (hard to miss)Relatively easy to photographNot easily confused with most other defects

7. Results: Study PopulationBetween Aug. 2014-2022, there were 236,199 deliveries at Tsepamo Sites

8. Results: Study PopulationBetween Aug. 2014-2022, there were 236,199 deliveries at Tsepamo Sites235,761 (99.8%) had an evaluable infant surface exam

9. Results: Study PopulationBetween Aug. 2014-2022, there were 236,199 deliveries at Tsepamo Sites235,761 (99.8%) had an evaluable infant surface exam162 NTDs (0.07%, 95% CI 0.06%, 0.08%)102 (63%) were diagnosed by photograph60 (37%) were diagnosed by description alone

10. Results: Study PopulationBetween Aug. 2014-2022, there were 236,199 deliveries at Tsepamo Sites235,761 (99.8%) had an evaluable infant surface exam162 NTDs (0.07%, 95% CI 0.06%, 0.08%)102 (63%) were diagnosed by photograph60 (37%) were diagnosed by description aloneThe prevalence of NTDs overall is slightly lower than expected given that Botswana does not have folate fortification of grains

11. Results: NTD type162 NTDs (0.07%, 95% CI 0.06%, 0.08%)74 (45.7%) were meningocele/myelomeningocele~3.1 per 10,000 births61 (37.7%) were anencephaly~2.6 per 10,000 births24 (14.8%) were encephalocele~1.1 per 10,000 births2 (1.2%%) were iniencephaly~1 per 100,000 births1 was either anencephaly or encephalocele, but could not determine from the photo

12. Results: NTD type162 NTDs (0.07%, 95% CI 0.06%, 0.08%)74 (45.7%) were meningocele/myelomeningocele~3.1 per 10,000 births61 (37.7%) were anencephaly~2.6 per 10,000 births24 (14.8%) were encephalocele~1.1 per 10,000 births2 (1.2%%) were iniencephaly~1 per 100,000 births1 was either anencephaly or encephalocele, but could not determine from the photoThe distribution of different types of NTDs is about what is expected

13. Results: NTD outcomes162 NTDs (0.07%, 95% CI 0.06%, 0.08%)54 (33.3%) were stillborn 38/108 (35.2%) were live born and died before leaving the hospital (<28 days)Measured perinatal mortality of 57% (infants were not followed after discharge from hospital)

14. Results: NTD outcomes162 NTDs (0.07%, 95% CI 0.06%, 0.08%)54 (33.3%) were stillborn 38/108 (35.2%) were live born and died before leaving the hospital (<28 days)Measured perinatal mortality of 57% (infants were not followed after discharge from hospital)Perinatal mortality is very high among infants with NTDs

15. NTDs/year per 10,000 births (and 95% CI): Aug 2014-Aug 2022There is year-to-year variation in NTDs, ranging from 4 per 10000 births (2020/21) to 11 per 10000 births (2014/15)

16. NTDs/year per 10,000 deliveries (and 95% CI): Aug 2014-Aug 2022 Total Deliveries Restricted to original 8 sitesOnly a little of the yearly variation is due to having more sites after 2018)

17. NTDs/year per 10,000 deliveries (and 95% CI): Month of Conception Total Deliveries Restricted to original 8 sitesThere are differences in NTD rate by month of conception

18. NTDs/year per 10,000 deliveries (and 95% CI): Season of Conception Total Deliveries Restricted to original 8 sitesHighest rates of NTDs when conception occurs in the early dry season (cold and dry)

19. NTDs/year per 10,000 deliveries (and 95% CI): Season of Conception Total Deliveries Restricted to original 8 sitesLowest rates of NTDs when conception occurs in the late dry season (warm and dry)

20. High NTD years (>8/10000) Low NTD years (<8/10000)NTDs/year per 10,000 deliveries (and 95% CI): Season of Conception (Low Vs. High NTD years)These seasonal variations by month of conception only seem to occur in years when NTD rates were high (above 8 per 10000)

21. Conclusion and Future DirectionsWe would like to understand the seasonal and yearly variation betterIs there something environmental? Diet-related? Other exposures in certain years/seasons?Is there any systematic ways in which we are missing NTDs in our system?What other risk factors can we identify for NTDs in Botswana?8-year analyses of NTDs by HIV status and ART regimen are underway

22. Thanks!