/
Supervised by Yoichi Miyake Research Center for Frontier MedicalEngine Supervised by Yoichi Miyake Research Center for Frontier MedicalEngine

Supervised by Yoichi Miyake Research Center for Frontier MedicalEngine - PDF document

lydia
lydia . @lydia
Follow
342 views
Uploaded On 2021-08-05

Supervised by Yoichi Miyake Research Center for Frontier MedicalEngine - PPT Presentation

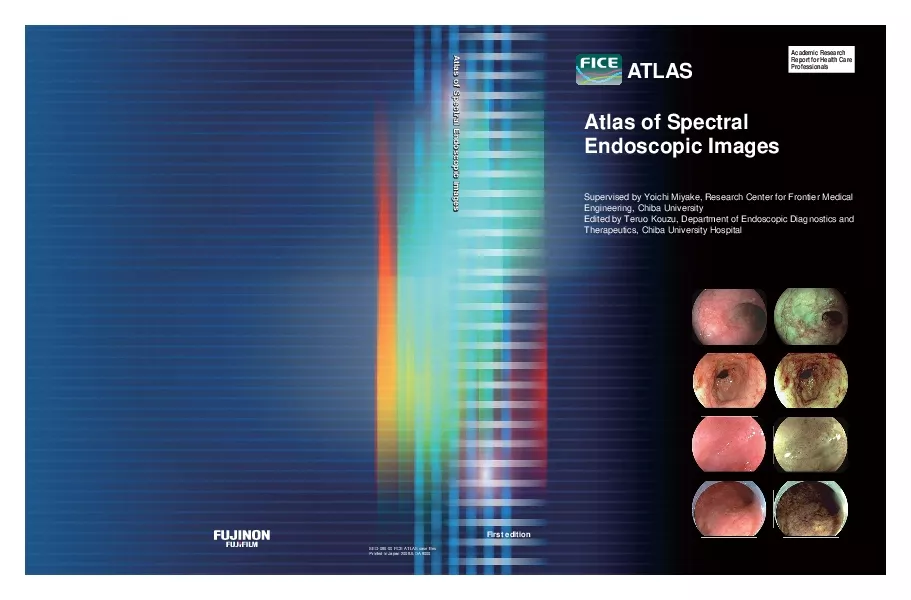
SEG08600 FICE ATLAS case filesFirst editionAcademic ResearchReport for Health CareAtlas of Spectral Endoscopic ImagesAtlas of Spectral Endoscopic ImagesAtlas of Spectral Endoscopic Images1 Introduct ID: 857518

fice image spectral university image fice university spectral conventional gastric stomach photographs lesion cancer iic stomachcase wavelength pattern area

Share:

Link:

Embed:

Download Presentation from below link

Download Pdf The PPT/PDF document "Supervised by Yoichi Miyake Research Cen..." is the property of its rightful owner. Permission is granted to download and print the materials on this web site for personal, non-commercial use only, and to display it on your personal computer provided you do not modify the materials and that you retain all copyright notices contained in the materials. By downloading content from our website, you accept the terms of this agreement.


Presentation Transcript

1 Supervised by Yoichi Miyake, Research Ce
Supervised by Yoichi Miyake, Research Center for Frontier MedicalEngineering, Chiba UniversityAtlas of SpectralEndoscopic Images SEG-086-00 FICE ATLAS case filesFirst edition Academic ResearchReport for Health Care Atlas of Spectral Endoscopic ImagesAtlas of Spectral Endoscopic Images Atlas of Spectral Endoscopic Images 1. Introduction ..........................................................62. Color Reproduction Theory .................................73. Estimation of Spectral Reflectance ......................94. Spectral Image ....................................................105. Summary .............................................................13Examination of the Boundary and AreaDr. Yoshida, Hiroshima University ..................16, 17Dr. Kouzu, Chiba University ..................................17Dr. Yoshida, Hiroshima University ........................18 Tab PrefaceCorporation. The development of this technology was started as a research theme at themucosa for the first time, I felt confident that the technology would work effectively. Iendoscopy, I somewhat regretted having observed the gastrointestinal tract with conven-Since the

2 late 1990s, researchers at the Departmen
late 1990s, researchers at the Department of Endoscopic Diagnostics andI, as an editor, am deeply impressed by the practical application of the technology as a (Listed in publication order)Shigeto Yoshida, Department of Endoscopy, Hiroshima University Hospitalruo Kouzu, Director and Professor, Department of Endoscopic Diagnostics and Therapeutics,Hiroyuki Osawa, Assistant Professor, Division of Gastroenterology, Department of InternalMitsuyo Yoshizawa, Division of Gastroenterology, Department of Internal Medicine, JichiShoji Mitsufuji, Assistant Professor, Department of Molecular Gastroenterology andKazutomo Togashi, Assistant Professor, Division of Endoscopy, Jichi Medical UniveHideki Mitooka, Director, Ashiya Mitooka ClinicMiwako Arima, Deputy Director, Department of Gastroenterology, Saitama Cancer Centeromonori Yano, Division of Gastroenterology, Department of Internal Medicine, Jichi MedicalHideo Yanai, Director, Department of Gastroenterology & Hepatology, National HospitalOrganization Kanmon Medical Centerukari Tanioka, Department of Gastroenterology & Hepatology, National Hospital Organizationtsumaru Miyawaki, Director, Izumo Central ClinicSup

3 ervised by Yoichi Miyake, Director, Rese
ervised by Yoichi Miyake, Director, Research Center for Frontier Medical Engineering, ChibaEdited by Teruo Kouzu, Director and Professor, Department of Endoscopic Diagnostics andTherapeutics, Chiba University Hospital (also serving as Deputy Director, Research Center for relationship between color information (spectral information) Principle of FICE received his doctorate in engineering at Tokyo InstituteInstitute of Technology (ETH), he was appointed asso-Medical Engineering, Chiba University in 2003. He alsoserved as a visiting professor at the Institute of Optics,University of Rochester, professor at Tokyo Institute ofChulalongkorn University in Thailand, president of theJapan, chief executive of the Japanese Association ofawards including the Charles E. Ives Award, ElectronicImaging Honoree of the Year (SPIE, IS&T), and hon-orary award from the Society of Photographic Scienceand Technology of Japan. He has written many booksSpectral Image Processing (as an editor and writer, 6 of RGB or CMY. This chapter outlines the principle of FICE (Flexiblespectral Imaging Color Enhancement) , 2. Color Reproduction TheoryIn general, the characteristics of an

4 object can be expressed as the function
object can be expressed as the function O (x,y,z,t,) of three-dimension-al space (x,y,z), time (t), and wavelength () of visible light (400 to 700 nm). More accurate description ofobject characteristics requires the measurement of the Bidirectional Reflectance Distribution Function(BRDF)of the object. For simplicity, however, this section disregards time, special coordinates, and angle of devia-) to address color reproduction in the elec-tronic endoscope as shown in Figure 3. When an object (such as the gastric mucosa) with a spectral) is illuminated with a light source having a spectral emissivity of E() through a filterwith a spectral transmittance of fi() (i = R, G, B), and an image obtained through a lens and fiber with aspectral transmittance of L() is recorded with a CCD camera with a spectral sensitivity of S(), camera out-put Vi(i = R, G, B) can be expressed by the equation (1) (for simplicity, noise is ignored).where, Htiis the system's spectral product ftiELs, and t indicates transposition.This means that the colors reproduced by the endoscope are determined after input of vinto a display,such as a CRT and LCD

5 , and the addition of the characteristic
, and the addition of the characteristics of the display and visual environment. When Principle of Spectral Estimation Image Processing Figure 1. Dispersion of Visible Light with a Prism.Figure 2. Spectral Sensitivity of L, M, and S Cones (relative value). Visible light400nm700nm Figure 3. Color Reproduction Process for Electronic endoscopy. Vi() Lens E() Filter fi() L() CCD S( o() Light guide fiber Light source Vi = 700400 E () f i () L () S () O () di=R,G,B (1)(2)Equation (1) can be expressed with a vector as follows: vi =f ELso=H otiti 9 ) represented a single spot on the gastric mucosa. The measurement ofthe spectral reflectance at all coordinates of the object required huge amounts of time and costs and wasnot feasible with this spectroscope. Thus, an attempt was made to estimate the spectral reflectance of theThe spectral reflectance of an object may be estimated from the camera output by solving the integral equa-greater number of dimensions. For example, the measurement of visible light with a wavelength of 400 to700 nm at intervals of 5 nm is associated with 61 dimensions. Thus, it is nece

6 ssary to solve an Ill-posedequation in o
ssary to solve an Ill-posedequation in order to estimate 61 dimensions of spectral information from three-band data (RGB) in conven-tional endoscopy. This chapter does not detail the problem because a large body of literature is available,For example, an eigenvector obtained from the principal compo-Figure 6 shows the eigenvectors of spectral reflectances of the colorectal mucosa and cumulative contribu-tion. Figure 6 indicates that three principal component vectors allow good estimation of the spectralreflectances of the colorectal mucosa. It was also found that the use of three principal components allowedestimation of the spectral reflectances of the gastric mucosa and skin.was made between 310 spectral reflectances estimated from three principal component vectors and thoseactually measured in the gastric mucosa, the maximum color difference was 9.14, the minimum color differ-ence was 0.64, and the mean color difference was 2.66. These findings indicated that output of a three-When the system spectral product is not known, the Wiener estimation may be used to estimate the spec-This section briefly describes the estimation of the spectral reflectanc

7 e byof the system matrix should be compu
e byof the system matrix should be computed to obtain from the equation (2). For determination of the estimation matrix, an endoscope is used to capture samplecolor charts corresponding to spectral radiance as shown in Figure 7, and the camera output measured. In this case, the estimate of spectral radiance of sample k can be expressed with the camera out- mucosa. Thus, we developed an endoscope spectroscopy system to quantitatively investigate color repro-duction for endoscopy and measured, for the first time in the world, the spectral reflectance of the gastricmucosa at Toho University Ohashi Medical Center, Cancer Institute Hospital, and the National KyotoFigure 4 shows a block diagram and photograph of a spectral endoscope. This spectroscope consists of alight source, optical endoscope, spectroscope, and spectroscopic measurement system (optical multichannelanalyzer, or OMA). The object is illuminated with light from the light source through the light guide.Through an image guide and half mirror, the reflected light is delivered partly to the camera and partly tothe spectroscope. The luminous flux delivered to the spectroscope has a diameter of 0.

8 24 mm and is pre-sented as a round mark
24 mm and is pre-sented as a round mark in the eyepiece field. When the distance between the endoscope tip and the objectis 20 mm, the mark corresponds to a diameter of 4 mm on the object. A 1024-channel CCD line sensor isplaced at the exit pupil of the spectroscope, and the output is transmitted to the PC for analysis.Wavelength calibration was performed with mercury spectrum and a standard white plate. The wavelengthsFigure 5 shows an example of the spectral reflectance of normal, colorectal mucosa after denoising andother processing of measurements. As shown in equation (1), the measurement of O(of color reproduction. Initially, I optimized the spectral sensitivity of color films used for the endoscope. Figure 4. Configuration and Photograph of Endoscope Spectroscopy System. = i u i i=1 Figure 5. Spectral Reflectance of the Colorectal Mucosa (normal region). Spectral Reflectance 3 11 Figure 9 shows examples of spectral images at (a) 400 nm, (b) 450 nm, (c) 500 nm, (d) 550 nm, (e) 600 nm,(f) 650 nm, and (g) 700 nm estimated from an RGB image (h) of the gastric mucosa.FICE has pre-calculated coefficients in a look-up table and estimates images at th

9 ree wavelengths (1, 2, 3) ,
ree wavelengths (1, 2, 3) , or spectral images, by using the following 3 3 matrix.For example, the matrix coefficients for determination of wavelengths (1= 500 nm, 2= 620 nm, 3= 650 nm)are as follows:Thus, FICE assigns estimated spectral images to RGB components in a display device and allows reproduc-tion of color images at a given set of wavelengths in real time. Figure 10 shows a FICE block diagram.10 According to the Wiener estimation method, the pseudo-inverse matrix that minimizes the error betweenokand the estimate o'k o'k -ok&#x|000;| for all sample data can be obtained from thefollowing equation,where Rfgis a correlation matrix for the spectral radiance and camera output, and Rggis an auto-correlationmatrix for the camera output. In FICE,(9),(10)the spectral reflectance of an object is determined on the basis ofthe Wiener estimation.4. Spectral ImageFigure 8 schematically shows the spectral estimation and image reconstruction based on the principle. Figure 7. Measurement of the Spectral Reflectance by the Wiener Estimation. =H v H =R R-1fg-1gg Figure 8. Method for Image Construction Using Spec

10 tral Estimation Figure 9. Examples of Sp
tral Estimation Figure 9. Examples of Spectral Images at 400 to 700 nm Estimated From anRGB Image of the Gastric Mucosa. 123 RGB k1rk2rk3rk1gk2gk3gk1bk2bk3b = RGB 0.001190.0040220.0051520.0023460.001920.00160.000970.000088 =123 White lightTissue surface Conventional image 400nm Reconstructedimage 700nmXenon lamp Spectroradiometer Color chartVTissue surface Wiener estimation Measurement o ,o 12n =T v , v , v =T o'v o': Estimate(4)(5)(6)(7) 13 Figure 12 shows images of the mucosa of the lower esophagus in which different combinations of wave-lengths result in different color reproductions. Figure (a) shows an image reproduced with the conventional5. Summary12 Figure 11 shows an example of an endoscopic image of the esophagus taken with this endoscopy system.Figure 10. FICE Block Diagram. Figure 11. Esophageal mucosa visualized by FICE.(Images provided by Dr. Kouzu, Chiba University) Figure 12. Images of lower esophageal mucosa(Images provided by Dr. Inoue, Chiba University) Figure 13. Photograph of EndoscopySystem Incorporating FICE Function. (a) RGB image(Conventional Image) (b) FICE image(R: 1 = 500nm, G: 2 = 450nm, B:

11 3 = 410nm) (a) RGB image (conventio
3 = 410nm) (a) RGB image (conventional image)(b) FICE image (R, 550 nm; G, 500 nm; B, 470 nm) (a) (c) (b) Object and normal regions and individual areas are clearly visualized with Examination of the Boundaryand Area using FICE Images contained in this atlas use the below convention to signify the application of FICE settings.(1) Miyake Y. Analysis and Evaluation of Digital Color Images. University of Tokyo Press; 2000.(2) Miyake Y, editor. Manual of Spectral Image Processing. University of Tokyo Press; 2006.(3) Miyake Y, Sekiya T, Kubo S, Hara T. A new spectrophotometer for measuring the spectralbrane and color reproduction simulation for endoscopic images. Kyoto University Publications of(5) Shiobara T, Haneishi H, Miyake Y. Color correction for colorimetric color reproduction in an(6) Shiobara T, Zhou S, Haneishi H, Tsumura N, Miyake Y. Improved color reproduction of elec-(7) Miyake Y, Yokoyama Y. Obtaining and reproduction of accurate color images based on human(8) Tsumura N, Tanaka T, Haneishi H, Miyake Y. Optimal design of mosaic color electronic endo-(9) Miyake Y, Kouzu T, Takeuchi S, Nakaguchi T, Tsumura N, Yamataka S. Development of n

12 ew (All wavelengths are in nm) number se
ew (All wavelengths are in nm) number selected using the keyboard Wavelength assigned to component R (gain value)Pattern: 4Wavelength (gain)Wavelength (gain)Wavelength manually changes the wavelength and / or gainPattern: M system was usedPrototype to component B (gain value) BoundaryMagnifyingEnteroscopy Magnification Esophagus Esophagus Esophagus Esophagus : Esophagus: SCC, 0-IIc, m1 : Esophagus: SCC, 0-IIc, m1of the boundary of the lesion and easy identification of the area. Site : Esophagus: SCC, 0-IIc, m1: Compared with conventional examination, the use of FICE highlights color changes in the affectedarea. Findings: Case in which the boundary of esophageal cancer is clearly observed. FICE allows clear visualizationof the boundary and identification of the obstruction of blood vessels. Photographs provided by Dr. Yoshida (Hiroshima University) Photographs provided by Dr. Yoshida (Hiroshima University)Photographs provided by Dr. Kouzu (Chiba University) BoundaryMagnifyingEnteroscopy MagnificationBoundaryasculatureMagnifyingPathologicalEnteroscopyTransnasal Magnification Examination of the Boundary and Area using FICE Stomach : StomachCase: 0-

13 IIc, moderately differentiated tubular a
IIc, moderately differentiated tubular adenocarcinoma: Compared with conventional examination, FICE allows clear visualization of the area of the lesion. Site: StomachCase: Early gastric cancer, 0-IIa, well-differentiated adenocarcinoma: An elevated lesion is found in the lesser curvature of the mid body, leading to the diagnosis of earlygastric cancer. On the FICE image, the demarcation line between the elevated lesion and the sur- 19Photographs provided by Dr. Osawa and Dr. Yoshizawa (Jichi Medical University)Photographs provided by Dr. Osawa and Dr. Yoshizawa (Jichi Medical University) Stomach Stomach : StomachCase : Early gastric cancer, 0-IIc, Signet ring cell carcinomaby the lesion is clearly visualized. : StomachCase: Early gastric cancer, 0-IIc, well-differentiated adenocarcinomathe mid body. On the FICE image, the surrounding atrophic mucosa turns yellowish. Thus, reddishcancerous lesion is enhanced and the edge of depressed lesion is clearly visualized. BoundaryMagnifyingEnteroscopy MagnificationBoundaryasculatureMagnifyingPathologicalEnteroscopyTransnasal MagnificationExamination of the Boundary and Area using FICE : StomachCase: Ear

14 ly gastric cancer, 0-IIa, Cancer in aden
ly gastric cancer, 0-IIa, Cancer in adenoma, well-differentiated adenocarcinoma.: On the conventional endoscopic image, slightly elevated lesion is found on the posterior wall of themid body. On the FICE image, the whitish change of the elevated lesion is more evident, and a longpit pattern of adenomatous portion in the edge of elevated area and a fine pit pattern of cancerousportion are clearly observed with low magnification. Site: StomachCase: Early gastric cancer, 0-IIc, well-differentiated adenocarcinoma Photographs provided by Dr. Osawa and Dr. Yoshizawa (Jichi Medical University)Conventional image Stomach Stomach Stomach finepit BoundaryMagnifyingEnteroscopy MagnificationBoundaryasculatureMagnifyingPathologicalEnteroscopyTransnasal Magnification Examination of the Boundary and Area using FICE Stomach : Early gastric cancer, IIb: The lesion characterized only by a slight color change is hardly identifiable under white light but dis-tinguishable by FICE. A pathological diagnosis of well-differentiated adenocarcinoma is made. Site: Lesser curvature of the body of the stomachCase: Early gastric cancer (IIa + IIc)elevated area. A pathological d

15 iagnosis of moderately differentiated ad
iagnosis of moderately differentiated adenocarcinoma is made. 23Photographs provided by Dr. Kouzu (Chiba University)Photographs provided by Dr. Kouzu (Chiba University) Stomach Stomach : Gastric antrumCase: IIc + IIb adenocarcinoma : Gastric corpusCase: IIc adenocarcinomathe surface are observed by FICE. BoundaryMagnifyingEnteroscopy MagnificationBoundaryasculatureMagnifyingPathologicalEnteroscopyTransnasal Magnification Examination of the Boundary and Area using FICE Stomach : StomachCase: Early gastric cancer, 0-IIc, signet-ring cell carcinomastomach. The poorly defined, discolored area on conventional view is clearly visualized by FICE. : StomachCase�: Early gastric cancer, 0-IIc, well-differentiated adenocarcinoma (tub1 tub2), 11 7mm in size Findings: The conventional image shows an ill-defined slightly depressed reddish lesion in the anterior wall ofthe upper body of the stomach. On the FICE image, the border of the cancerous lesion is well demar-cated. Photographs provided by Dr. Mitsufuji (Kyoto Prefectural University of Medicine)Atlas of Spectral Endoscopic Images Examination of the Boundary and Area using FICE 25Photographs prov

16 ided by Dr. Mitsufuji (Kyoto Prefectural
ided by Dr. Mitsufuji (Kyoto Prefectural University of Medicine)Photographs provided by Dr. Inoue (Chiba University)Photographs provided by Dr. Inoue (Chiba University) Stomach Stomach Stomach : StomachCase: Gastric adenoma: The boundary of the lesion that is hardly identifiable by conventional examination is clearly visual-ized by FICE. : StomachCase: Gastric adenoma with a slightly depressed area on the topcolor changes. R:550 BoundaryMagnifyingEnteroscopy MagnificationBoundaryasculatureMagnifyingPathologicalEnteroscopyTransnasal Magnification Examination of the Boundary and Area using FICE Atlas of Spectral Endoscopic Images Examination of the Boundary and Area using FICE 2627 Site: StomachCase: AdenocarcinomaFindings: A case in which the area of IIc + IIa lesion in the posterior wall of the gastric corpus is clearly visual-ized.After EMR, a histological diagnosis of well differentiated tubular adenocarcinoma was made. Site: StomachCase: Early gastric cancer, 0-IIa + IIbFindings: The FICE image displays not only superficial elevated lesion (type 0-IIa) but also flat lesion (0-IIb) extensively involving the lesser curvature of the gastric body

17 . Its boundary is more clearly visualize
. Its boundary is more clearly visualized Conventional image Conventional imageImage after indigo carmine spraying Photographs provided by Dr. Kouzu (Chiba University)Photographs provided by Dr. Mitsufuji (Kyoto Prefectural University of Medicine) Stomach Stomach R:520(2) G:500(2) B:405(3) Pattern: 4 Wavelength (gain)Conventional imageImage after indigo carmine spraying R:560 G:500 B:475 Prototype Wavelength R:560 G:500 B:475 Prototype Wavelength BoundaryMagnifyingEnteroscopy MagnificationBoundaryasculatureMagnifyingPathologicalEnteroscopyTransnasal MagnificationExamination of the Boundary and Area using FICE ment of color contrast, the boundary between the affected area and the background mucosa is clearly tion. The emphasis of the cancerous lesion helps to determine the bounds of resection by endoscopic Conventional image Photographs provided by Dr. Mitsufuji (Kyoto Prefectural University of Medicine)Photographs provided by Dr. Mitsufuji (Kyoto Pr Stomach Stomach BoundaryMagnifyingEnteroscopy MagnificationBoundaryasculatureMagnifyingPathologicalEnteroscopyTransnasal Magnification Examination of the Boundary and Area using FICE Site: StomachC

18 ase: MALT lymphomaFindings: MALT lymphom
ase: MALT lymphomaFindings: MALT lymphoma in the greater curvature of the gastric body. FICE enhancement of color contrastmakes the boundary between the affected area and the background mucosa more clear. Conventional image Photographs provided by Dr. Mitsufuji (Kyoto Prefectural University of Medicine) Stomach R:560 G:500 B:475 Prototype Wavelength R:540 G:500 B:445 Prototype Wavelength R:550 G:500 B:470 Prototype Wavelength Observation of Vasculature using FICE BoundaryMagnifyingEnteroscopy MagnificationBoundaryMagnifyingPathologicalEnteroscopyTransnasal Photographs provided by Dr. Yoshida (Hiroshima University) Esophagus Esophagus : SCC, 0-IIc, m1: In magnifying endoscopy, the use of FICE allows clear visualization of microvessels. Observation of Vasculature using FICE Esophagus : Normal esophageal mucosa : SCC, 0-IIc, m1: In magnifying endoscopy, the use of FICE allows clear visualization of destructed, thread-likemicrovessels and easy identification of the vascular pattern. BoundaryMagnifyingEnteroscopy MagnificationBoundaryMagnifyingPathologicalEnteroscopyTransnasal Magnification Photographs provided by Dr. Osawa and Dr. Yoshizawa (Jichi M

19 edical University)Photographs provided b
edical University)Photographs provided by Dr. Mitsufuji (Kyoto Prefectural University of Medicine) Stomach Stomach : StomachCase: Gastric antral vascular ectasia (GAVE)sented to hospital. Compared with the conventional endoscopic image, dilated capillaries are high-lighted with good contrast in the FICE image. : StomachCase: Early gastric cancer, 0-IIc, sm microinvasive carcinoma (150 : At low magnification (left), the mucosal pit pattern of cancerous area is irregular, and the boundarybetween the affected area and the background mucosa is clearly visualized. At high magnification(right), cappillary networks are visible, and an abnormal large blood vessel that is distinct from thesurrounding fine vessels are detected (arrow). Observation of Vasculature using FICE Stomach : StomachCase: 0-IIc, well differentiated adenocarcinoma Site: StomachCase: Gastric antral vascular ectasia (GAVE)illaries are enhanced with good contrast in the FICE image. Photographs provided by Dr. Yoshida (Hiroshima University) Stomach BoundaryMagnifyingEnteroscopy MagnificationBoundaryMagnifyingPathologicalEnteroscopyTransnasal Magnification Atlas of Spectral Endoscopic Imag

20 es Observation of Vasculature using FI
es Observation of Vasculature using FICE Observation of Vasculature using FICE Site: Large intestineCase: AdenomaFindings: The vascular pattern is visible to some extent on the conventional low-magnified image. Visualizationof smaller vessels is, furthermore, enhanced on the FICE image. Site: Large intestineCase: AdenomaFindings: The vascular pattern of the polyp is unclear on the conventional low-magnified image but clearlyvisualized on the FICE image. Photographs provided by Dr. Togashi (Jichi Medical University)Photographs provided by Dr. Togashi (Jichi Medical University) Conventional image Image after indigo carmine spraying Image after indigo carmine spraying Large intestine Large intestine Site: Large intestineCase: Normal mucosaFindings: The vasculature in normal mucosa is clearly visible, and a small polyp is easily identifiable. Site: Large intestineCase: Normal mucosaFindings: The vascular pattern in the distal portion is also clearly visualized. Conventional image Photographs provided by Dr. Togashi (Jichi Medical University)Conventional image Large intestine Large intestine R:540 G:490 B:420 Prototype Wavelength R:540 G:490 B:420 Protot

21 ype Wavelength R:540 G:490 B:420 Protot
ype Wavelength R:540 G:490 B:420 Prototype Wavelength R:540 G:490 B:420 Prototype WavelengthConventional image BoundaryMagnifyingEnteroscopy MagnificationBoundaryMagnifyingPathologicalEnteroscopyTransnasal Magnification Observation of Vasculature using FICE and microvascular patterns.Magnifying Endoscopy with FICE Site: Large intestineCase: Moderately differentiated adenocarcinoma (3500 µm of invasion)Findings: On the FICE image, the vascular pattern on the surface of the lesion is clearly visualized. Irregularvascular dilatation suggests submucosal, highly invasive carcinoma. Site: Large intestine (sigmoid colon)Case: Early colon cancer, carcinoma in adenomaFindings: Is + IIc lesion in the sigmoid colon. FICE clearly visualizes tortuous, abnormal blood vessels aroundthe tumor and disrupted vascular network in the depressed area. The lesion is found to be carcinomain adenoma invading the submucosal layer (1200 µm). Photographs provided by Dr. Togashi (Jichi Medical University) Conventional magnified image Photographs provided by Dr. Mitsufuji (Kyoto Prefectural University of Medicine) Conventional image Histopathological image Large intestine L

22 arge intestine R:540 G:490 B:420 Prototy
arge intestine R:540 G:490 B:420 Prototype Wavelength R:540 G:500 B:445 Prototype Wavelength BoundaryMagnifyingEnteroscopy MagnificationBoundaryVasculatureMagnifyingathologicalEnteroscopyTransnasal Magnification Photographs provided by Dr. Osawa and Dr. Yoshizawa (Jichi Medical University) Stomach Stomach : StomachCase: 0-IIc moderately differentiated tubular adenocarcinoma : Compared with the conventional endoscopic image,the reddish change of regenerated epithelium is Magnifying Endoscopy with FICE Esophagus : Early esophageal cancer, IIcFindings : Early esophageal cancer, IIcFindingsThe contrast between the loops and deep vessels is enhanced. Esophagus BoundaryMagnifyingEnteroscopy MagnificationBoundaryVasculatureMagnifyingathologicalEnteroscopyTransnasal Magnification Atlas of Spectral Endoscopic Images Magnifying Endoscopy with FICE Conventional magnified image Conventional magnified image 43Photographs provided by Dr. Mitsufuji (Kyoto Prefectural University of Medicine)Photographs provided by Dr. Yoshida (Hiroshima University) Stomach Large intestine Site: StomachCase�: Early gastric cancer, 0-IIc, well-differentiated adenocarci

23 noma (tub1 tub2), 117 mm in sizeFinding
noma (tub1 tub2), 117 mm in sizeFindings: Type IIc early gastric cancer in the anterior wall of the upper body of the stomach. Compared withconventional magnifying endoscopy, the use of FICE allows clear visualization of the nonstructuralmucosal pattern in the depressed lesion (disappearance of the fine mucosal pattern) as well as large Site: Large intestineCase: IIa + IIc, well differentiated adenocarcinomaFindings: Magnifying endoscopy with FICE facilitates identification of a irregularity of superficial capillary. Magnifying Endoscopy with FICE Stomach Site: StomachCase�: Early gastric cancer, 0-IIc, well-differentiated adenocarcinoma (tub1 tub2), 88 mm in size, sm(550 um in depth)Findings: Type IIc + IIa lesion in the greater curvature of the pyloric antrum. Magnifying endoscopy with FICEshows abnormal mucosal pit pattern and tumor vessels. Site: StomachCase: Early gastric cancer, 0-IIc, signet-ring cell carcinomaFindings: Type 0-IIc lesion in the greater curvature of the lower body of the stomach. Compared with conven-tional magnifying endoscopy, the use of FICE allows clear visualization of the nonstructural pattern inthe depressed lesi

24 on (disappearance of the fine mucosal pa
on (disappearance of the fine mucosal pattern) and irregular tumor vessels. Photographs provided by Dr. Mitsufuji (Kyoto Prefectural University of Medicine) Conventional magnified image Conventional magnified image 42Photographs provided by Dr. Mitsufuji (Kyoto Prefectural University of Medicine) Stomach R:540 G:415 B:415 Prototype Wavelength R:555 G:500 B:445 Prototype Wavelength R:540 G:500 B:445 Prototype Wavelength R:530 G:455 B:455 Prototype Wavelength BoundaryMagnifyingEnteroscopy MagnificationBoundaryVasculatureMagnifyingathologicalEnteroscopyTransnasal Magnification Atlas of Spectral Endoscopic Images Magnifying Endoscopy with FICE Magnifying Endoscopy with FICE Site: Large intestineCase: Laterally spreading tummor (LST), adenoma with moderate atypiaFindings: LST-G (LST, granular type) in the ascending colon. FICE clearly visualizes uniform, meshed patternvessels, suggesting tubular adenoma. It is found to be adenoma with moderate atypia. Site: Large intestineCase: AdenomaFindings: Is, severe atypical tubular adenoma 10 mm in diameter. FICE significantly improves the visibility ofthe lesion. Magnifying endoscopy clearly shows the boundar

25 y between the normal mucosa and ade-noma
y between the normal mucosa and ade-nomatous area. Site: Large intestineCase: Isp, moderately differentiated adenocarcinoma in tubulovillous adenomaFindings: Magnifying endoscopy with FICE clearly visualizes regular microvessels. Conventional magnified image Photographs provided by Dr. Mitsufuji (Kyoto Prefectural University of Medicine)Photographs provided by Dr. Togashi (Jichi Medical University)Photographs provided by Dr. Yoshida (Hiroshima University) Conventional image Conventional image Site: Large intestine (Ra)Case: Is, Intramucosal carcinoma (tubular adenoma including intramucosal adenocarcinoma) 12 7 mm Findings: Lobular, elevated lesion. FICE allows clearer visualization of the lesion. The mucosal lesion is mostlikely carcinoma. Photographs provided by Dr. Mitooka (Ashiya Mitooka Clinic) Conventional image Large intestine Large intestine Large intestine Large intestine R:560 G:500 B:475 Prototype Wavelength R:540 G:490 B:420 Prototype Wavelength R:520 G:500 B:405 Prototype Wavelength R:520(2) G:500(2) B:405(3) Pattern: 4 Wavelength (gain) BoundaryMagnifyingEnteroscopy MagnificationBoundaryVasculatureMagnifyingPathologicalEnteroscopyTransn

26 asal Magnification Normal esophageal m
asal Magnification Normal esophageal mucosa Magnified image of normal esophageal mucosa the lamina propria mucosa (lpm). These vessels branch from thicker vessels deep in the submucosal laries that originate from network-like vessels in the lpm, rising toward the subepithelial papillae.Intra-subepithelial papillary vessels exist in the subepithelial papillae and are the lamina propria mucosae forming papillae. They are capillaries 10 to 15 min diameter that supplyblood to the epithelium. ance of blood vessels, differentiation between benign and malignant diseases, and estimation of the depth of inva-type 1: Thin, linear capillaries in the subepithelial papilla with less atypical epithelia.type 2: Distended, dilated vessels with branched or spiral enlargement. The vascular structure and arrangementare regular. This type is associated with inflammatory changes.type 3: Destruction of vessels in the subepithelial papilla, spiral vessels with an irregular caliber, and crushedvessels with red spots. The arrangement of the vessels was irregular. type 3 was generally seen in m1: dilated spiral vessels in papillary protrusions with stroma aggregated like sal

27 mon roetype 4: Characterized by multi-la
mon roetype 4: Characterized by multi-layered (ML), irregularly branched (IB), reticular vessels with an irregular caliber( R ),and generally seen in cancers with m2 or deeper invasion. tumor invasion. In a large AVA, abnormal blood vessels appear, which form a surrounded area with BoundaryMagnifyingEnteroscopy MagnificationBoundaryVasculatureMagnifyingPathologicalEnteroscopyTransnasal Magnification Atlas of Spectral Endoscopic Images Vasculature and Magnification asculature and Magnification kenfilamentous Photographs provided by Dr. Arima (Saitama Cancer Center)Photographs provided by Dr. Arima (Saitama Cancer Center)Conventional magnified imageHistopathological image ype 0-IIb esophageal cancer Depth of invasion m1 (microvascular pattern type 3a) Findings : Slightly opaque, mild esophagitis withunclear blood vessels. In magnifyingendoscopy, vessels are extended with Conventional imageConventional imageConventional magnified image Reflux esophagitis (microvascular pattern type 2) R:525(3) G:495(4) B:495(3) Pattern: M Wavelength (gain) R:525(3) G:495(4) B:495(3) Pattern: M Wavelength (gain) Erythematousareaof 10mm size at thelesion,irregularly

28 discoloredsmall o'clockpositionmagnifyin
discoloredsmall o'clockpositionmagnifyingen-crushedvesselscarcinoma.EMR Photographs provided by Dr. Arima (Saitama Cancer Center)Photographs provided by Dr. Arima (Saitama Cancer Center) ype 0-IIc esophageal cancer Depth of invasion m1 (microvascular pattern type 3b) ype 0-IIc esophageal cancer Depth of invasion m2 (microvascular pattern type 4S)Conventional imageConventional magnified image R:525(3) G:495(4) B:495(3) Pattern: M Wavelength (gain) R:525(3) G:495(4) B:495(3) Pattern: M Wavelength (gain)Findings:Findings:Findings: Findings: Histopathological image asculature and Magnification 5IJTDIBQUFSQSFTFOUTDBTFTJOXIJDIBQBUIPMPHJDBMEJBHOPTJTJ BoundaryMagnifyingEnteroscopy MagnificationBoundaryVasculatureMagnifyingEnteroscopyTransnasal Magnification Stomach : StomachCase: Elevated lesion in the cardia of the stomach athological Diagnosis Using FICE Stomach : StomachCase : StomachCase: Lesion with both elevated and depressed areas in the greater curvature of the gastric corpus: IIa + IIc lesion in the gastric corpus. Stomach BoundaryMagnifyingEnteroscopy MagnificationBoundar

29 yVasculatureMagnifyingEnteroscopyTransna
yVasculatureMagnifyingEnteroscopyTransnasal Magnification Atlas of Spectral Endoscopic Images Pathological Diagnosis Using FICE athological Diagnosis Using FICE Large intestine Site: StomachCase: Early gastric cancer, 0-IIc, signet ring cell carcinoma.Findings: The reddish mucosa associated with the deformation of greater curvature of the gastric angle. On theconventional endoscopic image, a slightly reddish mucosal change in the greater curvature of the gas-tric angle is observed. The reddish change is enhanced on the FICE image. Magnifying endoscopy Conventional image Photographs provided by Dr. Osawa and Dr. Yoshizawa (Jichi Medical University) Stomach FICE booth lectureDr. Herbert Burgos (Gastroclinica, Costa Rica) lecturing on FICEat Fujinon’s booth during DDW 2007, USAHistopathological image Site: Large intestineCase: Elevated lesion covering one-third of the lumen.Findings: Non-granular type laterally spreading tumor (LST-NG) 19 15 mm in diameter, well-differentiatedadenocarcinoma (depth of invasion is m).LST-NG, which is not clear on the conventional image, is clearly shown with the use of FICE. Conventional image Photographs provi

30 ded by Dr. Togashi (Jichi Medical Univer
ded by Dr. Togashi (Jichi Medical University) R:550(2) G:500(5) B:470(4) Pattern: MWavelength (gain) R:540 G:490 B:420 Prototype Wavelength BoundaryMagnifyingEnteroscopy MagnificationBoundaryVasculatureMagnifyingPathologicalEnteroscopy Magnification Enteroscopy with FICE Findingsabout 30 years after bypass surgery with side-to-side anastomosis of the ileum for treatment of adhe- Site: Small intestine ulcerFindingspy eight months ago. The ulcer base observed during the previous examination disappeared. Thewhitish scar is more clearly visible compared with the surrounding area with the use of FICE. Conventional image Photographs provided by Dr. Yano (Jichi Medical University) BoundaryMagnifyingEnteroscopy MagnificationBoundaryVasculatureMagnifyingPathologicalEnteroscopy Magnification 5IJTDIBQUFSQSFTFOUTDBTFTJOXIJDIUSBOTOBTBM Photographs provided by Dr. Yanai and Dr. Tanioka (Kanmon Medical Center) Stomach Stomach : Anterior wall of the body of the stomachCase: Gastric adenomaFindings: White granular elevations approximately 10 mm in diameter are found in the anterior wall of thebody of the

31 stomach. Compared with the conventional
stomach. Compared with the conventional image, contrast of the lesion is more : Gastric antriumCase: Early gastric cancerFindings: On the conventional image, a partially elevated tumor is observed near the pyloric ring. The FICEimage reveals milder elevations extending to the surrounding area. ransnasal Endoscopy with FICE BoundaryMagnifyingEnteroscopy MagnificationBoundaryVasculatureMagnifyingPathologicalEnteroscopy Magnification Atlas of Spectral Endoscopic Images Transnasal Endoscopy with FICE Conventional image Conventional image 61Photographs provided by Dr. Miyawaki (Izumo Central Clinic)Photographs provided by Dr. Miyawaki (Izumo Central Clinic) Stomach Stomach Site: StomachCase: gastric cancerFindings: The FICE image clearly shows the surface irregularity of the depressed area and fold convergence inthe surrounding area in type IIc gastric cancer. Site: StomachCase: gastric cancerFindings: The FICE image enhances the surface pattern of gastric cancer with a depressed lesion IIc in thegreater curvature of the gastric corpus. ransnasal Endoscopy with FICE Site: StomachCase: GastritisFindings: Blood vessels in the atrophic gastritis are

32 more clearly visible in the FICE image.
more clearly visible in the FICE image. This may be use-ful for recognition of the area of atrophic change of the gastric body mucosa. Site: StomachCase: GastritisFindings: Verrucous erosion in the erosive gastritis is clearly visible. Photographs provided by Dr. Yanai and Dr. Tanioka (Kanmon Medical Center) Conventional image Photographs provided by Dr. Yanai and Dr. Tanioka (Kanmon Medical Center) Conventional image Stomach Stomach R:525(3) G:495(4) B:495(3) Pattern: MWavelength (gain) R:550(4) G:500(5) B:470(3) Pattern: MWavelength (gain) R:550(2) G:500(2) B:470(3) Pattern: 2Wavelength (gain) R:550(2) G:500(2) B:470(3) Pattern: 2Wavelength (gain) BoundaryMagnifyingEnteroscopy MagnificationBoundaryVasculatureMagnifyingPathologicalEnteroscopy ransnasal Endoscopy with FICE Stomach : Gastric antrumCaseFindings: On the conventional endoscopic image, a mild erythematous change is found in the anterior wall ofthe antrum. The FICE image enhances its change compared with the conventional image. : DuodenumCaseFindings: Erosions are found in the anterior wall of the duodenal bulb. Compared with the conventionalimage, the reddish mucosal changes are enha