/
Global Economic Governance Initiative Global Economic Governance Initiative

Global Economic Governance Initiative - PDF document

mackenzie
mackenzie . @mackenzie
Follow
345 views
Uploaded On 2021-09-26

Global Economic Governance Initiative - PPT Presentation

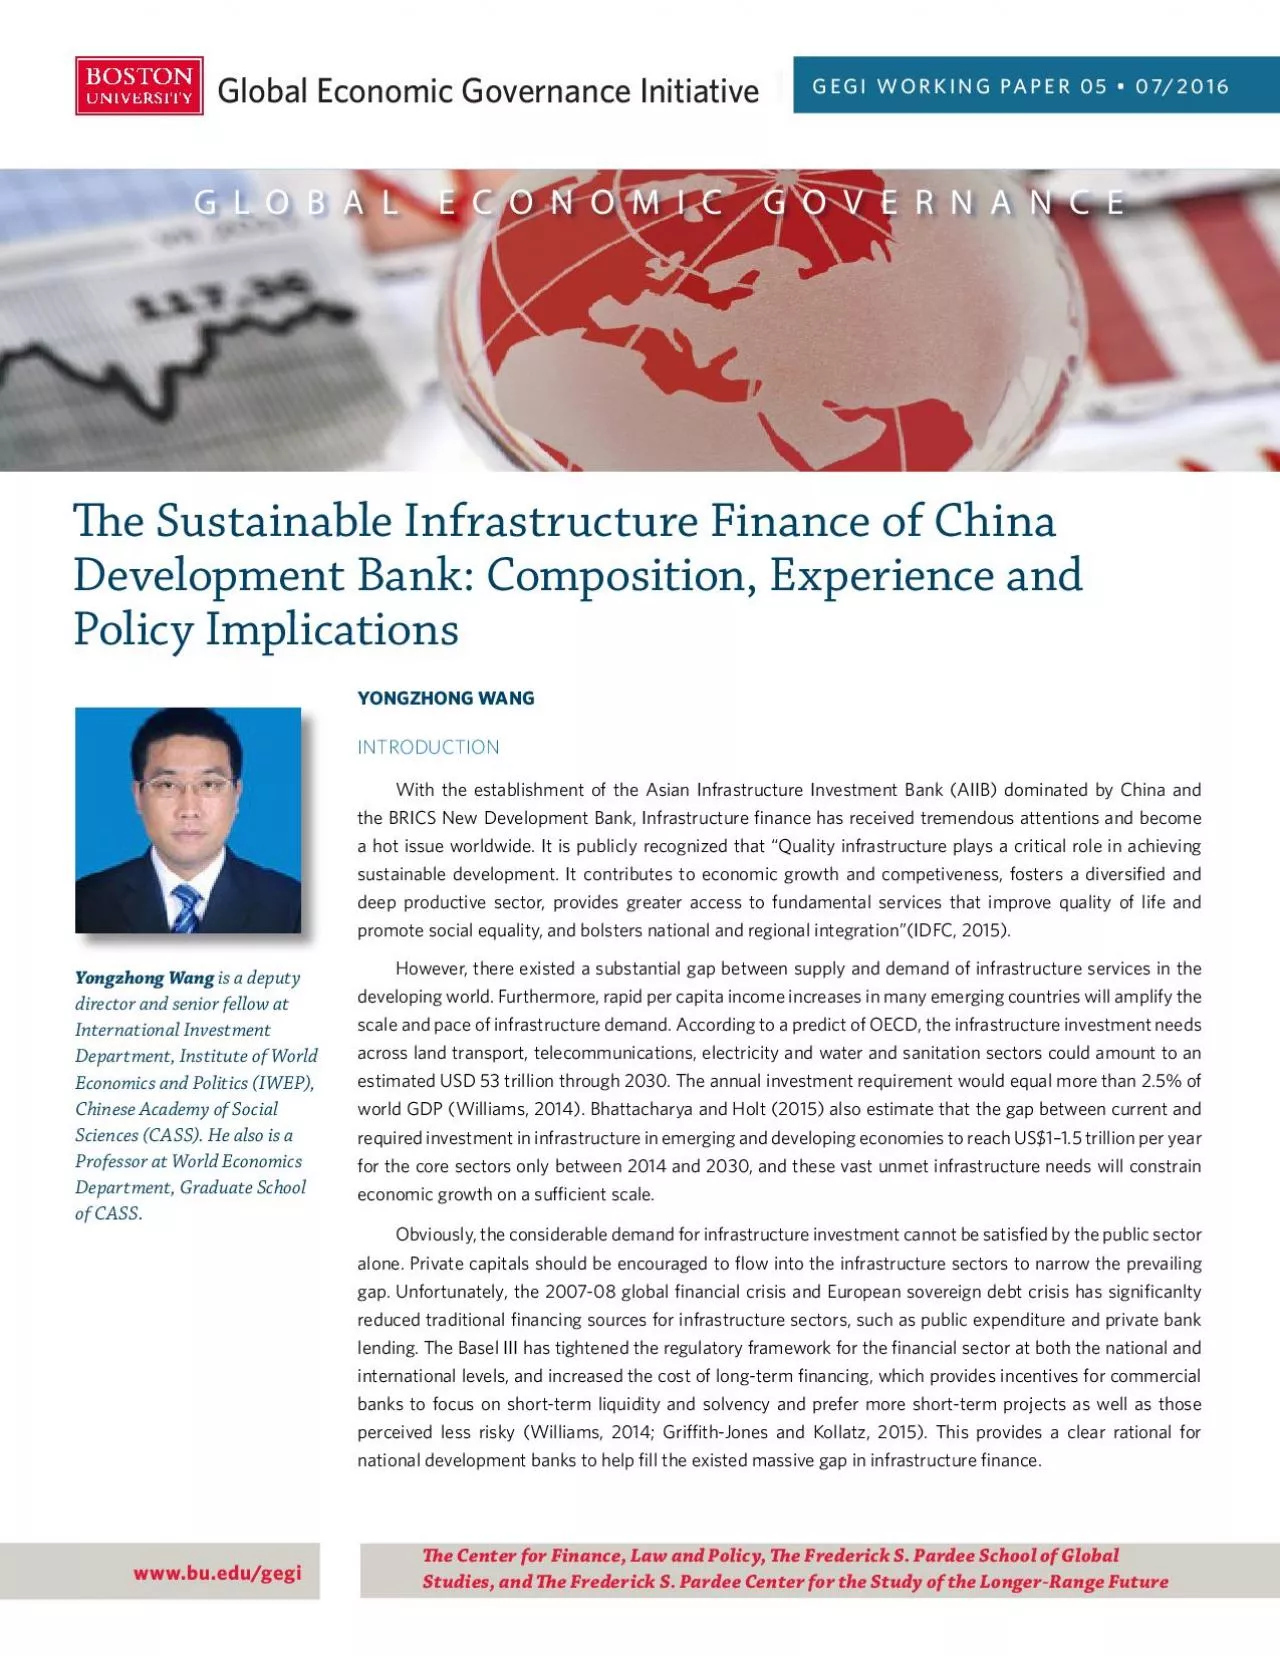
wwwbuedugegiYongzhong Wangis a deputy International Investment Department Institute of World Economics and Politics IWEP Chinese Academy of Social Sciences CASS He also is a Professor at World Econom ID: 886493

cdb infrastructure 146 x00660069 infrastructure cdb x00660069 146 china development loans bank investment loan total projects nance banks 2015

Share:

Link:

Embed:

Download Presentation from below link

Download Pdf The PPT/PDF document "Global Economic Governance Initiative" is the property of its rightful owner. Permission is granted to download and print the materials on this web site for personal, non-commercial use only, and to display it on your personal computer provided you do not modify the materials and that you retain all copyright notices contained in the materials. By downloading content from our website, you accept the terms of this agreement.


Presentation Transcript

1 www.bu.edu/ gegi Global Economic Governa
www.bu.edu/ gegi Global Economic Governance Initiative Yongzhong Wang is a deputy International Investment Department, Institute of World Economics and Politics (IWEP), Chinese Academy of Social Sciences (CASS). He also is a Professor at World Economics of CASS. e Sustainable Infrastructure Finance of China Development Bank: Composition, Experience and Policy Implications YONGZHONG WANG INTRODUCTION With the establishment of the Asian Infrastructure Investment Bank (AIIB) dominated by China and the BRICS New Development Bank, Infrastructure nance has received tremendous attentions and become a hot issue worldwide. It is publicly recognized that “Quality infrastructure plays a critical role in achieving sustainable development. It contributes to economic growth and competiveness, fosters a diversied and deep productive sector, provides greater access to fundamental services that improve quality of life and promote social equality, and bolsters national and regional integration”(IDFC, 2015). developing world. Furthermore, rapid per capita income increases in many emerging countries will amplify the scale and pace of infrastructure demand. According to a predict of OECD, the infrastructure investment needs across land transport, telecommunications, electricity and water and sanitation sectors could amount to an estimated USD 53 trillion through 2030. The annual investment requirement would equal more than 2.5% of world GDP (Williams, 2014). Bhattacharya and Holt (2015) also estimate that the gap between current and required investment in infrastructure in emerging and developing economies to reach US$1–1.5 trillion per year economic growth on a sucient scale. Obviously, the considerable demand for infrastructure investment cannot be satised by the public sector alone. Private capitals should be encouraged to ow into the infrastructure sectors to narrow the prevailing gap. Unfortunately, the 2007-08 global nancial crisis and European sovereign debt crisis has signicanlty reduced traditional nancing sources for infrastructure sectors, such as public expenditure and

2 private bank lending. The Basel III ha
private bank lending. The Basel III has tightened the regulatory framework for the nancial sector at both the national and international levels, and increased the cost of long-term nancing, which provides incentives for commercial banks to focus on short-term liquidity and solvency and prefer more short-term projects as well as those perceived less risky (Williams, 2014; Grith-Jones and Kollatz, 2015). This provides a clear rational for national development banks to help ll the existed massive gap in infrastructure nance. GEGI WORKING PAPER 05  07/2016 Global Economic Governance Initiative GLOBAL ECONOMIC GOVERNANCE e Center for Finance, Law and Policy, e Frederick S. Pardee School of Global Studies, and e Frederick S. Pardee Center for the Study of the Longer-Range Future 2 Table 1 National Development Banks in East Asia Name Year Capital ($bn) Loan ($bn) Asset ($bn) % of GDP Development Bank of Japan(DBJ) Established in 1951 10.1 112.0 136.0 3.0% Korea Development Bank(KDB) Established in 1954 Privatized in Oct. 2009 Re-publicized in Jan. 2015 23.3 123.0 199.5 14.1% Korea Finance Corporation (KoFC) Established in 2009 Merged with KDB in Jan.2015 27.3 123.9 245.1 17.4% KDB KoFC Relaunched in 2015 50.6 246.9 444.6 31.5% China Development Bank (CDB) Established in 1994 157.7 1280.9 1663.9 16.1% Source: DBJ, KDB, CDB and BVD. Note: The calculation date of the amount of capital, asset, and loan of DBJ is March 31, 2015, and that of KDB and KoFC is December 31, 2014 and December 31, 2013 respectively. The calculation date of CDB’s asset and loan is December 31, 2014, while that of capital is August 2015. In regards with infrastructure �nance, China Development Bank (CDB) is a successful and aggressive one among national development banks. CDB is a wholesale lender specializing in providing medium-to long-term �nancing facilities, focuses on the development of infrastructures, basic and key industries. CDB ranked 122 nd among the world 500 top banks in 2014 and has maintained the status as one of the largest development banks in the world for several conse

3 cutive years. As the end of 2014, the m
cutive years. As the end of 2014, the magnitude of CDB’s asset and loan increased to $1663.9bn, $1280.9bn, not only substantially surpasses those of its main peers in East Asia, like Development Bank of Japan (DBJ) and Korea Development Bank (KDB) (see Table 1) 1 , but also signi�cantly exceeds those of multinational and regional development banks such as World Development Bank and Asian Development Bank. However, in perspective of the share of asset in GDP, the recently relaunched Korea Development Bank (KDB merged KoFC in Jan. 2015) reached 31.5%, which was substantially higher than that of CDB and DBJ, and their level were 16.1% and 3.0% respectively. 1 Korea Development Bank (KDB) is a state-owned bank founded in 1954. KDB’s primary business area is corporate banking and it has provided huge amounts of industrial capital to Korean enterprises through loans, investments, and guarantees since its nation’s largest state policy lender, was of�cially started its privatization process, and which operated as a subsidiary of KDB Fi - nancial Group. At the same time, the Korea Finance Corporation (KoFC) was established, a quasi-sovereign agency with a 100% direct ownership by the Korean government, mandated to support the sound growth of the Korean economy, which inherited KDB’s some policy-�nancing business involving government support for certain areas of business and industry. The intention of the former Lee Myung-bak administration to privatize KDB is to make KDB a specialized investment like JPM - organ or Morgan Stanley, but President Park Geun-hye withdrew the privatization plan in August 2014 and in favor of the merger and KoFC were announced to be merged and relaunched. KDB was recategorized as a public institution, and KoFC’s overseas The merger will enhance both institutions’ roles in peninsula (Song, 2014). 3 In the new century, with China became a main export platform in the world and the application of China “Go Global” Strategy, CDB another important mission is to ensure the stability of external resources and energy supply through providing overseas l

4 oans. CDB has �nanced a numbe
oans. CDB has �nanced a number of high- pro�le cross-border energy-backed loans to foreign government entities and energy companies, such as Venezuela, Russia, Brazil, Ecuador, and Argentina, featuring with large magnitude and long-term. The collapse of prices of petroleum and resultant economic crisis in Latin America particularly Venezuela, has constituted a serious threat to the smooth repayment of CDB’s overseas petroleum-backed loans. With the application of the initiative of “One Belt and One Road” (The Silk Road Economic Belt and the 21st-century Maritime Silk Road), it is expected that the expansion of CDB’s overseas assets will accelerate in the future years. According to the sources from media, CDB has reserved dozens of megaprojects in infrastructure, resources and other key industries, in the regions along the “One Belt and One Road”. To support the active involvement in the construction of “One Belt and One Road”, CDB had received a capital injection of $38bn from the Chinese Parasol Tree Investment Platform Co. in July 2015, an investment vehicle of Chinese foreign reserve under the State Administration of Foreign Exchange (SAFE). This makes the PBOC become the third largest shareholder of CDB, with a share of 27.19%, just next to Ministry of Finance of China, and the Central Huijin Company. In the past twenty decades, China’s infrastructure construction and development has achieved signi�cant achievements, shifting from a country de�cient in infrastructure to one which is strong in infrastructure design, construction and �nance (China still has a long distance to overtake western peers in infrastructures management and operation). The gap between the supply and demand of infrastructure in China has been substantially reduced. In the process, CDB has played a leading and catalytic role. Taking advantages of sovereign credit and the status of policy bank, it not only directly lends large amount of long-term fund to infrastructure sectors, but also indirectly encourages capitals of commercial banks and private inv

5 estors to �ow into the sector
estors to �ow into the sectors through providing planning service, initial credit support, helping to create investment and �nancing vehicles, technical assistance, risk mitigation and guarantee, and so on. It is critically important for national development banks in emerging and developing countries, and new regional and multinational development banks such as the AIIB and the New Development Bank, to learn from the experiences and lessons of CDB in sustainable infrastructure �nance. To this end, the paper will conduct an in-depth analysis on the business models, loan compositions, cases, and practices and policies of CDB in infrastructure �nance. The framework of the rest of the paper is arranged as follows: the �rst section analyzes CDB’s business model in terms of assets, overseas transactions, M&A activities, debt issuance, and crowd-in effect. The second section estimates the size and composition of CDB’s loans to infrastructure and sustainable infrastructure 4 sectors, based on the data of CDB, China-Latin America Finance Database, and Dealogic database. The third section discusses CDB’s Wuhu Model and Tianjin Model in infrastructure �nance. The fourth section summarizes CDB’s practices and policies in sustainable infrastructure �nance. The 2. Business Models 2.1 Assets China Development Bank (hereafter CDB) focuses on national economic strategy and provides medium-to-long run �nancing facilities to the economy, with the aim to break through production bottlenecks and assist in the long-run sustainable development of Chinese economy and society. To implement the mission, CDB has taken following actions: supporting the development of national infrastructure, basic industry, key emerging sectors, and national priority projects; promoting coordinated regional development and urbanization by �nancing low-income housing, small business, agricultural/rural investment, education, healthcare, and environment initiatives; facilitating China’s cross-border investment and global business cooperation (CDB, 2015) 2

6 . Most of CDB’s loans were alloca
. Most of CDB’s loans were allocated into infrastructure projects, basic industries, and pillar industries, with an aggregate volume of $1490.3bn during the period from 2006 to 2014 (see Table 2). After decades of rapid expansion in business activities, particularly since the global �nancial crisis, CDB is now the world’s largest development bank in terms of total assets (which rose from $107.6bn in 2001 to $1663.9bn in 2014), with an average annual growth rate of 23.7%, and an increasing share in China’s GDP (which also rose signi�cantly from 8.08% in 2001 to 16.07% in 2014). Currently, the �rst priority of CDB is to support large-scale national projects such as the North-South Water Diversion Project, the Three Gorges Dam, as well as local infrastructure projects like airports, roads, high-speed railways, and hydropower stations. 2.2 Overseas Transactions Since the creation of the ‘Going Out’ policy at the turn of the century, CDB makes use of different methods to promote overseas investments in infrastructure projects, expand its global portfolio and support Chinese companies abroad (Provaggi, 2013). CDB has played an important role in �nancing the overseas activities of Chinese state-owned enterprises, particularly aiding SOEs to acquire oil and other natural resources. It also has directly extended energy (oil)-backed loans to foreign authorities to guarantee the supply of natural resources and energy to the Chinese economy. In fact, supporting Chinese business expansion abroad through mid-and long-term credit 2 CDB, “Mission Statement”, http://www.cdb.com.cn/english/Column.asp? ColumnId=99, October 2015. 5 is one of CDB’s �ve priority areas. To implement the “Go Global” strategy and enhance the stability of external resources supply, CDB also has played an important role in providing credit to Chinese enterprises’ cross-border transactions and direct investment, particularly natural resources and infrastructure projects. CDB has set up work teams to go and live in around one hundred countries and made each branch

7 at home look after a different part of
at home look after a different part of the world, for example, the Shandong branch handles Venezuela, and the Shijiazhuang branch in Hebei Province handles Peru, although large investments have to be sent to the headquarter (Sanderson and Forsythe, 2013). 6 Table 2 Financial Indicators of China Development Bank Group TableFinancial Indicators of China Development Bank Group(as of the end of calendar year, billions of USD, consolidated) 2001 2002 2003 2004 2005 2006 2007 2008 2009 2010 2011 2012 2013 2014 Assets107.6 125.8 154.5 190.2 235.3 296.7 397.1 560.1 665.7 748.3 947.2 1207.0 1353.3 1663.9 Gross Loans90.9 108.0 137.5 170.1 211.2 258.3 310.2 425.0 543.8 660.3 837.3 1030.1 1181.5 1280.9 Loans to Infrabasic industries89.3 107.1 112.6 194.9 202.3 211.1 213.3 245.3 114.5 Foreign Currency Loans30.764.597.4134.6187.3224.5250.5272.8* Loans and Advances to Banks6.6 10.4 20.1 2.8 30.6 7.2 284.4 556.7 117.2 215.7 496.0 825.4 836.2 2108.8 Liabilities100.2 116.7 143.7 177.2 219.1 276.4 349.1 509.2 610.1 689.6 879.8 1127.1 1260.5 1554.2 Customer Deposits3.9 4.8 7.9 11.6 17.0 19.9 21.7 36.0 56.6 57.4 62.5 97.7 113.1 175.4 Long Term Senior Debt 89.3 103.9 128.6 151.5 186.0 207.7 279.4 374.7 424.1 534.1 663.2 831.2 945.6 1009.2 Deposits from Banks0.7 1.9 1.3 0.7 7.9 9.5 0.7 115.6 160.4 191.3 425.1 469.3 410.9 1408.5 ShortTerm Borrowings34.9 44.6 51.0 86.6 66.2 304.6 281.4 471.9 604.8 300.2 366.2 461.8 490.7 527.5 Subordinated Borrowing20.0 40.3 40.3 40.3 40.3 80.4 79.7 99.6 119.6 119.5 96.6 Equity7.5 9.1 10.8 13.0 16.2 20.3 47.9 50.9 55.5 58.8 67.3 79.9 92.8 109.7 Guarantees6.1 18.8 39.7 57.6 42.0 19.9 12.3 14.5 19.1 13.0 12.7 Total Capital Ratio 8.33 11.58 10.26 10.50 9.15 8.05 12

8 .77 11.31 11.83 10.87 10.78 10.92
.77 11.31 11.83 10.87 10.78 10.92 11.28 11.88 Asset/GDP (%) 8.08 8.61 9.36 9.80 10.37 10.87 11.27 12.29 13.16 12.39 12.64 14.26 14.26 16.07 Impaired Loans Ratio 1.78 1.34 1.18 0.86 0.72 0.59 0.90 0.94 0.68 0.40 0.30 0.48 0.65 Return On Avg. Assets (%) 1.25 1.23 1.14 1.22 1.31 1.31 1.14 0.75 0.80 0.78 0.81 0.92 1.02 1.06 Return On Avg. Loans (%)5.995.575.415.745.956.487.165.625.185.576.085.865.87 Return On Avg. Equity (%)18.01 17.36 16.03 17.68 19.15 19.16 11.65 7.27 9.18 9.60 10.86 13.40 15.10 15.82 Note:Loans to Infrabasic industries means new RMB loans to infrastructure projects, and basic and pillar industries(flow not stock)longerm enior ebt denotes the senior debt which matures after 1 s the end of 2014, the outstanding scale of CDB’s crossbordersloan reached $272.8bn.Source: BVDand CDB 7 The rising speed of CDB in cross-border �nance is quite rapid: at the end of 2014, the bank reported that its outstanding foreign currency loans amounted to $272.8bn, a more than sevenfold increase over its foreign currency lending eight years earlier, with an average annual growth rate of 39.8%. The CDB has provided cross-border loans in more than 90 countries and regions around the world. The volume of CDB’s overseas loans has steadily surpassed Bank of China, the bank traditionally dealing with foreign exchange and lending overseas, as the biggest overseas lender in China for some years. However, CDB has been overtaken by Industrial and Commercial Bank of China in recent years due to the latter’s aggressive expansion in international business. As Figure 1 shows, CDB’s overseas loans are mainly allocates into the region of Asia-Paci�c, Americas, and Euro-Asia, and the amount of loans lent to Africa, and Euro-Africa is much lower. As the end of 2014, the balance of CDB’s loan to Asia-Paci�c amounted to $ 153.0bn, with a share in its total cross-border loans of 56.1%, and that of CDB’s credit to Americas, and Euro-Asia reached $51.3bn and $36.6bn respectively, with a

9 share of 18.8% and 13.4%. Figure 1 Regio
share of 18.8% and 13.4%. Figure 1 Regional Structure of CDB’s Overseas Loan Balance as the end of 2014 ($bn) Source: CDB. According to an incomplete statistics of Dealogic Database and China-Latin America Finance Database 3 , in addition to some international �nancial centers like Hong Kong and Singapore, CDB’s cross-border credits were mainly allocated into countries rich in energy and resources (oil, gas and mineral ores), such as Venezuela, Russia, Brazil, Argentina, Australia, and Peru, and China’s neighbors in Asia like India, Uzbekistan, Indonesia, Vietnam, Pakistan, and Kazakhstan (see Table 3 Due to limited capabilities of collecting information of bank loans, Dealogic Database and China-Latin America Finance Database can’t fully search and track CDB’s loans. Regarding the scale and structure of CDB loans, there are some obvious differences between the above two database and CDB. Hence, the statistics of Dealogic and China-Latin America Finance Database about the loan deals of CDB is incomplete. :618 6815 6:815 6&1, 8;1; 5 75 95 ;5 &5 655 675 695 6;5 6&5 H(I-%3-)T(h4 8 3). As Table 3 shows, CDB had provided loans to borrowers from forty countries (economies) over the period from 2008 to April 2015, with an aggregate worth around $233bn and a share of 60.2% in CDB’s total credit. Of which, Venezuela, Russia, Brazil, Argentina, Australia, and India are six largest debtors, whose debt amounted to $60.7bn, $29.3bn, $22.3bn, $1.98bn, $1.77bn, and $1.48bn respectively, with a share of 15.7%, 7.6%, 5.8%, 5.1%, 4.6%, and 3.8% in CDB’s overseas credits correspondingly. In recent years, CDB has extended large amount (up to $20.6 billion) of long-run (up to twenty years) energy-backed loans to foreign energy companies and government entities of countries such as Venezuela, Brazil, Ecuador, Russia, and Turkmenistan, which have faced cash �ow problems and can’t borrow such huge and long term capitals from other �nancial institutions. The energy-backed loans generally include an agreement over the loan and the sale of oil. Chinese oil compan

10 ies buy the oil and deposit the payment
ies buy the oil and deposit the payments into the CDB account of the foreign company. CDB takes the money it is owed directly from the account. The oil is paid at the market price of the day when it is received, not at a pre-established price. The agreement normally requires the borrower to buy Chinese equipment for infrastructure development (Downs, 2011; Provaggi, 2013). 9 Table 3 CDB’s Borrowers Ranking by Nationality/Economy from 2008 to April 2015 Source: Dealogic, China-Latin America Finance Database, and Author’s Collection. The government of Venezuela is CDB’s largest foreign borrower. CDB has extended cumulative credit lines of around $60bn to Venezuela’s Ministry of Finance, Bank for Economic and Social Development (BANDES), and national oil company-Petroleos de Venezuela SA (PDVSA). The governments of China and Venezuela established the China-Venezuela Joint Investment Fund (JIF), administered by BANDES, to �nance the infrastructure and social projects in Venezuela. CDB contributed two thirds of the fund to JIF, and Venezuelan �nancial institutions provided the remaining one-third. Projects �nanced by the JIF include the satellite Simón Bolívar, �ve metro lines (two in Caracas and one each in Los Teques, Valencia and Maracaibo), the train from Cúa to Encrucijada, the Gran Mariscal de Ayacucho highway, and others in agriculture, people’s livelihood, basic industries, petroleum, and river conservation (Downs,2011; Research Academy of China Development Bank, 2012). It is worthy of noting that CDB’s oil-backed loans to Venezuela has faced tremendous default risk, due to the collapse of oil price and subsequent Venezuelan economic crisis, and social and political instability. Rank Deal Nationality(Economy) Deal Value Deal No. Rank Deal Nationality(Economy) Deal Value Deal No. $mn Share (%) $mn Share (%) 1 China 154065 39.78 161 21 Philippines 610 0.16 2 2 Venezuela15.67 15 22 Papua New Guinea 0.15 1 3 Russia 29330 7.57 4 23 Bolivia 551 0.14 2 4 Brazil 22296 5.76 8 24 UK 550 0.14 1 5 Argentina 19817 5

11 .12 7 25 Zambia 550 0.14 1 6 Aust
.12 7 25 Zambia 550 0.14 1 6 Australia 17722 4.58 10 26 South Korea 511 0.13 1 7 India 14809 3.82 14 27 Germany 500 0.13 1 8 Hong Kong 8734 2.25 6 28 Jamaica 495 0.13 2 9 Uzbekistan 8150 2.10 2 29 Egypt 480 0.12 1 10 Peru1.80 2 30 Bosnia & Herzegovina 0.11 1 11 Ecuador 6500 1.68 4 31 Greece 306 0.08 5 12 Indonesia 5879 1.52 11 32 Chile 300 0.08 2 13 Vietnam 5581 1.44 10 33 Turkey 300 0.08 1 14 Pakistan 5220 1.35 4 34 Puerto Rico 225 0.06 1 15 Singapore 5161 1.33 7 35 Taiwan 172 0.04 1 16 South Africa 3751 0.97 3 36 Malaysia 145 0.04 1 17 Kazakhstan 2400 0.62 2 37 Italy 127 0.03 1 18 Norway 1400 0.36 1 38 Canada 100 0.03 1 19 Ghana 1000 0.26 1 39 Peru 50 0.01 1 20 Saudi Arabia 800 0.21 1 40 Serbia 42 0.01 1 10 2.3 M&A Activities CDB’s meager and acquisition transactions had mainly been conducted by its subsidies such as China Development Bank Capital and China Africa Fund. Its equity investment didn’t focus on infrastructure sector and covered many industries including mining, oil and gas, �nance, manufactures, infrastructure, construction, real estate, chemicals, computers, and electronics. The sectors of CDB’s M&A activities in infrastructure involved oil and gas re�nery, port terminal, transportation-ship, solar power, and other infrastructure. Over the period from 1998 to April 2015, CDB had conducted 42 M&A deals, with a total worth of $18.2bn. Among them, there are six infrastructure M&A deals and two sustainable infrastructure M&A transactions, whose share in the number of the total M&A deals is 14.3% and 4.8% respectively. The value of CDB’s M&A transactions for infrastructure and sustainable infrastructure over the period is $4.10bn and $250mn respectively, and whose share in the aggregate M&A deals is 22.6% and 1.4% correspondingly (see Table A-2). 2.4 Debt Issuance Supported with sovereign credit and good market performance, CDB can primarily raises its own capital through issuing long-term (sometimes up to 50 years) and lower interest bonds to various ins

12 titutional investors, including commerci
titutional investors, including commercial banks, credit cooperatives, insurance companies, funds, wealth management plans of commercial banks, securities companies and overseas organizations, on China’s interbank bond market and foreign markets. This alleviates CDB’s reliance on short-term bank deposits, in contrast with China’s commercial banks. Figure 2 The Volume of Debt Issued by China Development Bank Source: CDB. EcT3 H224c)5Icd36 11 Since the establishment, the volume of CDB’s annual debt issuance had shown a generally strong growth momentum, rising substantially from RMB 75.4bn ($8.75bn) in 1994 to RMB 1175bn ($191.4bn) in 2014, with an average annual growth rate of 17.1%, and whose share in China’s GDP slightly increased from 1.55% in 1994 to 1.83% in 2014. As of the end of 2014, CDB’s aggregate debt issuance reached RMB 10.7tn ($1.73tn), and equaled to 16.7% of China’s GDP in 2014, with an annual average growth rate of 29.5% during the past two decades (see Figure 2). Figure 3 The Onshore Market Share of CDB’s RMB Debts in 2014 Source: CDB. As displayed by Figure 3, in China’s onshore RMB bond market, CDB is the second largest bond issuer just next to Chinese national and local governments. In 2014, the share of CDB’s RMB debts in China’s RMB bond market amounted to 17.7%, and that of treasuries and monies, medium-term notes, and corporate bond was 28.9%, 9.2%, and 8.2% respectively. The market share of RMB bonds issued by the two other policy banks in China, Agricultural Development Bank of China and Exim Bank of China, was 5.9% and 4.4% respectively in 2014, and which was substantially lower than that of CDB. In terms of issuing asset backed securities 4 , CDB is a leading bank in China. In the three preceding quarters of 2015, CDB has issued asset backed securities �ve times, with value around RMB 40bn ($6.4bn). As of the end of September 2015, CDB had issued an aggregate of RMB 166.4bn ($26.1bn) worth of asset backed securities, and it was ranked top among Chinese banks, by bond issue times and size, and bond variety coverage. 4 Securitizati

13 on involves the transfer of a pool of il
on involves the transfer of a pool of illiquid assets to a Special Purpose Vehicle (SPV) that issues tiers of the repackaged instruments as tradable securities directly linked to the performance of the purchased assets. In the case of infrastruc - asset. This methodology is primarily intended to redistribute credit risk from the original lender to a wide spectrum of investors )8-c9;81-9 c5, $;519 EH 65,9 E68768c:- 65,9 (068:1:-84 E644-8d1c3 Tc7-8 c52 65,9. E644-8d1c3 c529 c52 6. E015c c52 65,9. I,14 c52 6. E015c &:0-89 12 CDB is a critically important issuer of foreign currency bonds in domestic and international bond market. In China’s onshore bond market, CDB is the largest issuer of foreign currency bonds. As of the end of July 2015, the total amount of foreign currency bonds that CDB had issued reached around US$ 11.7bn, accounting for 81% of the total market volume. With worldwide recognized quasi-sovereign debt status, good operating performance and extensive bond-issuing experience, CDB also has a strong record of successful bond issuance in international bond markets, such as, �rst JPY Samurai bond in 1996, �rst Yankee bond in 1997, global USD bond in 2004, and euro bond in 2005. It is worthy of noting that the bank contributed signi�cantly to RMB internationalization through issuing “dim sum bonds” in Hong Kong capital market. As of the end of July 2015, CDB had issued an aggregate of RMB 28bn ($4.5bn) worth of offshore RMB bonds, with maturities ranging from 2 to 20 years, and the outstanding bonds reached around RMB 14.1bn ($2.3bn), making it the largest issuer of RMB bonds in Hong Kong market in terms of issue size, outstanding balance and variety (CDB, 2015). 2.5 Crowd-in Effect In �lling the gap between demand and supply of infrastructure, development banks can play a unique “crowd-in” role as �nancial catalysts, attracting private domestic and abroad capital into large, long-term infrastructure projects in countries and sectors where signi�cant development results are likely, but the market perceives high ris

14 ks, through offering project selection a
ks, through offering project selection and design, below-market interest rates, long-term repayment schedule, risk mitigation (political or partial risk insurance and loan guarantee), technical assistance, and other tools for capacity building that promote the transparent use of resources, accountability, cost-effective delivery and long-run project sustainability (Williams, 2014). CDB has played a critical “crowd-in” role of drawing capitals from commercial banks, �nancial institutions and private investors, through planning in advance, selecting projects with local governments, proving long-term capital, mitigating credit risks, helping to create investment and �nancing vehicles, and enhancing borrowers’ governance structure and accounting system. CDB has actively cooperated, home and abroad commercial banks and �nancial institutions to provide syndicated loans to infrastructure sectors, such as China Construction Bank, Industrial & Commercial Bank of China, Agricultural Bank of China, Bank of China, Bank of America Merrill Lynch, Barclays, BNP Paribas SA, Citigroup, and so on. 13 Table 4 Lenders Structure of CDB’s Largest 26 Loans Loan Number Loan Value ($bn) CDB Syndicated CDB Syndicated Total Domestic Lenders Foreign Lenders Total Domestic Lenders Foreign Lenders Non-infrastructure 8 2 2 0 64.5 9.1 9.1 0 Partial infrastructure 6 1 1 0 26.0 3.2 3.2 0 Infrastructure 9 14 10 4 70.5 60.5 45.6 14.9 Total 23 17 13 4 161.0 72.8 58.0 14.9 Source: Dealogic, China-Latin America Finance Database, and Author’s Calculation. As displayed by Table A-1 and Table 4, among the largest 40 loans that CDB has participated to lend, there are 23 CDB’s sole loans and 17 syndicated loans, with a share of 57.5% and 42.5% respectively. The value of CDB’s sole loans amounts to $161.0bn, while that of its syndicated loans is $72.8bn, equaling to 42.5% of the former. In addition to cooperate with domestic commercial banks, CDB also chooses to work with foreign peers to provide infrastructure �nance. The number and worth of CDB �nanced syndicated loans with foreign

15 banks reaches 4, and $14.9bn respectiv
banks reaches 4, and $14.9bn respectively, with a share in the total syndicated loans of 30.8% and 20.5% correspondingly. Of the 14 syndicated loans to infrastructure sectors, CDB has occupied the status of sponsoring bank in 8 syndicated deals, with a share of 57.1% (see Table A-1). This re�ects that CDB has produced signi�cant crowd-in effect on infrastructure �nance through attracting some domestic and foreign 3. Infrastructure Finance 3.1 Industry Structure In compliance with the mission, CDB’s loans are mainly lent to the following sectors: 1) infrastructure, such as hydropower, rail transit, railway, subway, tugboat, coal export terminal, aviation and telecommunication; 2) energy and power, include oil & gas, LNG, gas pipeline, petroleum re�ning, offshore platform, offshore drilling, solar power, thermal power, nuclear power, hydropower, and electricity; 3) resources, for example, coal, metal, and mineral; 4) key and pillar industries, such as machinery, iron & steel, agriculture, �nance, commodity trading, construction, and real estate; 5) key emerging sectors like microelectronics, consumer electronics, semiconductor, electric motor, and �berglass (see Table 5). 14 Table 5 Industries of China Development Bank’s Loans Industries 2009 Coal, Semiconductor, Telecommunication, Fiberglass, 2010 Telecommunication, Paper, Electric Motor, Expressway, Microelectronics, Electricity, Finance, Metal, LNG, Semiconductor, Oil, Consumer Electronics, Nuclear Power, Rail Transit, Infrastructure, Iron & Steel 2011 Coal Export Terminal, Finance, Telecommunication, Oil & Gas, Subway, Energy, Infrastructure, SWF, Agriculture, Bank, Finance, Metal, Real estate, Solar Power, Forest Plantation, Paper, Semiconductor, Coal 2012 Oil & Gas, Gas Infrastructure, Gas-Chemical Complex, Electricity, Finance, Electronics, Cotton, Machinery, Iron & Steel, Food, Power, Energy, Tourism, Rail Transit, Railway, Expressway, Commodity Trading, Resources, Construction, Infrastructure, telecommunication , Real estate, Key and Pillar Industries 2013 Oil & Gas, Gas Pipeline, Petro

16 leum Re�ning, Railway, Metro,
leum Re�ning, Railway, Metro, Media, Agriculture, Expressway, Offshore Platform, Offshore Drilling, Real Estate, Sports, Paper, Aviation Lease, Electricity, Tire, Construction, Tugboat, Electrical Equipment, Infrastructure, Resources, Commodity Trading, Investment Firm 2014 Mineral, Hydropower, Expressway, Crude Palm Oil, Thermal Power, Finance, Infrastructure, Real Estate, Engineering, Aviation, Electricity April 2015 Infrastructure, Nuclear Power, Hydropower, Rail Transit, Railway, Electricity, Energy, Finance, Consumer Products, Iron and steel, Finance, Real Estate, Key and Pillar Industries Source: Dealogic. Infrastructure projects are the �rst priority areas of CDB �nance and have received most of the lending from the bank. As the end of 2014, the share of CDB’s outstanding loan allocated into infrastructure sectors reached around 53.3%-55.3%. As seen in Figure 4, the infrastructure sectors include electric power, public highways, railway, and public infrastructure, whose share in CDB’s outstanding loan at the end of 2014 was 10.1%, 18.1%, 8.1%, and 17.0% respectively. Considering into that the volume of agriculture loans is generally much smaller than that of hydropower credits, it is highly possible that the share of hydropower loans exceeds half of the outstanding loans received by the sector of hydropower, agriculture and related industries. Hence, we can conveniently suppose the share of CDB’s loans reached around 2% as the end of 2014. According to the data released by CDB in the 2014 Sustainability Report, the bank has always played a leading role in China’s infrastructure �nance. CDB’s credit lines are mainly allocated into sectors of transportation, power and energy, and urbanization infrastructure. The transportation 15 sectors mainly include construction projects of road, expressway, railway, city rail transit, and airport, while the power and energy sectors include generation projects of Power plants and stations, hydropower, wind and solar power, and renewable energy power. Figure 4 The Industry Breakdown of CDB’s Outstanding Loan as the

17 end of 2014 Source: CDB(2015). Note: The
end of 2014 Source: CDB(2015). Note: The industry breakdown of the �gure is CDB’s own criterion and de�nition of industries. It is possible that there existed some differences in the de�nition of industry between CDB and us. Due to the unclear de�nition of CDB, As the end of 2014, CDB had lent cumulative loans of RMB 1.88tn ($303bn) to road construction projects, and which equaled to 2.93% of China’s GDP in 2014, of which expressway accounted for 72%, and the worth ranks �rst in china’s banking industry and reaches a share of 38% of the total road loan. CDB also had provided cumulative loan of RMB 824.8bn ($133bn) to railway construction projects, and supported 200 city rail transit projects and 87 airports construction projects. CDB had offered cumulative loan of RMB 1.97tn ($318bn) to power plants and stations construction projects, and which equaled to 3.07% of China’s GDP in 2014, with a share of 22 percent of the total investment in China’s power industry. In rivers of Jinsha, Yangtze, Lancang and Yalong, CDB had supplied cumulative loan of RMB 461.1bn ($74.4bn) to hydropower generation projects as the end of 2014, with a share of 30% of the total investment in the area. E1,c860c %4:,6 %9)10c H0.h:(;7 %478(1 & T,1,c422903c(80437 %9)10c I3-6(7869c896, H;d6454:,6, 3.60c91896, & 6,1(8,d I3d97860,7 4(1 $8h,67 16 Table 6 CDB’s Infrastructure Loans as the end of 2014 Infrastructure Loan Value Remark Road Cumulative loan RMB 1.88tn ($303bn) 38% of the total issued by China’s banking industry 1994-2013, the length of roads is 1.46mn km, 30% of the total built roads, of which expressway projects accounted for 72% Railway Cumulative loan RMB 824.8bn ($133bn) Total length is 60,000km, 60% of the total railway in operation City Rail Transit Supporting 31 cities in building nearly 200 city rail transit projects, with a total length of nearly 4,000 km Airports Supporting 87 airports construction at home and abroad, including 86 domestic ones or 45% of the total in China Power Plants and Stations Cumulative loan RMB 1.97tn ($318bn) 22% o

18 f the total investment in China’s p
f the total investment in China’s power industry Hydropower Cumulative loan RMB 461.1bn ($74.4bn) In rivers of Jinsha, Yangtze, Lancang and Yalong, 30% of the total investment in the area Wind and Solar Power Balance loan RMB 186.5bn ($30.1bn) Aggregate installation capacity reaches 39mn kw, which can save 22.4mn tons of standard coal and reduce CO2 emission by 58.7mn tons a year Wind power generating capacity reaches 31.42mn kw, 33% the total in China during 2012-2014 Photovoltaic generating capacity reaches 6.9mn kw, 30% of the total from 2012 to 2014 Renewable Energy Power Cumulative loan RMB 206.5bn ($33.3bn) Combined installation capacity of CDB-�nanced renewable energy power generation projects reaches 33mn kw Water Conservancy Cumulative loan RMB 406bn ($65.5bn) 2,515 projects, over 40% provided by all banks in China Urbanization Infrastructure Balance loan RMB 1.79tn ($289bn) Balance of loans to infrastructure projects calculated in CDB’s urbanization loan Source: CDB. 17 CDB also places high emphasis on clean energy and renewable energy �nance. As the end of 2014, CDB had provided balance loan of RMB 186.5bn ($30.1bn) to wind and solar power projects, which has brought about signi�cantly positive effects on saving coal and reducing CO2 emission. It has also given a cumulative loan of RMB 206.5bn ($33.3bn) to renewable energy power projects. It is important to note that CDB had also lent the balance loan of RMB 1.79tn ($289bn) to urbanization infrastructure, equaling to 2.79% of China’s GDP in 2014, with a share of 23.6% of the bank’s total loans as of the end of 2014 (see Table 6). According to an incomplete statistics of Dealogic Database and China-Latin America Finance Database listed in Table 7, CDB’s domestic and oversea loans cover infrastructure, energy, resources, key and pillar industries, and key emerging industries. In terms of deal number, the project developers from electricity (coal power, hydropower, and solar power), transportations (expressway, railway, Metro, rail transit, and aviation), petroleum and gas, resources, telecommuincati

19 on, and �nance industry are
on, and �nance industry are relatively frequent traders with CDB, and which had conducted 48, 41, 27, 13, 8 and 8 deals with CDB respectively, with a share of 19.8%, 16.8%, 11.2%, 5.3%, 3.3%, and 3.3% correspondingly during the period from 2008 to April 2015. 18 Table 7 Industry Structure of China Development Bank’s Loans From 2009 to April 2015 TableIndustry Structure of China Development Bank’s Loans From 200to April 2015 IndustryDeal Value ($Deal NumberOverseasDeal Value ($OverseasDeal Number Share in TotalShare in TotalShare in IndustryShare in Industry Coal Export Terminal 8.6 2.6% 2 0.8% 8.6 100% 2 100% Gas(LNG)10.4 3.1% 5 2.1% 9.8 94.2% 4 80.0% Petroleum89.727.2%9.1%85.995.8%90.9% Electricity(Power)5.71.7%8.2%4.272.7%35.0% Hydropower25.9 7.9% 6 2.5% 8.9 34.2% 4 66.7% Coal Power17.35.3%9.1%17.3 Other Energy and Power11.73.5%3.7%1.714.3%33.3% Expressway 12.1 3.7% 13 5.3% 0.5 3.9% 1 7.7% Metro8.7 2.6% 6 2.5% 1.4 16.6% 1 16.7% Rail Transit7.92.4%2.1%0.0 Railway 23.07.0%5.3%12.453.8%23.1% Aviation 0.9 0.3% 4 1.6% 0.6 64.0% 3 75.0% Telecommunication3.41.0%3.3%1.956.7%75.0% Other Infrastructure12.2 3.7% 13 5.3% 7.8 63.7% 7 53.8% Partial Infrastructure37.511.4%5.8%27.372.9%71.4% Semiconductor 3.2 1.0% 4 1.6% 1.1 32.5% 2 50.0% Resources 6.1 1.9% 13 5.3% 3.9 63.4% 6 46.2% Finance 8.32.5%3.3%5.566.4%50.0% Iron & steel3.3 1.0% 4 1.6% 0.0 0% 0 0% Other34.610.5%21.4%0.30.9%6.1% Total330.5 100% 243 100% 199.0 60.2% 108 44.4% Source: DealogicChinaLatin America Finance Database,and Author’s Calculation. 19 Source: Dealogic and Author’s Calculation. Note: (1) Partial infrastructure means that a CDB’s loan has multiple uses, such as infrastructure, key and pillar industries, construction, and real estate. CDB has provided large amount of loans to some national and local governments’ �nancing and investment vehicles in China, such as State Development & Investment Corp(SDIC), Xinjiang State- Owned Assets Management & Investment Co Ltd, Nanjing State-owned Assets Investment Management Holdings (Group) Co Ltd, Guangxi Beibu Gulf Investment Group Co Ltd, and Yunnan Urban Co

20 nstruction Investment Co Ltd. The busin
nstruction Investment Co Ltd. The business �elds of these �nancing vehicles are mainly transportations, energy and resources, high technologies, real estates, construction, �nance, education and sanitation. It is highly possible that more than half of these vehicles’ assets are allocated into infrastructure sectors, and hence CDB’s loans to them are mainly invested into infrastructures. So we regard CDB’s loans to the �nancing vehicles as partial infrastructure. (2) Other infrastructures mainly include transportation infrastructures design and construction, power construction, port development and operation, logistics, transportation, tugboat, and telecommunications. And some �rms operate in several infrastructure industries, and it is impossible to classify their businesses into certain single sector. (3) It is worthy of noting that the percentages in Figure 4 are inconsistent with the numbers in this table 7. The differences are as follows: First, the former are from CDB, while the latter come from Dealogic; Second, the former are outstanding loans, while the later are aggregate values of loans during the period from 2008 to April 2015; Third, the former is complete, while the latter is incomplete due to dif�culties in searching data of loans; Fourth, there are differences in de�nition of industry and infrastructure between CDB and us. In terms of loan magnitude, petroleum and gas, transportations, and electricity are the three sectors that had received largest amount of CDB’s credit lines from 2008 to April 2015, with an aggregate worth of $100.1bn, $52.6bn, and $48.9bn respectively, and whose share in CDB’s total credit is 30.3%, 16.0%, and 14.9%. CDB also had extended relatively large amount of credits to sectors of �nance, resources, iron and steel, and semiconductor, whose total volume of loans was $8.3bn, $6.1bn,$3.3bn, and $3.2bn respectively, with a share of 2.5%, 1.9%, 1.0%, and 1.0% correspondingly. During the period between 2008 and April 2015, CDB had lent to 108 overseas projects, with a total worth of $1

21 99.0bn, and whose share in its total dea
99.0bn, and whose share in its total deal number and value was 44.4% and 60.2% respectively. This means that there existed around 60% of CDB’s credit had been allocated into overseas market, and hence it is highly possible that CDB is the highest internationalized bank in China mainland. 20 Table 8 CDB’s Loans to Infrastructure and Non-infrastructure from 2008 to April 2015 Source: Dealogic, China-Latin America Finance Database, and Author’s Calculation. Note: Comparing to coal power generation, hydropower generation can effectively reduces CO2 emission, and hence which can be generally regarded as sustainable infrastructure; “N-Hydro” denotes that hydropower is not calculated into the category of sustainable infrastructure; the Value/GDP is calculated by China’s GDP in 2014. CDB has aggressively offered overseas credit lines to sectors of petroleum, coal power generation, railway, gas, hydropower, coal export terminal, �nance, and resources since 2008, with a value of $85.9bn,$17.3bn,$12.4bn, $9.8bn,$8.9bn, $8.6bn, $5.5bn, and $3.9bn respectively, and the share in total loans of whose industry had received from CDB was 95.8%, 100%, 53.8%, 94.2%, 100%, 21.7%, 66.4%, and 63.4% correspondingly. This re�ects that CDB has played a As seen in Table 8, CDB had extended a total of 243 loan deals to domestic and abroad enterprises from 2008 to April 2015, of which there are 139 infrastructure deals, 14 partial infrastructure deals and 90 non-infrastructure deals, with a share of 57.2%, 5.8%, and 37.0% respectively. Among CDB’s infrastructure loan deals, there are 76 sustainable infrastructure deals and 6 hydropower stations loans, whose share in total infrastructure deals is 54.7% and 4.3% respectively. If we regard hydropower station as sustainable infrastructure, CDB’s aggregate sustainable infrastructure deals amounts to 82, with a share of 59.0% in infrastructure projects. Over the period from 2008 to April 2015, CDB had supplied aggregate worth of $330.6bn of loans to Chinese and foreign enterprises, and of which there are $190.5bn, $41.1bn, and $99.0bn worth of c

22 redits had been allocated into infrastru
redits had been allocated into infrastructure, partial infrastructure, and non- infrastructure sectors, with a share in the total loan of 57.6, 12.4%, and 29.9% respectively, and which equals to 1.84%, 0.38%, and 0.98% of China’s GDP in 2014 correspondingly. CDB had lent $83.8bn, $25.9bn, and $80.8bn worth of loans to sustainable infrastructure projects, Deal Number Deal Value ( Total Infrastructure Total Infrastructure Partial Total Partial Total Sustainable Sustainable Hydro Hydro 2008 5 0 4 0 0 5.3 0 5.0 0 0 2009 14 1 3 2 2 44.7 4.0 10.4 10.3 10.3 2010 36 0 21 11 11 58.6 0.0 49.7 17.8 17.8 2011 33 2 13 6 6 32.6 4.1 16.7 4.9 4.9 2012 47 4 27 15 14 30.4 6.8 16.3 7.9 7.9 2013 56 2 39 21 21 53.9 5.1 34.7 15.1 15.1 2014 24 1 17 14 12 34.4 4.7 24.1 22.2 15.0 2015 28 4 15 13 10 70.7 16.3 33.6 31.5 12.9 Total 243 14 139 82 76 330.6 41.1 190.5 109.7 83.8 Value/GDP 3.20% 0.38% 1.84% 1.06% 0.81% 21 hydropower stations, and non-sustainable infrastructure projects respectively, whose share in the total infrastructure credits is 42.4%, 13.6%, and 44.0% respectively. If we calculate hydropower stations into sustainable infrastructure projects, CDB’s credit lines to sustainable infrastructure sectors amounted to $109.7bn, with a share in the total loans and infrastructure credits reached 33.2% and 57.6% correspondingly, and which equals to 1.06% of China’s GDP in 2014 (see Table 8). This means that the sustainable infrastructure sector is a priority �eld of CDB �nance and has received nearly one third of CDB’s credits. 3.2 Sustainable Infrastructure Structure CDB’s sustainable infrastructure �nance mainly allocates into transportation, electricity power, energy(oil), and telecommunications sectors, including industries of expressway, metro and rail transit, railway, electricity power generation, thermal power, solar power, hydropower 5 , oil pipeline, and renewable energy. As shown by table 9, CDB had provided a large amount of loans to 82 sustainable infrastructure projects, with

23 a total worth of around $109.7bn from 20
a total worth of around $109.7bn from 2008 to April 2015. Of which, there are 27 overseas infrastructure projects, with an aggregate value of $42.9bn, and whose share in the number and value of the total sustainable infrastructure credit deals is 39.1% and 32.9% respectively. 5 Although hydropower stations have negative effects on environment, they can do provide clean energy and reduce CO2 emission substantially comparing to coals. It is highly possible that positive effects of hydropower on CO2 emission can overweight negative consequences on environment. Current China is suffering serious environment pollution particularly air pollution, hence reducing CO2 emission is critically important for China. Therefore, we regard hydropower stations as sustainable infrastructure projects in this section. 22 Table 9 Industry Structure of China Development Bank’s Loans to Sustainable Infrastructure From 2008 to April 2015 TableIndustry Structureof China Development Bank’s Loans to Sustainable Infrastructure From 200to April 2015 Sustainable IndustryDeal Value ($m)Deal NumberOverseasDeal Value ($m)OverseasDeal Number Share in Total Share in Total Share in Industry Share in Industry Expressway 12.111.0%15.9%0.53.9%7.7% Metro and Rail Transit16.615.2%13.4% Railway 23.0 21.0% 13 15.9% 12.4 53.8% 3 23.1% Electricity(Power)5.34.8%24.4%3.463.7%30.0% Hydropower25.923.6%7.3%8.934.2%66.7% Nuclear Power7.77.0%2.4% Solar Power2.22.0%3.7%2.297.6%66.7% Energy (Oil)10.29.3%2.4%10.2 Telecommunications 5.3 4.9% 9 11.0% 4.9 92.3% 7 77.8% Others 1.31.2%3.7%0.539.7%66.7% Total109.742.939.1%32.9% Source: DealogicChinaLatin America Finance Database,and Author’s Calculation.Note: Other sustainable infrastructure industries mainly include transportation infrastructures design and construction, port development and operation, logistics, transportation and telecommunications. Some firms operate in several infrastructure industries, and it is impossible to classify their businesses into certain singlesector. 23 Source: Dealogic, China-Latin America Finance Database, and Author’s Calculation. Note: Other sustainable infrastructure industrie

24 s mainly include transportation infrastr
s mainly include transportation infrastructures design and construction, port development and operation, logistics, transportation and telecommunications. Some �rms operate in several infrastructure industries, and it is impossible to classify their businesses into certain single sector. Hydropower generation station is the sector that had received largest amount of credit from CDB, with a total worth of $25.9bn, and whose share in the aggregate volume and sustainable infrastructure credit amounted to 7.8% and 23.6% respectively. Railway, metro and rail transit, expressway, energy(oil), nuclear power, telecommunications, and electricity power sectors are relatively large receivers of CDB’s credit lines, with a total value of $23.0bn, $16.6bn, $12.1bn, $10.2bn, $7.7bn, $5.3bn, and $5.3bn, whose share in the aggregate sustainable infrastructure �nance is 21.0%, 15.2%, 11.0%, 9.3%, 4.9% and 4.8% respectively. In terms of deal number, the investors and developers of electricity, expressway, railway, metro and rail transit, telecommunication, and hydropower are relatively frequent credit borrowers of CDB fund, which had borrowed from CDB for 20, 13, 13, 11, 9, and 6 times respectively over the period from 2008 to April 2015, and whose share in the total deal number amounted to 24.4%, 15.9%, 15.9%, 13.4%, 11.0%, and 7.3% correspondingly. The priority �elds of CDB’s overseas sustainable infrastructure �nance are sectors of railway, energy, hydropower, telecommuincations, and electricity, whose total deal worth amounted to $12.4bn, $10.2bn, $8.9bn, $4.9bn, and $3.4bn during the period, and the share in whose industry was 53.8%, 100%, 34.2%, 92.3%, and 63.7% respectively. The deal number of the above �ve sectors was 3, 2, 4, 7, and 6, and the share in whose industry reached 23.1%, 100%, 66.7%, 77.8%, and 30.0% correspondingly. 4. Case Studies 4.1 Wuhu Model Wuhu is a municipal city located in Anhui Province in East China, which has an average economic development. Ever since the Wuhu Model was established in 1998, the city has changed from a sleepy city in 1990s to a bu

25 stling metropolis today. It is also home
stling metropolis today. It is also home to one of China’s most prominent carmakers, Chery Automobile Co. (Sanderson and Forsythe, 2013). According to comprehensiveness of urban construction such as Including land development and consolidation, road and subway construction, sewage disposal, and industry attraction, CDB created a new facility- bundled loans to Wuhu Municipal Government, with an intention to obtain average reward from total infrastructure projects combining pro�table with non-pro�table ones. On providing �nance for urbanization of Wuhu government, CDB had created a new mode of 24 infrastructure loans. First, CDB cooperated with Wu government and established the �rst local government �nance vehicle (LGFV) in China, the Wuhu Construction Investment Co., to mobilize land sales and bank loans to fund infrastructure investments. Second, to support the construction of six infrastructure projects, CDB provided ten-year bundled loans with a total worth of RMB 1.08bn ($130.4mn) to the Wuhu Construction Investment Co., acting as the borrower and obligator of the loan (Yang, 2013). Finally, Wuhu government established repayment reserve fund and promised to use its future �scal revenue to pay back the loan after ten years if the �nance platform couldn’t sell the land. Figure 5 Wuhu Model Operation Method Source: Sanderson and Forsythe (2013). In 1990s, Chinese local governments extremely lack fund to develop infrastructure in the urban areas, and the investment rewards of infrastructure projects were so low that it is hard for CDB to As Figure 5 shows, the LGFV, Wuhu Construction Investment Co., had played a central role in the Wuhu model, acting as a land bank with functions of land reserve and transfer, borrowing loans from CDB secured by land transfer revenue, carrying out infrastructure construction with borrowed fund, and paying back loans to CDB. In this sense, the Wuhu model can be regarded as a land-backed model. The Wuhu had created a virtuous cycle in infrastructure construction and urbanization. More public infrastructures in

26 vestment like roads and subways would bo
vestment like roads and subways would boost home prices, which in turn would boost land prices. Higher land prices would mean more local government income, and hence more infrastructure investment and public goods spending(Sanderson and Forsythe, 2013). This effectively accelerates Wuhu’s infrastructure construction, urbanization and economic development. From then on, the Wuhu Model was extensively replicated across the country, with 25 CDB lending money to LGFVs in Shanghai, Tianjin, Chongqing, as well as the canal city of Suzhou. CDB’s successful experience in the �eld of �nancing for urban infrastructure construction has produced substantial demonstration effects. Almost all of Chinese banks, such as the “big four” banks - Industrial & Commercial Bank of China, China Construction Bank, Bank of China, and Agricultural Bank of China, the other national banks, and the local “city” banks, choose to follow CDB and make their loans to infrastructure sectors. The 2008 global �nancial crisis and subsequent China’s RMB 4tn ($575bn) stimulus plan had greatly pushed forward the application of the Wuhu model in China nationwide, equaling to 12.6% of China’s GDP in 2008, and loans of LGFVs constituted important assets for all Chinese commercial banks. Every province, city and even county in China has now set up similar LGFVs to �nance infrastructure investments. The Wuhu model now even has been expanded to many developing countries, from Africa to Latin America, due to CDB’s recently aggressive expansion in developing world. However, the main problem of LGFVs is insuf�cient transparency. Under conditions that aggressive expansion of LGFVs, a large amount of unhealthy assets have been incorporated into LGFVs by Chinese local governments. The European sovereign debt crisis and rapidly rising debt remind China of the risk of local government debt crisis. Now, Chinese government has taken measures to strengthen supervision on LGFVs and constrain its development speed. 4.2 Tianjin Model Tianjin model is an updated and advanced version of Wuhu

27 Model. In April 2003, CDB signed the b
Model. In April 2003, CDB signed the biggest loan agreement in China at the time with the land bank of Tianjin, Tianjin Center for Land Reserve and Consolidation, a loan of RMB 50bn ($6.0bn), part of which was later handed over to the �nancing vehicle, Tianjin City Infrastructure Construction and Investment Company Ltd, established in November 2004 under the guide of CDB. According to the agreement, the loan was divided into a RMB 24bn ($2.9bn) soft loan and RMB 26bn ($3.1bn) hard loan, with a total maturity of 15 years including 5 years of construction period. In the �rst �ve years, Tianjin only had to pay back interest on the loan to CDB; in the last ten years, the city should pay back principle and interest on the loan. The interest rate was 10 percent below the benchmark rate for the soft loan and 10 percent below the benchmark rate for 26 Table 10 Tianjin’s Infrastructure Construction and Land Reserve and Consolidation Programs Millions of Dollars Project Investment Volume CDB’s Loan Internal Finance Hard Loan Soft Loan Urban expressway 209 173 106 66 36 Hai riverside infrastructure development 237 190 129 60 47 Two subway lines 254 127 0 127 127 Greening of the City 978 91 54 36 7 Land reserve and consolidation 121 24 24 0 97 Total 918 604 314 290 314 Source: CDB. The original loan contract was to provide credit to four infrastructure projects including urban expressway, two subway lines, greening of the city, and Hai riverside infrastructure development, and one project for land reserve and consolidation. As Table 10 shows, the main contents of the infrastructure �nancing contracts are as follows: 1) urban expressway system includes one expressway circle, four expressway lines, and two expressway connection lines, with a total investment value of RMB 17.3bn ($209mn) and RMB 14.3bn ($173mn) borrowed from CDB; 2) Hai riverside infrastructure development includes river widening, sewage disposal, water drainage, and bridge construction, with a total investment worth of RMB 19.6bn ($237mn) and RMB 15.7bn ($190mn) coming from CDB; 3) two subway lines with a total leng

28 th of 51km and 42 stations, and aggrega
th of 51km and 42 stations, and aggregate investment worth of RMB 21bn ($254mn) and RMB 10.5bn ($127mn) borrowed from CDB; 4)City greening projects with total greening volume of 5.88 million m3, with aggregate investment worth of RMB 8.1bn ($978mn) and RMB 7.5bn ($91mn) coming from CDB(Project Team of China Development Bank and Renmin University of China, 2007). Regarding the guarantee and repayment of the debt, Tianjin government promised to use 15 years of land usage rights sales to secure the huge infrastructure loans, including 96.35km2 of central city land and 100.9 km2 of suburb land, both to act as collateral and as a source to pay back the funds. The city government also promised to use its own infrastructure fund to pay back the loans if land usage rights sales ran into dif�culties. It is obvious that land collateral had played a fundamental role in Tianjin government’s commitment of the loan repayment. In CDB’s later overseas loans in Africa, Asia, and Latin America, resources and petroleum collateral also acted as the same important role as the Tianjin model. 27 Considering into expressway, city greening, sewage disposal and subway can’t create meaningful net cash �ow for the government, hence it is an impossible task for the infrastructure �nance vehicle to repay CDB’s loans. Therefore, the money to pay back the infrastructure loans will nearly all come from the income of land usage rights sale. To assure the safety of the infrastructure loans, CDB had established a perfect supervision mechanism on the repayment of principle and interest, focus on supervising the movement and transfer of the government income from land usage rights sale. The land bank sells a land usage rights and the proceeds go straight into its account at Tianjin’s CDB branch before being transferred to the city government’s account in the same bank. After the payment to cost of land reserve and consolidation, and national treasury, CDB could thus automatically take the principle and interest it was owed and could supervise the process of funds transfer (Sanderson and Forsythe, 201

29 3). This model of supervision mechanism
3). This model of supervision mechanism has been replicated in almost all of CDB’s land or resource backed loans later, particularly the petroleum backed loans in Latin America. The infrastructure loans have produced substantial positive effects on Tianjin’s economic and social development, such as, the improvement in public infrastructures like expressway, subway and water transportation, the progress in city greening, the reform of infrastructure �nance and investment institution, and standardization of land reserve, consolidation and transfer. Partly due to the contribution of the huge infrastructure loans, Tianjin has shown a strong growth momentum and the GDP growth rate has always been signi�cantly higher than national average level. The success of Tianjin model has unleash a wave of infrastructure construction in China, from expressways, railways, ports, and hydropower stations to local metro lines, government stadiums, apartment complexes, and commercial buildings, helping China to accelerate the urbanization process with a speed never seen before in history. 5. Practices and Policies of CDB’s Sustainable Infrastructure Finance 5.1 Stages of Infrastructure Finance During the practice of infrastructure �nance, CDB has gradually formed the ideology of developing healthy enterprises, �scal positions, �nances and economy. Under the guidance of the ideology, CDB has established a systematic operation mechanism of infrastructure �nance with the following four main stages: planning in advance; project selection; project support or The �rst stage is planning in advance. Planning in advance is the starting point of CDB’s cooperation with local governments and infrastructure developers. To reduce blind investment 28 and duplicate construction, and increase the possibility of success of infrastructure �nance, CDB actively supports local governments and infrastructure developers to design social, regional, industrial, and market development plans for potential infrastructure projects, through providing technical support

30 loans and consulting services (Chen, 200
loans and consulting services (Chen, 2009, 2010; Hu, 2016). The second stage is project selection, which mainly re�ects local governments’ project recommendations or “governments’ entrance” called by CDB. Local governments’ entrance or projects recommendation means that they choose some infrastructure projects and recommend them to CDB to apply for credit support, based on national industry policies and local development strategy. After considering into factors such as local economic development level, �scal position, debt agreements implementation, and credit ratings, CDB decides the amount of credit lines extended to these recommended infrastructure projects. The third stage is project support or “development �nance incubation” denoted by CDB. Through credit enhancement measures (necessary �scal funding and policy support) from local governments and infrastructure �nance provision, CDB attempts to help infrastructure developers to improve their governance structure, legal entity, cash �ow and credit worthiness. This will help infrastructure developers to enhance their �scal positions, �nancing capabilities, and management abilities in infrastructure investment. The �nal stage is project exit or “market exit” expressed by CDB. Based on the expectation and assessment of future cash �ow of infrastructure projects, CDB designs different repayment mechanisms in terms of the nature and use of infrastructure loan, such as ordinary loan repayment, parent company repurchase, IPOs, bond issuance, and government repurchase. CDB has formed a mature operation mode, for example, it shows local governments how to enhance credit worthiness of local investment and �nancing vehicles and to adopt what kinds of policies to support the vehicles, how to assess local governments’ �scal position, debt default risk, and infrastructure investment capability (Chen, 2009, 2010). 5.2 Experience of Infrastructure Finance In the practice of infrastructure and urbanization �nance

31 in China, an important experience of C
in China, an important experience of CDB is to help Chinese local governments to create uniform investment and �nancing vehicles and establish a standardized infrastructure investment and �nancing system. China’s local governments have established state-owned asset management companies or city construction and investment companies to act as investment and �nancing vehicles one by one, which represents the government to acquire external �nance, manage government investment projects, repay government debt, and coordinate the relationship between governments and CDB (Chen, 2009, 2010). CDB’s experience shows that the investment and �nancing vehicles have played critically 29 important role in improving governments’ capabilities of debt (loan) management and reducing CDB’s credit risk in infrastructure �nance. The investment and �nancing vehicles have successfully explored new important source of funding for local governments, radically changed their extreme scarcity in external �nance, and signi�cantly stimulated the rapid development of infrastructure construction and urbanization. However, the aggressive expansion in the loan debt of the investment and �nancing vehicles has led to a substantial increase in local governments’ Combine the advantage of coordination of local governments and CDB’s advantage of �nancing. CDB’s another experience is to cooperate with local governments and combine their advantages of coordination and its advantage of �nancing. Comparing to western advanced countries, China’s market is impaired and immature, and local governments in China are deeply involved in economic activities, and they have played critically important roles in managing and regulating local economies. CDB chooses to cooperate with local governments to create infrastructure investment and �nancing vehicles, local governments recommend targeted infrastructure projects to CDB based on local economic development strategy, and CDB provides credit to the recommended inf

32 rastructure projects through the investm
rastructure projects through the investment and �nancing vehicles. This can help to lessen the problems of insuf�cient credit supply in infrastructure sector. Promote market development through infrastructure �nance. During the process of project �nancing and monitoring, CDB attempts to enhance infrastructure developers’ capabilities of self-development, self-governance, market operation, and risk prevention and control, through improving their governance structure, legal entity, cash �ow and credit worthiness, so that the developers can �nally become healthy market agents. Through CDB’s endeavour in market construction, some infrastructure sectors in China have successfully shifted from the public �elds that commercial banks have low willingness to enter into to the commercialized sectors rich in competition among private investors. Manage credit risk through society co-construction. CDB has carried out reform in the system of loans provision procedures and credit risk assessment, and established a comprehensive risk management framework, which lays a solid foundation for CDB’s good performance. Also, CDB has formed the ideology of society �nancialization and �nance socialization. CDB attempts to mobilize the powers of governments, market, enterprises, and society, and establish a strong network of risk management to reduce information asymmetry, strengthen social and uniform supervision, enhance operation transparency, and overcome the weakness of its sole supervision, such as lacking scale effect, high supervision cost, insuf�cient employee, and information asymmetry (Chen, 2009, 2010). 30 5.3 Social and Environmental Safeguards As a member of the International development �nance club (IDFC), a network of renowned national and sub-regional development banks which recently has focused on sustainable infrastructure �nance, CDB places a great emphasis on the implementation of social and environmental safeguards when provides infrastructure �nance. Among the state-owned banks

33 in China, CDB is the �rst t
in China, CDB is the �rst to join the United Nations Global Compact. The Corporate social responsibility (CSR) is an integral part of CDB’s business strategies, day-to-day operations and well ingrained in its corporate culture. CDB has obtained some awards in social and environmental safeguards for consecutive years in the past decades, such as “Responsible Business for the People” and “Socially Responsible Bank of the Year” (IDFC, 2015). Although CDB has taken some speci�c steps to ful�ll its environmental and social responsibilities, such as publishing annual sustainability report and environmental policy, improving environmental and social performance at home and abroad, and aggressively �nances renewable energy projects globally. Some views criticized that CDB’s environmental and social standards for burgeoning international lending, especially for natural resource and infrastructure projects fall short of best practice, particularly in terms of sector-speci�c standards, transaction transparency, adequate consultation of local stakeholders in decision making processes and grievance mechanisms (Friends of the Earth, 2012). Also, based on a systematic investigation of CDB’s lending practices in the Latin America during the period from 2005 to 2011, Gallagher, Irwin and Koleski (2012) claimed that CDB’s loans had less favorable terms, carried few policy conditions, and imposed less stringent environmental guidelines than those of international �nancial institutions (IFIs) and Western banks, but it often required equipment purchases and sometimes oil sale agreements. 6. Comments and Policy Suggestions Although there are some criticisms on CDB, such as aggressive investment behaviors, carrying enormous risks from domestic land-backed loans and overseas petroleum-backed loans, insuf�cient transparency, and neglecting social and environmental safeguards, it is undoubted that CDB’s infrastructure �nance has achieved great success in the past �fteen years. The following four aspects c

34 an re�ect CDB’s success in
an re�ect CDB’s success in infrastructure �nance: 1) the magnitude CDB’s loan, pro�t, and asset has experienced dramatic expansion, and its non-performing loan ratio has been kept below 1.0 percent for 35 consecutive quarters; 2) China’s infrastructure development has achieved impressive performance, shifting from a country extremely lacking of infrastructure services and �nance, to an economy with relatively suf�cient capital supply (attracting commercial banks to enter into 31 infrastructure) and strong construction abilities in infrastructure sectors; 3)China’s infrastructure investment and urbanization has realized bene�cial cycle, through creating investment and �nancial vehicles for local governments; 4) large amount of infrastructure investment has made a signi�cant contribution to China’s rapid economic growth. The most valuable experience of CDB’s infrastructure �nance is to integrate infrastructure investment to China’s rapid urbanization, and realize �nance sustainability (earn positive pro�ts) through creating some innovative �nancing facilities and mechanisms, such as local governments investment and �nance vehicles, bundling loans, and debt repayment mechanisms including land (resource, energy)-backed loans and accounts supervision of borrowers’ land (resources) sale income. Based on the above analysis, the success of CDB in infrastructure �nance can be mainly attributed to the following six factors:  First, planning in advance. Antecedent research and planning in advance can provide valuable guide on infrastructure investment, and hence can improve the ef�ciency of CDB’s infrastructure �nance and investment.  Second, highly integrating infrastructure investment to urbanization. Urbanization can stimulate demand on infrastructure and increase fee income of infrastructure, while infrastructure investment can lead to a rise in price of the land and real estate along infrastructure projects. However, an impor

35 tant precondition for the virtuous cycle
tant precondition for the virtuous cycle is that the invested area should have large potential of development.  Third, helping local governments to create investment and �nancing vehicles. The �nancing vehicles �nd new capital sources for local governments, enhance the ef�ciency and �exibility of the infrastructure loans and investment, and facilitate the smooth repayment of CDB’s land-backed loans. However, the problems of the vehicles are low transparency in assets, encouraging excessive borrowing of local governments, and heightening local public debt default risks.  Fourth, extending land, energy or resource-backed loans. Under conditions that a local or central government has low credit worthiness or low willingness to provide guarantees for an infrastructure project, land or energy and resource (petroleum & gas)-backed loans can help to assure the smooth repayment and the sustainability of CDB’s infrastructure loan.  Fifth, cooperating with local governments to stimulate market development. Local governments are generally providers and developers of sustainable infrastructure, and have policy and fund resources for the sustainable development of the invested infrastructures. Cooperating with local governments can facilitate CDB to closely follow local development plan, acquire information of potential infrastructure projects, reduce project selection cost, and obtain favorable policy treatments. 32  Sixth, helping developers to enhance the capabilities in infrastructure management. CDB’s success is fundamentally decided by the development of infrastructure developers. It is wise for CDB to enhance loan recipients and infrastructure developers’ capabilities in management of infrastructure projects, through improving their governance structure, legal entity, cash �ow and credit worthiness. It is important to note that there existed two critical preconditions for the success of CDB’s home land-backed loans and the smooth repayment of its overseas energy or resources- securitized loans. These were the boom of Chinese economy an

36 d real estate market, and the “supe
d real estate market, and the “super business cycle” of global commodity market driven by China’s strong demand. Now, the two preconditions cannot hold any longer. With the signi�cant slow-down of the economy, China’s real estate and land market has already lost the momentum of growth. Following from this the land sale incomes of local governments will decline, and hence their capability of infrastructure investment and debt repayment will also weaken. Also, the collapse of prices of petroleum and other commodities has seriously hit the economies heavily dependent on commodity exports, and it is highly possible that these governments would not be able to mobilize suf�cient funds to repay CDB’s energy-backed loan. With the end of high-speed growth era in China, and the resulting collapse of the super boom in Chinese land market and global commodity market, it is certain that CDB’s brilliant performance in the past �fteen years can’t reoccur any more. Although the implantation of “One Belt and One Road” has provided a large space for CDB to grow, and CDB has established a project reserve with dozens of potential projects in infrastructure and key industry (Hu, 2016), the region along the “One Belt and One Road” has a high investment risk (Wang and Li, 2015), and so CDB should be cautious when it copies its past experience in this region. In regards with the possibility of the duplication or generalization of CDB’s experience in infrastructure �nance, the answer is yes. Actually, Chinese government has taken some speci�c steps to generalize CDB’s experience, such as the newly established AIIB and New Development Bank, and the implementation of the initiative of “One Belt and One Road” focusing on infrastructure connection between neighbor countries. It is certain that CDB’s experiences in infrastructure �nance are valuable for the national development banks in emerging and developing countries, and multinational development banks. However, we should take cautious attitude on other development

37 banks how to learn CDB’s experience
banks how to learn CDB’s experiences. Regarding the generalization and viability of Wuhu and Tianjin Models for China in the longer run and abroad, there is no certain answer, because it depends on the system of land ownership and land market development. For China, it is sure that the potential of rise in prices of land and real estate has been quite limited in the long run, and hence CDB shouldn’t expect that the strong 33 bene�cial cycle of infrastructure investment and land price rising will occur again in the near future. However, China still has large potential to push forward its urbanization and transfer rural population to urban area, and the land is still the most valuable asset for China’s local governments, therefore, the Wuhu and Tianjin model can be duplicated in China’s infrastructure �nance in the long run. Considering that there exists large differences between China and some developing countries in the system of land ownership, it is quite dif�cult to duplicate Wuhu and Tianjin model in other emerging and developing countries. In terms of energy or resources-securitized infrastructure loans, there still exists large potential to develop, particularly for those capital recipient countries with relatively weak �scal positions, although the collapse of commodity prices has dramatically reduced the value of the collaterals. Of course, to stimulate the smooth repayment of cross-border infrastructure loan, the governments of recipient countries should provide some guarantees if needed. CDB’s other �ve important experiences, such as planning in advance, highly integrating infrastructure investment to urbanization, helping local governments to create investment and �nancing vehicles, cooperating with local governments to stimulate market development, and helping developers to enhance the capabilities in infrastructure management, are valuable for national development banks in emerging and developing countries to learn from. However, there are no universal best practices in the world. The national banks should innovatively borrow

38 from CDB’s experience in infrastructu
from CDB’s experience in infrastructure �nance based on their local conditions of economic and market development. 34 References 1. Bhattacharya Amar and Rachel Holt. “Assessing the Changing Infrastructure Needs in Emerg - ing Markets and Developing Countries”, G-24/GGGI Paper Series. 2015. 2. Chen Yuan. “Development Finance and China’s Economic and Social Development”, Eco - nomic Science, Vol. 4, 2009, pp. 5-14 (Chinese). 3. Chen Yuan. “Development Finance and Urbanization Development in China”, Economic Re - search Journal, Vol. 7, 2010, pp.4-14 (Chinese). 4. China Development Bank (CDB). Of�cial Website, http://www.cdb.com.cn/web , October 2015. 5. China Development Bank (CDB). Annual Report 2014, May 2015. 6. China Development Bank (CDB). Sustainability Report 2014, January 2016. 7. Downs Erica. “Inside China, Inc: China Development Bank’s Cross-Border Energy Deals”, John L. Thornton China Center Monograph Series, Number 3, Brookings Institution, March 2011. 8. Friends of the Earth. “China Development Bank’s Overseas Investments: An Assessment of Environmental and Social Policies and Practices”, July, 2012. 9. Hu Huaibang. “Implementing ‘One Belt and One Road’ Initiative Through Development Fi - nance”, China Banking , Vol.1, January 2016 (Chinese). 10. International Development Finance Club (IDFC). “Sustainable Infrastructure”, https://www. idfc.org/Our-Program/infrastructure.aspx , October 2015. 11. International Development Finance Club (IDFC). “Member: China Development Bank”, https://www.idfc.org/Members/cdb.aspx , December, 2015. 12. Grif�th-Jones Stephany and Matthias Kollatz. “Multilateral Lending Instruments for Infra - structure Financing”, Infrastructure Finance in the Developing World Working Paper Series, Global Green Growth Institute and Intergovernmental Group of Twenty Four (G-24), June 2015. 13. Gallagher, P. Kevin, Amos Irwin and Katherin Koleski. “The New Banks in Town: Chinese Finance in Latin America”, Inter-American Dialogue, February 2012.

39 14. Project Team of China Development Ba
14. Project Team of China Development Bank and Renmin University of China, Development 35 Finance in China: Case Studies , Beijing: Renmin University of China Press, 2007 (Chinese). 15. Provaggi Alessandro. “China Development Bank’s Financing Mechanisms: Focus on Foreign Investments”, Global Projects Center, Stanford University, May 2013. 16. Research Academy of China Development Bank. A Collection of Development Finance Cases (Volume 1) , Beijing: China Financial Publishing House, October, 2012 (Chinese). 17. Sanderson Henry and Michael Forsythe. China’s Superbank , John Wiley & Sons Singapore Pte. Ltd., Singapore, 2013 18. Song Su-hyun. “KDB-KoFC to merge by Jan. 1: FSC Lays out Speci�cs of Reform Plan for Public Financial Institutions”, Korea Joongang Daily , May 16, 2014. 19. Wang Yongzhong and Xichen Li. “Characteristics and Risks of Chinese Outward Investment in the Region along the ‘On Belt and One Road’”, in Han Bing and Yongzhong Wang eds. Quarterly Report of China’s Outward Investment: Third Quarter, 2015 , Beijing: China Social Science Press, December 2015 (Chinese). 20. Williams K. Holly. “Financing Sustainable Infrastructure (Volumes I & II)”, International De - velopment Finance Club, and Sustainable Infrastructure Working Group, October 2014. 21. Yang Naifen. “China Development Bank: Three Stage Jumps of Urbanization”, Real Estate , May 2013(Chinese). 36 AnnexTable A1:The Largest Loans by Total Worth that China Development Bankhad LenNo.Announcement DateBorrowerIndustryBorrower NationalityLenderDeal Value($m)Maturity(Years)Infrastructure Sustainable 17/04/2010BANDESInfrastructure, ExpressElectricityVenezuelaCDB($10bn and RMB70bn)Yes 17/02/RosneftOilRussiaCDB 18/03/2015Ministry of Water Resource of China HydropowerChinaCDBYesYes Russian Tektronix Inc Nova (Yamal LNG)LNGRussiaCDB 17/02/2009TransneftipelineRussiaCDBYesYes PetrobrasOilBrazilCDB Jul.2010ArgentinaInfrastructure(Train)ArgentinaCDBYesYes March,2016PetrobrasOilBrazilCDB 13/02/2015YalongRiver Hydropower Development Co LtdHydropowerChinaSyndicated,Domestic banks YesYes 19/03

40 /2015Capital Airports Holding CoAirports
/2015Capital Airports Holding CoAirportsChinaSyndicated,Domestic banks Shortterm Yes 28/07/2012China National Offshore Oil Corp CNOOC; CNOOC Energy(Oil)ChinaSyndicated,International Yes 37 Canada Holding Ltdbanks 14/07/2014MMG South America Management Co Ltd; Minera Las Bambas SACMineralPeruSyndicated*,Domestic banks Reliance PowerPower Generation (Coal)IndiaSyndicated*,Domestic banksYes 31/05/2012United Energy Group LtdEnergy(Oil, Technology)Hong KongCDBShorttermYes PetrobrasOil ExplorationBrazilCDB Nov. 2013Energy Joint Fund Tranche Infrastructure,Industries, EnergyVenezuelaCDBPartial Apr.2015Energy Joint Fund Tranche B Renewal Infrastructure, Industries, Energy Venezuela CDBPartial Jun.2015VenezuelaOil VenezuelaCDB 22/05/2015Shandong Nuclear Power Co LtdNuclear PowerChinaSyndicated*,Domestic banks YesYes 18/07/2014Ministry of Economy & Public Finance of ArgentinaHydropowerArgentinaSyndicated*,Domestic banks YesYes NovEnergy Joint Fund Tranche Infrastructure,Industries, EnergyVenezuelaCDBPartial AprEnergy Joint Fund Tranche B Infrastructure, Industries, Energy VenezuelaCDBPartial Jun.2011Energy Joint Fund Tranche Infrastructure,VenezuelaCDBPartial 38 A RenewalIndustries, Energy Aug.2012Energy Joint FundTranche B RenewalInfrastructure,Industries, EnergyVenezuelaCDBPartial Jun.2013SinovensaOilVenezuelaCDB 26/06/2013YunGui Railway Yunnan Co LtdRailwayChinaSyndicated*,Domestic banks 20 and YesYes 30/07/2012Suzhou Rail Transit Co LtdRail TransitChinaSyndicated*,Domestic banks YesYes Apr.2015Petrobras Oil ExplorationBrazilCDB 25/10/2012Guangdong ChaoHui Expressway Co LtdExpresswayChinaCDB YesYes 05/03/2013Xinjiang StateOwned Assets Management & Investment Co LtdInfrastructure,Resources,IndustriesChinaSyndicated,Domestic banksPartial 03/03/2011VTB GroupBankRussian FederationSyndicated,Domestic banks 3130 3 No No 21/10/2013Jiangxi Provincial City Construction & Development Investment Co LtdTransportation, Water, Electricity, SanitationChinaSyndicated,International banksYes 01/09/2011Wiggins Island Coal Export Terminal Pty Ltd (WICET)Coal Export TerminalAustraliaCDB 1, 3, 4,and7** Yes 09/08/2010Newcastle Coal Infrastructure Group N

41 CIGCoal Export Terminal AustraliaSyndic
CIGCoal Export Terminal AustraliaSyndicated,International 1,3,4, 5and 6**Yes 39 banks 29/06/2015Guangxi Datengxia Gorge Water Conservancy Development Co LtdHydropowerChinaSyndicated*,International banksYesYes 13/11/2014Shanghai Nanjing Intercity Railway Co LtdRailwayChinaSyndicated,Domestic banks YesYes 15/05/2014Jiangxi Expressway Investment Group Co LtdExpresswayChinaSyndicated*,Domestic banks ShorttermYesYes 17/04/2012Transport Department of XinjiangExpresswayChinaCDB YesYes 15/10/2013Guiyang Urban Rail Transit Co LtdRail TransitChinaCDBYesYes 28/12/2014Changzhou MetroMetroChinaSyndicated*,Domestic banksShorttermYesYes Source: DealogicChinaLatin America Finance Database, and Author’sCollectionNote: * China Development Bank is the largest credit contributor or a main sponsor ofthe syndicated loan.** A loan can be divided into different tranches, and each tranche has a different maturity, so there are some maturities fora loan. ***China Development Bank and Ministry of Water Resource of China signed an agreement on March 18, 2015, and the formerommitted to provide a total amount of RMB 90bn (USD 14187mn) longterm credit to several major hydropower projects in 2015, so the No.1 deal will include several deals. he deal value of a syndicated loan is the total amount that the syndicated bank grouphasprovided, not the size that China Development Bank has solely contributed.The deal value is ranked by the amount of syndicated loan not CDB’s credit. 40 Source: Dealogic, China-Latin America Finance Database, and Author’s Collection. Note: * China Development Bank is the largest credit contributor or a main sponsor of the syndicated loan. ** A loan can be divided into different tranches, and each tranche has a different maturity, so there are some maturities for a loan. ***China Development Bank and Ministry of Water Resource of China signed an agreement on March 18, 2015, and the former committed to provide a total amount of RMB 90bn (USD 14187mn) long-term credit to several major hydropower projects in 2015, so the No.1 deal will include several deals. The deal value of a syndicated loan is the total amount that the syndic

42 ated bank group has provided, not the si
ated bank group has provided, not the size that China Development Bank has solely contributed. The deal value is ranked by the amount of syndicated loan not CDB’s credit. 41 Table A2:Historical M&A Transactions of China Development Bank (China Development Bank Capital)NumberIndustryValue (millions of USD) TotalInfrastructureTotalInfrastructure SustainableSustainable FinanceInvestment Banks, ChemicalsDiversified 1999 9 0 0 Metal & Steel Processing, Chemicals Fertilizers, Auto/Truck Manufacturers, Transportation Ship, Finance, Chemicals, Computers & Electronics Oil & GasRefinery, MiningGeneral, Metal & SteelProducts Construction/Bldg Prods Engineering/R&D MiningGeneral, Finance, Construction/ Commercial Building FinanceCommercial & Savings Banks, FinanceLeasing Companies Finance, MiningGeneral, Consumer Products, ChemicalsDiversified, Port Terminals Computers & Electronics Semiconductors, Consumer Products Glass, Finance, MiningGeneral, chemicalsPlastic Computers & ElectronicsServices, TransportationShip Real Estate, Construction/Bldg ProdsInfrastructure 2014 4 2 2 Real Estate, Solar Power, Retail 378 250 250 AprilConstruction/Bldg ProdsCommercial Building Total Source: Dealogic. Global Economic Governance Initiative The Global Economic Governance Initiative (GEGI) is a research program of the Center for Finance, Law & Policy (CFLP), the Frederick S. Pardee Center for the Study of the Longer- Range Future, and the Frederick S. Pardee School of Global Studies. It was founded in 2008 to advance policy- relevant knowledge about governance for nancial stability, human development, and the environment. www.bu.edu/ gegi The views expressed in the GEGI Working Paper series are strictly those of the author(s) and do not represent the position of Boston University, or the BU Global Economic Governance Initiative. e Center for Finance, Law and Policy, e Frederick S. Pardee School of Global Studies, and e Frederick S. Pardee Center for the Study of the Longer-Range Future Boston University 154 Bay State Road Boston, MA 02215 gegi@bu.edu www.twitter.com/gegi_bu - www.bu.edu/gegi Bringing F