/
3.1 Selection as a Surface 3.1 Selection as a Surface

3.1 Selection as a Surface - PowerPoint Presentation

marina-yarberry
marina-yarberry . @marina-yarberry
Follow
378 views
Uploaded On 2015-12-02

3.1 Selection as a Surface - PPT Presentation

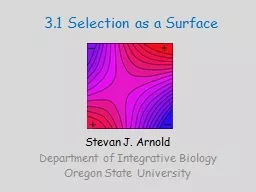
Stevan J Arnold Department of Integrative Biology Oregon State University Thesis We can think of selection as a surface Selection surfaces allow us to estimate selection parameters as well as visualize selection ID: 212566

surface selection multivariate iss selection surface iss multivariate trait approximations landscape adaptive individual examples quadratic gaussian surveys function evolution

Share:

Link:

Embed:

Download Presentation from below link

Download Presentation The PPT/PDF document "3.1 Selection as a Surface" is the property of its rightful owner. Permission is granted to download and print the materials on this web site for personal, non-commercial use only, and to display it on your personal computer provided you do not modify the materials and that you retain all copyright notices contained in the materials. By downloading content from our website, you accept the terms of this agreement.


Presentation Transcript

Slide1

3.1 Selection as a Surface

Stevan J. ArnoldDepartment of Integrative BiologyOregon State UniversitySlide2

Thesis

We can think of selection as a surface.Selection surfaces allow us to estimate selection parameters, as well as visualize selection.To visualize and estimate, we need to keep track of three kinds of surfaces:

the individual selection surface

2. our approximation of that surface

3. the adaptive landscape.

Slide3

Outline

The individual selection surface, ISS.Approximations to the ISS

.

The adaptive landscape,

AL

.

Examples and surveys.

The

multivariate ISS

.

Approximations to the multivariate ISS

.

The

multivariate AL

.

Examples and surveys.Slide4

1. The Individual Selection Surface

A model for how selection that changes trait means and variances

Expected individual fitness,

, as a function of

trait value,


Trait value, z, and mean,


p(z), p(z)*, and w(z)

Animation 0Slide5

1. The Individual Selection Surface

b. β is the weighted average of the first derivatives of the ISS

Trait value and mean

p

(z)

and

w(z)

β

Animation

1Slide6

1. The Individual Selection Surface

c

. Similarly,

γ

is the weighted average of the second

derivatives of the ISS

Animation

2Slide7

2. Approximations to the ISS

Linear & quadratric approximations:a

way to estimate

β

and

γ

linear

q

uadratic*

*

the factor of ½ makes

γ

a second derivativeSlide8

2. Approximations to the ISS

b. Cubic spline approximation, describes the surface but doesn’t estimate

β

or

γSlide9

3. The adaptive landscape, AL,

the surface on which evolves


a. A window on the AL at the position of the trait mean

Mean fitness of the population,

or

as a function

of the trait mean,

 Slide10

3. The adaptive landscape, AL,

the surface on which evolves


b

. If

w(z)

is Gaussian, the AL takes a simple form

Mean fitness of the population,

or

as a function

of the trait mean,


A normally-distributed

t

rait before selection

A Gaussian ISS with

o

ptimum

θ

and width

ω

A Gaussian AL with

o

ptimum

θ

and width

ω

+PSlide11

3. The adaptive landscape, AL,

the surface on which evolves


b

.

a

nd we can easily solve for first and

second derivatives of the AL

Mean fitness of the population,

or

as a function

of the trait mean,


First derivative,

β

Second

derivativeSlide12

3. The adaptive landscape, AL,

the surface on which evolves


b

. In the Gaussian case, the AL (

red

) has the same

o

ptimum as

w(z)

(orange

) but is flatter

Mean fitness of the population, or

as a function

of the trait mean,

 Slide13

4. Examples and Surveys

a. Estimates of ω

n

=355

n

=355

ωSlide14

4. Examples and Surveys

b. Estimates of the distance to the optimum

n

=197Slide15

4. Examples and Surveys

c. Relative position and width of the AL, inferred from the surveySlide16

5. The multivariate individual selection surface, ISS

A hypothetical bivariate example

Animation 3Slide17

5. The multivariate individual selection surface, ISS

b. Some examples of bivariate ISSs and the selection they impose

Trait 1

Trait 2

Animation 4Slide18

5. The multivariate individual selection surface, ISS

c. Consider a point on the selection surface. The slope atthat point is a vector and curvature is a matrix

First derivatives

Second derivativesSlide19

5. The multivariate individual selection surface, ISS

d. If we assume that p(z) is multivariate normal and

t

he actual ISS is quadratic, then

β

and

γ

are, respectively,

t

he average first and second derivatives of the surface. Slide20

6. Approximations to the multivariate ISS

Linear and quadratic approximations, a way to estimateβ and

γ

For simplicity, we consider the two-trait case

Linear approximation

Quadratic approximationSlide21

6. Approximations to the multivariate ISS

Linear and quadratic approximations, a way to estimateβ and

γ

What can we approximate with a quadratic surface?Slide22

6. Approximations to the multivariate ISS

Linear and quadratic approximations, a way to estimateβ and

γ

What can we approximate with a quadratic surface?Slide23

6. Approximations to the multivariate ISS

b. Cubic spline approximation, describes the surface without estimating

β

and

γSlide24

7. The multivariate adaptive landscape, AL

The slope and curvature of the AL, evaluated at the trait mean are related to β and

γ

A window on the adaptive landscapeSlide25

7. The multivariate adaptive landscape, AL

b. If the ISS is multivariate Gaussian, the AL takes a simple Gaussian form

Gaussian ISS

Gaussian ALSlide26

7. The multivariate adaptive landscape, AL

We can characterize the main axes of the ISS and AL by taking the eigenvectors of the ω

- and

ω

+P

matricesSlide27

8. Examples and surveys

Bivariate selection on escape behavior and coloration pattern in a garter snakeSlide28

8. Examples and surveys

Growth rate as a function of vertebral numbers (left)and crawling speed as a function of vertebral numbers (right) in garter snakes

+1

σ

+2

σ

-1

σ

-2

σ

0

+1

σ

+2

σ

-1

σ

-2

σ

0

BODY

TAIL

+1

σ

+2

σ

-1

σ

-2

σ

0

+1

σ

+2

σ

-1

σ

-2

σ

0

BODY

TAILSlide29

8. Examples and surveys

c. A survey of quadratic approximations to ISSs shows that saddles are commonSlide30

What have we learned?

Selection can be described with surfaces.Some approximations of selection surfaces allow us to estimate key measures of selection (β and

γ

).

Those key measures in turn tell us about the adaptive landscape.Slide31

References

Lande, R. and S. J. Arnold 1983. The measurement of selection on correlated characters. Evolution 37: 1210-1226.Lande, R. 1979. Quantitative genetic analysis of multivariate evolution, applied to brain: body size allometry. Evolution 33: 402-416.Schluter, D. 1988. Estimating the form of natural selection on a quantitative trait. Evolution 42: 849-861.

Phillips, P. C. & S. J. Arnold. 1989. Visualizing multivariate selection. Evolution 43: 1209-1222.

Blows, M. W. & R. Brooks. 2003. Measuring nonlinear selection. American Naturalist 162: 815-820.

Estes, E. & S. J. Arnold. 2007. Resolving the paradox of stasis: models with stabilizing selection explain evolutionary divergence on all timescales. American Naturalist 169: 227-244.

Schluter

, D. & D.

Nychka

. 1994. Exploring fitness surfaces. American Naturalist 143: 597-616.

Brodie, E. D. III. 1992. Correlational selection for color pattern and

antipredator behavior in the garter snake Thamnophis ordinoides. Evolution 46: 1284-1298.Arnold, S.J. 1988. Quantitative genetics and selection in natural populations: microevolution of vertebral numbers in the garter snake Thamnophis elegans. Pp. 619-636 IN: B.S. Weir, E.J. Eisen

, M.M. Goodman, and G. Namkoong (eds.), Proceedings of the Second International Conference on Quantitative Genetics. Sinauer, Sunderland, MA Arnold, S.J. and A.F. Bennett. 1988

. Behavioural variation in natural populations. V. Morphological correlates of locomotion in the garter snake Thamnophis radix

. Biological Journal of the Linnean Society 34: 175-190.Kingsolver, J. G. et al. 2001. The strength of phenotypic selection in natural populations. American Naturalist 157: 245-261.