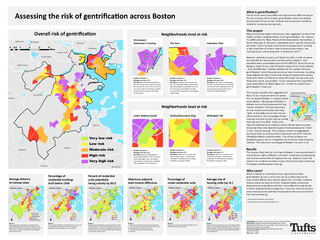
N ewtonQuincyChelseaEverettWinthropRevere Belmnt ArlingtonBraintree 012340MiMiltonCantonDedham Very low risk Low risk Moderate risk High risk Very high risk MiltonCamridgeSomrvilleWatertownBrooklineN ID: 94989
Download Pdf The PPT/PDF document "CamridgeSomrvilleWatertownBrookline" is the property of its rightful owner. Permission is granted to download and print the materials on this web site for personal, non-commercial use only, and to display it on your personal computer provided you do not modify the materials and that you retain all copyright notices contained in the materials. By downloading content from our website, you accept the terms of this agreement.
CamridgeSomrvilleWatertownBrookline N ewtonQuincyChelseaEverettWinthropRevere Belmnt ArlingtonBraintree 012340.MiMiltonCantonDedham Very low risk Low risk Moderate risk High risk Very high risk MiltonCamridgeSomrvilleWatertownBrooklineNewtonQuincyDedhamChelseaEverettWinthropRevere Belmnt ArlingtonCantonBraintree¯ 012340.Mis Not at all near Not very near Somwhat near Very near Extremly near Average distance to subway stops MiltonCamridgeSomrvilleWatertownBrooklineNewtonQuincyDedhamChelseaEverettWinthropRevere Belmnt ArlingtonCantonBraintree¯ 012340.Mis 40 40 - 50 50 - 60 60 - 70 70 Percentage of residenal buildings built before 1939 MiltonCamridgeSomrvilleWatertownBrooklineNewtonQuincyDedhamChelseaEverettWinthropRevere Belmnt ArlingtonCantonBraintree¯ 012340.Mis 1 1 - 5 5 - 10 10 - 20 20 Percent of residenal units potenally losing subsidy by 2012 MiltonCamridgeSomrvilleWatertownBrooklineNewtonQuincyDedhamChelseaEverettWinthrop RevereBelmntArlington CantonBraintree¯ 012340.Mis 0 1 2 3 Maximum adjacent tract income dierence MiltonCamridgeSomrvilleWatertownBrooklineNewtonQuincyDedhamChelseaEverettWinthrop RevereBelmntArlington CantonBraintree¯ 012340.Mis 40 40 - 50 50 - 60 60 - 70 70 Percentage of rental residenal units MiltonCamridgeSomrvilleWatertownBrooklineNewtonQuincyDedhamChelseaEverettWinthrop RevereBelmntArlington CantonBraintree¯ 012340.Mis 800 800 - 1200 1200 - 1600 1600 - 2000 2000 Average size of Weight: 3 Each point was given value based on its distance to the nearest MBTA subway stop (Green Line excluded). Points further than 3/4 mile from a subway stop were given a zero value. Tracts considered not at all near are comprised enrely of zero values. Weight: 3 This is a rough esmaon of “architectural merit”; Turner and Snow included a similar measure when they predicted gentricaon across Washington, D.C. (see sidebar). Weight: 3 Not all subsidized aordable housing is guarnteed to remain subsidized forever - Secon 8 contracts expire and are not re - newed all the me. Some Boston neighborhoods stand to be hit harder than others over the next three years by expiring uses that may not be renewed. Weight: 3 3 = Very low income tract next to very high income tract 2 = Very low income tract next to high income tract or low income tract next to very high income tract 1 = Low income tract next to high income tract 0 = All others Weight: 3 Renters are much more vulnerable to uxuaons in the marketplace than are homeowners. Weight: 1 Turner and Snow included home size in their analysis of Wash - ington D.C. (see sidebar) because large homes are oen con - sidered desirable. However, generally speaking, the larger the home, the more expensive it is - thus the diminished weight of this variable here. Chinatown/ Downtown Crossing Number of tracts: 3 Average risk score: 9.9 Key factors: Extremely accessible by several subway lines; 83.6% of residen - al units are for rent; 7.9% of its hous - ing units are at risk of losing a subsidy by 2012; borders several very high income tracts. The Fens Number of tracts: 4 Average risk score: 9.5 Key factors: Borders high (South End) and very high (Back Bay) income tracts; high percentage of residenal units are for rent; high concentraon of older housing (47%); somewhat near Ruggles subway stop. Columbus Park Number of tracts: 2 Average risk score: 8.8 Key factors: Very high concentraon of older housing; 84.2% of residenal units are for rent; somewhat near An - drews subway stop; borders high in - come tracts (South Boston). Wellington Hill Number of tracts: 2 Average risk score: 5.2 Key factors: Not near a subway; not next to many higher income tracts; proporon of homeowners at about the Boston average (31.5%). Lower Roxbury (East) Number of tracts: 1 Average risk score: 4.3 Key factors: Low concentraon of housing built before 1939 (11%); very small residenal units; not next to many higher income tracts; relavely high proporon of homeowners. Dudley/Brunswick King Number of tracts: 3 Average risk score: 5.0 Key factors: Not near a subway; not next to many higher income tracts; proporon of homeowners at about the Boston average (30.4%). Neighborhoods most at risk Neighborhoods least at risk Overall risk of gentricaon Assessing the risk of gentricaon across Boston What is gentricaon? The term can mean many dierent things to many dierent people. For the purposes of this project, gentricaon means the gradual displacement of low income residents due to economic hardships related to increasing housing costs. This project Many community leaders and scholars have suggested variables that might increase a neighborhood’s risk of gentricaon. For instance, in a 2002 arcle for Race, Poverty & the Environment , Kalima Rose, a Senior Associate at PolicyLink, highlighted some “specic community aributes” which increase vulnerability to displacement, including a high proporon of renters, ease of access to job centers, low housing values, and housing with “architectural merit”. 1 However, aempts to apply such factors to cies in order to assess the potenal for displacement are few and far between. One excepon was a presentaon given at the 2001 D.C. Policy Forum by Margery Ausn Turner and Christopher Snow of the Urban Instute - they idened ve “leading indicators for the locaon of future gentricaon” which focus exclusively on low-priced areas, including those adjacent to high-priced areas; those with good metro access; those with historic architecture; those with large housing units; and those with recent appreciaon. Turner and Snow then used GIS to apply these factors to Washington, D.C. in order to predict future gentricaon in that city. 2 This analysis considers the suggesons of Rose, Turner, Snow and others to assess the risk of gentricaon in neighborhoods across Boston. Because gentricaon is dened here as the displacement of low income residents, it focuses exclusively on low income communies (see map, right). It also adds one variable not yet referenced here: the percentage of total housing units with an expiring use subsidy that may expire by 2012 - these units have the potenal to be rented or sold at market rates very soon, displacing those who depend on government assistance to remain in their present housing. The six factors chosen are aggregated by Census tract, as a Census tract is about the size of the smallest idenable Boston neighborhoods. Five of the six factors are weighted equally; the six is weighted one-third (see maps along the boom). The maximum resulng gentricaon risk score is 16. Results This analysis nds that the risk of gentricaon is not concentrated in any parcular region of Boston, but rather remarkably spread among low income communies throughout the city. However, by far the most at-risk residents are those living in the Census tracts containing Chinatown and Downtown Crossing. Who cares? While no doubt an imperfect science, aempts to predict gentricaon at such a micro level can be a useful exercise for local elected ocials who need to assess their priories, residents anxious about the stability of their neighborhoods, community development corporaons and other nonprots who must decide in which neighborhoods to target their resources, and city planners concerned about the potenal displacement that could result from their decisionmaking. 1. hp://www.urbanhabitat.org/node/919 2. hp://www.urban.org/publicaons/900461.html Cartography: Rian Amiton, Urban & Environmental Policy & Planning Data sources: MassGIS, Boston Assessing Department, Boston Redevelopment Authority, US Census 2000, Community Economic Development Assistance Corporaon Projected coordinate system: NAD 1983 State Plane MA Date: May 6, 2009 MiltonCamridgeSomrvilleWatertownBrooklineNewtonQuincyDedhamChelseaEverettWinthropRevereBelmntArlingtonCantonBraintree¯ 012340.Mis Well above average Above average Below average Well below average Income by Census Tract