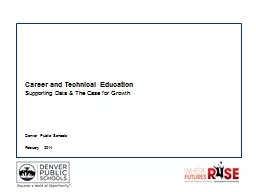
Supporting Data amp The Case for Growth February 2014 CTE Student Demographics making up 20 of DPS high school pop 2 ELL Representation SPED Representation Low Income Representation ID: 274607
Download Presentation The PPT/PDF document "Career and Technical Education" is the property of its rightful owner. Permission is granted to download and print the materials on this web site for personal, non-commercial use only, and to display it on your personal computer provided you do not modify the materials and that you retain all copyright notices contained in the materials. By downloading content from our website, you accept the terms of this agreement.
Slide1
Career and Technical EducationSupporting Data & The Case for Growth
February 2014Slide2
CTE Student Demographics (making up 20% of DPS high school pop.)
- 2 -
ELL Representation
SPED Representation
Low Income RepresentationSlide3
CTE High School Completion Rate vs. District-
3 -
CTE students completed high school at a rate significantly higher than any comparison group over the last 8 years, and
10 percentage points higher
than the district’s median extended completion rate (7 year rate) for that same period
*Note: The CTE-District rate differential of 10% is an underestimate, for two reasons:
The CTE rate is an underestimate because it does not
account for students
who transferred
About 20% of DPS completers each year include CTE participants
Incomplete Data
75% HS Completion for CTE Students
DPS Median Extended Completion Rate: 65%
N= 21,531 CTE studentsSlide4
CTE High School Completion Rate by Race & Income vs. District
- 4 -
Low income and minority students in CTE programs exhibit completion rates 3-14% higher than the district’s median extended completion rate (7-year) in all categories
Highest high school completion rate for CTE students:
black females at 80%
Low income: 14% higher completion
with CTE
Hispanic Males: 12%
higher completion
with CTE
N= 21,531 CTE studentsSlide5
High School Completion Rates by Zip Code– All DPS vs. CTE
-
5
-
80205
80207
80249
80239
80219
80223
CTE: 75%
High school completion rates in endemically off-track zip codes are significantly higher if students take just one CTE course–-
a difference of up to 21 percentage points
80204
80211
DPS: 55%
CTE: 75%
DPS: 55%
CTE: 72%
DPS: 51%
CTE: 73%
DPS: 52%
CTE: 78%
DPS: 57%
CTE: 83%
DPS: 67%
CTE: 74%
DPS: 61%
CTE: 77%
DPS: 68%
80220
CTE: 66%
DPS: 61%
Notes
This map shows 7-year high school completion rates against a 2013 off-track density
The district median completion rate for a 7-year cohort is 65% (from 2004-2012)
N= > 203,000 DPS students,>21,000
CTE students
These trends
are consistent across all DPS high schools and demographics
Ex: Low income CTE students completed 4-29% higher than peers at EVERY DPS high school
CEC
EGTCSlide6
The Power of Course Sequencing: Completion Rate ComparisonsStudents who take a sequence of 3+ CTE courses over 4 years complete high school at much higher rates than comparison groups– a 27% difference for all students, and a 30% difference for low income students
-
6
-
30% difference in HS completion for Low Income
34% difference in HS completion for ELLs
*7-year completion rates
93%
6
3%
92%
58%
79%
74%
87%
58%
66%
92%
65%
75%
Students w/ 3+ CTE courses, N= 3,660
All CTE students, N= 21,531Slide7
Attendance data suggests that students who take a sequence of 3+ CTE classes are more likely to attend school than peers, a difference of >3 school weeks for ELL students, and 2 ½ weeks for all students
The Power of Course Sequencing:
Annual Attendance Comparisons
-
7
-
No Data
A difference of 2 ½ weeks of school
A difference of more than 3 weeks of school
92%
83%
88%
86%
80%
83%
Students w/ 3+ CTE courses, N= 3,660
All CTE students, N= 21,531Slide8
Advanced Coursework
Capstone Project
Internship
Certifications
EXAMPLE: Engineering and Energy Pathway
-
8
-
PLTW: Specialized Engineering Fields
Modeling and Analysis for Natural Resources
AP Environmental Science
Technical Computing for Energy Industries
Civil
Engineering
CiM
Digital Electronics
Biological
Remote Sensing
Geospatial analysis:
LMKR
MATLAB
Simulink
Digital Control Logic
Field research
LEVEL 1: INTRODUCTORY
LEVEL 2: FOUNDATIONS
LEVEL 3: ADVANCED SKILLS
LEVEL 4: PATHWAYS
PLTW Capstone:
Engineering Design and Development
PLTW
Basic Petroleum Technologies
Basic Wind and Solar
Home Energy Efficiency
Energy and Environmental Policy
PROJECT LEAD THE WAY
Oil and Natural Gas
Renewable Energy
Energy Policy
Home Energy
Engineering
AP Physics
AP Calculus
AP Environmental Science
Red Rocks Community College
Colorado School of Mines
MOOC
Grade 9
Grade 10
Grade 11
Grade 12Slide9
Case for Growth-
9 -
CTE engages students.
High school completion rates, attendance, median growth, and discipline were significantly better for students in CTE than peer groups of the same demographics, same zip codes, same schools, and same academic profile.
CTE equips students with skills necessary for readiness in career and postsecondary education.
Students taking CTE courses can graduate with workforce certifications and skills, as well as college credit. This fills a tremendous need for workforce development.
CTE operating costs are very low for a high return on investment.
After state and federal reimbursements, Denver Public Schools allocated just $560 out of PPOR last year for each student participating in CTE.
Thus, nearly half of DPS’ operating costs for CTE were covered by state and federal dollars.Slide10
Value to Students-
10 -
All students have
equitable access
to CTE programs
Courses are
aligned with skilled labor demand,
and are
responsive
to changing industry demand
CTE pathways
culminate in workforce experiences for students
, and concrete postsecondary
opportunities
Courses are
relevant, engaging, and sequenced, leading to advanced coursework for college credit
5.
Academic content
is embedded, allowing deep focus on application of knowledgeSlide11
Appendix-
11 -Slide12
Representation of Economically Disadvantaged Students
FRL %
Program
94.81
Fitness Trainer/Exercise Science
93.33
Health Science/Health Care
91.89
Sports Medicine
90.51
Automotive Technology
-
12
-
FRL %
Program
13.55
Digital Design
21.14
Web Design, Digital Film, Broadband Communication
Economically disadvantaged students are strongly overrepresented in the fitness trainer, health science, and sports medicine courses
Economically disadvantaged students are significantly underrepresented in two of the district’s larger computer-based CTE offerings
Significant digital divide by incomeSlide13
Median Growth Percentile ComparisonsELL and Low Income students who took 3+ CTE courses exhibited higher than expected median growth percentiles
- 13 -Slide14
CTE Student College Readiness in Reading-
14 -
CTE Students’
College Readiness by CCCS Cut Score*
45% CCCS College Ready in Reading
CTE Students’
College
Readiness by
ACT Cut Score*
23% ACT College Ready in Reading
Note: CCCS College Ready Cut-Score: 17
Note:
ACT College
Ready Cut-Score:
21
N= 26,431
Years: 2004-2012
N= 26,431
Years: 2004-2012
Of 26,431 CTE Students across DPS from 2004-2012, 45% were college ready in Reading by Colorado Community College System (CCCS) standards
District Comparison
DPS 2013 College Readiness by ACT Cut Score in Reading: 32%
DPS 2008-2012 Average College Readiness by ACT Cut Score in Reading: 27%Slide15
CTE Student College Readiness in English-
15 -
CTE Students’
College
Readiness
by CCCS & ACT Cut Scores*
33% CCCS and ACT College Ready in English
Note:
CCCS College Ready Cut-Score: 18
ACT College Ready Cut-Score: 18
N= 26,431
Years: 2004-2012
Of 26,431 CTE Students across DPS from 2004-2012, 33% were college ready in English by Colorado Community College System (CCCS) standards
District Comparison
DPS 2013 College Readiness by ACT Cut Score in English: 41%
DPS 2008-2012 Average College Readiness by ACT Cut Score in English: 37%Slide16
CTE Students’ College Readiness by ACT Cut Score*
CTE Students’ College Readiness by CCCS Cut Score*
CTE Student College Readiness in Math
-
16
-
25% CCCS College Ready in Math
15% ACT College Ready in Math
Note: CCCS College Ready Cut-Score:
19
Note:
ACT College
Ready Cut-Score:
22
District Comparison
DPS 2013 College Readiness by ACT Cut Score in Math: 22%
DPS 2008-2012 Average College Readiness by ACT Cut Score in Math: 20%
N= 26,431
Years: 2004-2012
N= 26,431
Years: 2004-2012
Of 26,431 CTE Students across DPS from 2004-2012, 25% were college ready in Math by Colorado Community College System (CCCS) standards