PDF-DEPARTMENT OF HEALTH& HUMAN SERVICESCenters for Medicare & Medicaid Se
Author : marina-yarberry | Published Date : 2015-09-08
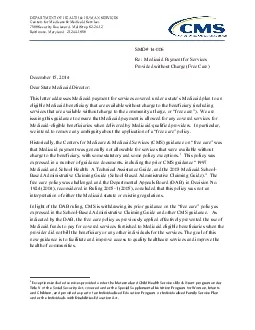
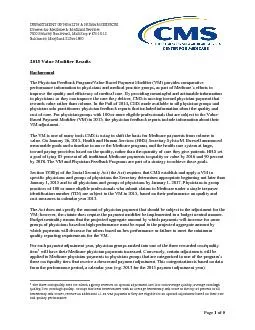
Page of Background The Physician Feedback ProgramValueBased Payment ModifierVMprovides comparative performance information to physicians and medical practice groups
Presentation Embed Code
Download Presentation
Download Presentation The PPT/PDF document "DEPARTMENT OF HEALTH& HUMAN SERVICESCent..." is the property of its rightful owner. Permission is granted to download and print the materials on this website for personal, non-commercial use only, and to display it on your personal computer provided you do not modify the materials and that you retain all copyright notices contained in the materials. By downloading content from our website, you accept the terms of this agreement.
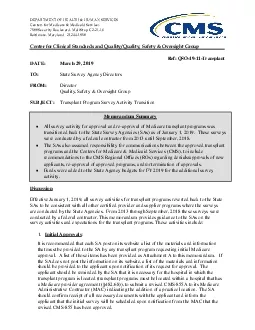
DEPARTMENT OF HEALTH& HUMAN SERVICESCenters for Medicare & Medicaid Se: Transcript
Download Rules Of Document
"DEPARTMENT OF HEALTH& HUMAN SERVICESCenters for Medicare & Medicaid Se"The content belongs to its owner. You may download and print it for personal use, without modification, and keep all copyright notices. By downloading, you agree to these terms.
Related Documents