/
Facts on Induced Abortion In the United States INCIDENCE OF ABORTION  Half of pregnancies Facts on Induced Abortion In the United States INCIDENCE OF ABORTION  Half of pregnancies

Facts on Induced Abortion In the United States INCIDENCE OF ABORTION Half of pregnancies - PDF document

marina-yarberry
marina-yarberry . @marina-yarberry
Follow
615 views
Uploaded On 2015-03-16

Facts on Induced Abortion In the United States INCIDENCE OF ABORTION Half of pregnancies - PPT Presentation

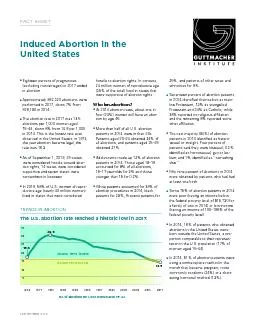
Twentyone percent of all pregnancies excluding miscarriages end in abortion In 2011 106 million abortions were performed down 13 from 121 million in 2008 From 1973 through 2011 nearly 53 million legal abortions occurred Each year 17 of women aged ID: 46348

Twentyone percent all

Share:

Link:

Embed:

Download Presentation from below link

Download Pdf The PPT/PDF document "Facts on Induced Abortion In the United ..." is the property of its rightful owner. Permission is granted to download and print the materials on this web site for personal, non-commercial use only, and to display it on your personal computer provided you do not modify the materials and that you retain all copyright notices contained in the materials. By downloading content from our website, you accept the terms of this agreement.


Presentation Transcript

Eighteen percent of pregnancies (excluding miscarriages) in 2017 ended in abortion. Approximately 862,320 abortions were performed in 2017, down 7% from 926,190 in 2014. The abortion rate in 2017 was 13.5 abortions per 1,000 women aged 15–44, down 8% from 14.6 per 1,000 in 2014. This is the lowest rate ever observed in the United States; in 1973, the year abortion became legal, the rate was 16.3. As of September 1, 2019, 29 states were considered hostile toward abor - tion rights, 14 states were considered supportive and seven states were somewhere in between. In 2019, 58% of U.S. women of repro - ductive age (nearly 40 million women) lived in states that were considered hostile to abortion rights. In contrast, 24 million women of reproductive age (35% of the total) lived in states that were supportive of abortion rights. Who has abortions? At 2014 abortion rates, about one in four (24%) women will have an abor - tion by age 45. More than half of all U.S. abortion patients in 2014 were in their 20s: Patients aged 20–24 obtained 34% of all abortions, and patients aged 25–29 obtained 27%. Adolescents made up 12% of abortion patients in 2014: Those aged 18–19 accounted for 8% of all abortions, younger than 15 for 0.2%. White patients accounted for 39% of abortion procedures in 2014, black patients for 28%, Hispanic patients for 25%, and patients of other races and ethnicities for 9%. Seventeen percent of abortion patients in 2014 identied themselves as main - line Protestant, 13% as evangelical Protestant and 24% as Catholic, while 38% reported no religious afliation and the remaining 8% reported some other afliation. The vast majority (94%) of abortion patients in 2014 identied as hetero - sexual or straight. Four percent of patients said they were bisexual; 0.3% identied as homosexual, gay or les - bian; and 1% identied as “something else.” Fifty-nine percent of abortions in 2014 were obtained by patients who had had at least one birth. Some 75% of abortion patients in 2014 were poor (having an income below the federal poverty level of $15,730 for a family of two in 2014) or low-income (having an income of 100–199% of the federal poverty level). In 2014, 16% of patients who obtained abortions in the United States were born outside the United States, a pro - portion comparable to their represen - tation in the U.S. population (17% of women aged 15–44). In 2014, 51% of abortion patients were using a contraceptive method in the commonly condoms (24%) or a short- acting hormonal method (13%). SEPTEMBER 2019 Induced Abortion in the United States FACT SHEET No. of abortions per 1,000 women aged 15–44 TRENDS IN ABORTION The U.S. abortion rate reached a historic low in 2017. 13.516.329.305101520253035Rate201720132012201120102009200820072006200520042003200220012000199919981997199619951994199319921991 Below 1973 level Ab ove 1973 l ev ls 16.313.5 197319771981198519891993199720012005200920132015101525203035 29.3 GUTTMACHER INSTITUTE Providers and services In 2017, there were 808 clinics providing abortion services, a 2% increase from 2014. However, between 2014 and 2017, regional- and state-level dis - parities in abortion access grew: The number of clinics increased in the Northeast (by 16%) and the West (by 4%) and decreased in the Midwest (by 6%) and the South (by 9%). Seventy-two percent of clinics offered abortions up to 12 weeks’ gestation in 2014, 25% up to 20 weeks and 10% up to 24 weeks. Medication abortion In September 2000, the U.S. Food and Drug Administration approved mifepristone to be marketed in the United States for non - surgical abortion. Currently, medication abortion is provided up to 10 weeks’ gestation. Medication abortions accounted for 39% of all abortions in 2017, up from 29% in 2014. The majority of medication abortions were offered in specialized clinics and in high volume facilities. In 2017, 30% of clinics provided only medication abortion. Medication abortions increased from 5% of all abortions in 2001 to 39% in 2017, even while the overall number of abortions declined. Safety of abortion A committee of the National Academies of Sciences, Engineering and Medicine reviewed the available evi - dence and conrmed in a 2018 report that abortion is safe and effective. Exhaustive reviews by panels convened by the U.S. and UK governments have concluded that there is no association between abortion and breast cancer. There is also no indication that abortion is a risk factor for other cancers. Insurance coverage, cost and payment In 2014, the average amount paid for an abor - tion with local anesthesia in a nonhospital setting at 10 weeks’ gestation was $508. The average paid for an early medication abortion (up to nine weeks’ gesta - tion) was $535. Most U.S. abortion patients had health insurance in 2014. Thirty-ve percent had Medicaid coverage, while 31% had private insurance. However, insurance does not necessarily cover abor - tion services; even when it does, patients may not use their coverage for a variety of reasons (for example, because they do not know their plan covers it, they are concerned about conden - tiality or their provider does not accept their plan). Overall, 53% of abortion patients paid out of pocket for their procedure in 2014. The Hyde Amendment currently bans the use of federal dollars for abor - tion coverage for people enrolled in Medicaid, the nation’s main public health insurance program for low- income individuals. Similar restrictions apply to other federal programs and oper - ate to deny abortion care or coverage to people with dis - abilities, Native Americans, prison inmates, poor and low-income individuals in the District of Columbia, military personnel and fed - eral employees. Although the Hyde Amendment bars federal funds from being used to WHEN WOMEN HAVE ABORTIONS In 2016, two-thirds of abortions occurred at eight weeks of pregnancy or earlier, and 88% occurred in the rst 12 weeks. 9–1011–1213–1516–20&#x/=80;/=211.9%3.5%1.3%1.8%25.6%65.8% 89–1314–1516-1718–20211.9%3.5%1.3%1.825.6%65.8 9–1013–1516–20213.86.2%1.3%14.5% 11–128.3% 866% 2116–2013–1511–129–108 9–1013–1516–20214.1%6.3%1.3%14.7% 11–128.2% 865.4% MEDICATION ABORTION As U.S. abortion numbers decline, the share that are medication abortions rises steadily. ’01’03’05’07’09’11’13’15’17 0.2.4.6.81.01.2 1.4million Total no. of abortions 1,291,000 862,320 No. of medication abortions 339,64 70,500 SEPTEMBER 2019 REFERENCES These data are the most current available. References are available in the HTML version: https://www. guttmacher.org/fact-sheet/ induced-abortion-united-states 125 Maiden Lane New York, NY 10038 212.248.1111 info@guttmacher.org www.guttmacher.org Good reproductive health policy starts with credible research provide Medicaid cover - age of abortion, states may use their own, nonfederal funds. Fifteen states have a policy requiring the state to provide abortion coverage under Medicaid. In 2014, Medicaid was the second-most-common method of payment and was reported by 24% of abortion patients. The overwhelming majority of these patients lived in the 15 states that allowed state funds to be used to pay for abortion. Fifteen percent of patients used private insurance to pay for the procedure. Most patients with private insurance (61%) paid out of pocket. Travel and logistical barriers In 2014, 65% of abortion patients traveled less than 25 miles one way to obtain care, 17% traveled 25–49 miles, 10% traveled 50–100 miles and 8% traveled more than 100 miles. Greater distances to abor - tion facilities are associated with increased burden on patients, including higher out-of-pocket costs for associated services such as food, lodging and child care; lost wages; increased dif - culty getting to the clinic; delayed care; and decreased use of abortion services. Abortion patients who lived in states with waiting period requirements and adoles - cents who lived in parental notication states traveled farther than those in states without such laws. The proportion of abor - tion patients who traveled more than 100 miles for services was twice as high among those at or beyond 16 weeks of gestation as among those who were at 12 weeks’ gestation or less (14% vs. 7%). If Roe v. Wade were overturned or weakened, increases in travel distances would likely prevent 93,500 to 143,500 individuals each year from accessing abor - tion care. If Roe v. Wade were overturned or weakened, abortion patients’ average distance to the nearest facil - ity would increase by 97 miles, from 25 to 122 miles.