/
orchard, the plant nutrients will be recycled and humus content in the orchard, the plant nutrients will be recycled and humus content in the

orchard, the plant nutrients will be recycled and humus content in the - PDF document

marina-yarberry
marina-yarberry . @marina-yarberry
Follow
462 views
Uploaded On 2015-09-10

orchard, the plant nutrients will be recycled and humus content in the - PPT Presentation

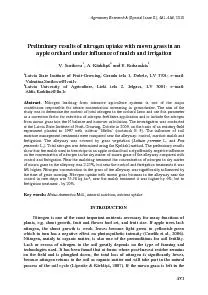
481 482 grasses using herbicides such as basta and glifosate The trees were provided with 9 g N and 12 g KO using ammonium and potassium nitrate The grass in the alleyway was not fertilised Gras ID: 125728

481 482 grasses using

Share:

Link:

Embed:

Download Presentation from below link

Download Pdf The PPT/PDF document "orchard, the plant nutrients will be rec..." is the property of its rightful owner. Permission is granted to download and print the materials on this web site for personal, non-commercial use only, and to display it on your personal computer provided you do not modify the materials and that you retain all copyright notices contained in the materials. By downloading content from our website, you accept the terms of this agreement.


Presentation Transcript

481 orchard, the plant nutrients will be recycled and humus content in the soil will also be increased (Hoagland et al., 2008). This will provide several positive consequences because the buffer capacity of the soil will increase. It will reduce the possibility for improve soil aeration, and reduce the evapotranspiration, to form the more favourable physical properties. As a result it will positively influence not only the growth of apple tree roots, but also the soil microbiological processes and finally the soil fertility. This is important for many aspects of agriculture, but especially concerning sustainable farming practice and for development of organic and integrated fruit growing technologies, where use of mineral fertilizers is restricted or only minimally acceptable. The environmental and human health concerns take priority. Grass mown in orchards can be considered as a green manure contributing to the total plant nutrient turnover. Nitrogen accumulated in the grass biomass due to the high competitive ability of cereals is not lost from the root zone. After mowing it will become the nitrogen source for the successive plants including apple trees, especially if the grass is moved to the tree strips. Therefore to plan fertilization, this amount of nitrogen might be included in calculations as an input value. The aim of the investigation was to clarify the amount of nitrogen in grass grown in an apple orchard alleyway influenced by treatment of soil moisture management in the tree strips. MATERIALS AND METHODS tvia State Institute of Fruit–Growing, Dobele, in 2009 on the basis of an existing field experiment planted in 1997 with cultivar `Melba` on the rootstock B 9 (Rubauskis et.al., 2004). The planting distance of the trees was 5 × 4 m. The canopies of trees were trained as slender spindles. The climate was as follows in 2008: the period of vegetation, when air temperatures are 5ºC or higher was 204 days (average of long-term 135 – 145 days); the average air temperature was 8.1ºC (long-term 5.5 ºC) and amount of precipitation 531 mm (similar to long-term 560 mm), however the amount of precipitation in the vegetation period was 312 mm). Soil of the experimental plot was Haplic Luvisol (Hypereutric), sandy loam organic matter content – 25 g kg (Tyurin method), pH – was 300 mg kgO – 190 mg kg162 mg kg ( DL). The following treatments of soil moisture in the tree strips (1 m wide) were compared: control – no regulation methods; sawdust mulch and fertigation. In the mulch treatment the soil surface was covered with a 10 – 20 cm layer of sawdust, which was renewed three times every three years. In the irrigation treatment ‘Den’ type cm apart were used. The irrigation pro-vided effective moistening of a 1 m wide zone in sandy loam soil or about 25% of the orchard area. In 2009 irrigation for the trees provided an additional 353 litres of water. In the alleyways (3 m wide) grass were in proportion1:3. In time, after planting, of the orchard,`weeds`such as white Trifolium repens.(Taraxacum officinale) grass lawn. During the growing season, the tree strips were maintained free of the 482 grasses using herbicides such as basta and glifosate. The trees were provided with 9 g N and 12 g KO using ammonium and potassium nitrate. The grass in the alleyway was not fertilised. Grass samples were collected as the grass was mowed – 3 times during 2009, May 20, June 21 and August 11, and left on the lawn. From the beginning of the growing season up to May 19 (first grass mowing) the average air temperature was 13.6 ºC, precipitation, 9.3 mm, till June 21 – 14.8 ºC and 93 mm, but till August 11 – 18 ºC and 96 mm correspondingly. The total nitrogen was determined using the Kjeldahl method. The nutrient uptake was s per hectare area. The results of the investigation were analyzed using dispersion analysis ANOVA(Descriptic statistic).RESULTS AND DISCUSSION Results of the investigation showed that the concentration of nitrogen in the grass of the alleyways in the apple orchard was influenced by the soil moisture regulation treatments that were placed near the tree strips – sawdust mulch or fertigation (n was in the grass samples when the fertigation treatment was applied to the tree strips, but it did not significantly differ from the concentration in the control treatment (Fig. 1). 2.432.43controlmulchertigationN, % in dry matter Control Mulch . Nitrogen concentration in grass of alleyway depending on the treatment in the tree strips. However, when using mulch treatment in the tree strips, the nitrogen concentration in the grass of the alleyways was only 8% lower than in other places that were treated. The difference is statistically significant ( ). The significantly lower nitrogen content may be explained by the fact that the nitrogen which is used by micro–organisms during decomposition of sawdust for their life functions has not yet been fully released and the immobilizati‘Melba’ on dwarf rootstock B 9 root distribution was investigated (Surikova et. al., 2008), it was noticed that roots of the grass lawn of the alleyway reached the tree strips; depending on the treatment in strips, that may explain some results of the grass investigation. It is known also that if the organic matter at the beginning of decomposition has a proportion of C/N up to 20, then mineralization exceeds immobilization, but if this proportion is more than 30, then immobilization dominates 483 the total uptake of nitrogen with mowed grass in the control treatment remained the lowest and was significantly different from nitrogen uptake near the mulch and fertigation treatments in the tree strips, where uptake was higher by 6 and 20% (0.05). Such differences were observed because the biomass of mowed grass significantly differed among treatments near the alleyway and mowing times. Precipitation from the beginning of the growth till first mowing on May 20 was only 9.3 mm, so, in the fertigation and mulch treatments with better soil moisture, the grass alleyways biomass was bigger. Still, these results contradict findings of other researchers, that plant biomass significantly increases with the use of fertigation, not with mulch (Nicholas, 2004). The contradiction may be explained by the fact that the effect of fertigation may become evident at witnessed also by the results of the present investigation, because the effect of fertigation on grass biomass was proven only for the 2 mowing time. Grass mown on August 11 no longer showed signi0.05), because the amount of precipitation increased. . Grass biomass and nitrogen uptake. Treatment in tree strips near the alleyway Control Mulch Fertigation Cut Biomass, kg haN uptake, kg haBiomass, kg haN uptake, kg haBiomass, kg haN uptake, kg ha 282.40 365.50 7.68 359.338.42 443.54 11.47 503.39 12.32 542.1213.93 494.27 15.20 503.48 15.40 567.6918.58f* Per season, 1220.21 33.36 1372.38* 35.40 1469.14* 40.93* a, b, c, d, e, f, – significantly different within columns ( )*– significantly different within rows ( 0.05) The investigations of the grass of the alleyway in orchards have not been undertaken before in Latvia, so there are no data about the rate of decomposition of mown grass and the return of nitrogen into the turnover, but researchers in other countries (Shengzuo et al., 2007; Tagliavini et al., 2007) have found that nitrogen recycles even 1–2 years after the grass has been cut. In addition, a study (Cazzato et al., 2004) shows that by throwing the mown grass into the tree strips the soil organic matter is significantly supplemented, which has a positive influence on nitrogen turnover and its availability for plants. It could be influenced also by climate differences. However results are only preliminary. They can explain only some tendencies that could be influenced by climate and other uncontrolled situations. The results of this investigation provide a basis for additional research, the results of which might make it possible to establish fertilising plans in Latvia. CONCLUSIONS The preliminary results show that the mulch used in tree strips in an apple orchard had a significantly negative influence on the concentration of nitrogen in the dry matter of mown grass of the alleyway as compared with control and fertigation. 485 clover 7.5 kg ha, lucerne 6.5 kg ha, hybrid lucerne 10 kg ha, bird’s-foot trefoil 6 and white sweet clover 18 kg ha. In 2006 barley straw was removed. In the beginning of August 2007 the biomass of legumes and barley straw were ploughed into the soil. Samples of the aboveground biomass (0.25 m from each plot) were taken before harvesting the cereals. The root mass was taken from 0–30 cm in depth (by 10*20 cm frame from each plot), washed, dried and weighed. Biomass from the undersowing samples was separated into leguminous and cereals. aboveground biomass and the root mass of leguminous crops were measured before ploughing. The vegetation period of 2006 had a high temperature regime and low precipitation. The first half of the vegetation period (up to 31 July) was very dry, with only half of the average precipitation in Estonia. In 2007, the average temperature was higher whereas the average precipitation was lower than in previous years. The drought reached its peak in August. The average temperature of the 2008 vegetation period was lower than in many previous years. Drought in spring and high average precipitation in August had an influence on the yield and quality of wheat.The analysis of variance (ANOVA) was used to evaluate the impact of the experimental variants on the yield and yield quality. The relationship between the C/N ratio (y) and the nitrogen content (x, %) of the organic matter is reflected in the following regression equation: y (C/N) = 42.977x–1.0035 0.The objectives of the trial include examining the capacity of the second vegetation year leguminous green manures to form biomass; analyzing the amount of nitrogen and carbon returned to soil, and determining the effect of these factors on the yield and quality of the succeeding crop. RESULTS AND DISCUSSION In 2007 barley pure sowings, the amounts of nitrogen returned to the soil with –1 and 57 kg ha on the background of N and N100respectively. The respective amounts for carbon were 1.83 and 2.62 Mg of C haphytomass returned to the soil in barley sowings was 4.26 and 6.10 Mg of dry matter on the background of N respectively. The total phytomass of leguminous green manures ploughed into soil in 2007 varied from 10.3 Mg hawith the bird’s foot trefoil to 13.9 Mg ha with the white sweet clover. The phytomass of hybrid lucerne was 12.5 Mg ha. The formation of legume mass is influenced by various factors. The trials have shown that red clover is more stable and resistant to unfavourable conditions than other legumes (Talgre, et al., 2009a, 2009b). White sweet clover and lucerne are more sensitive to climatic and The root mass of legumes comprised 37–54% of the total biomass. The amount of carbon applied to the soil with the green material and roots of legumes varied from 4.43 Mg ha (bird’s foot trefoil) to 5.98 Mg ha (white sweet clover). The amount of nitrogen returned to the soil was dependent on the leguminous crop; up to 274 kg of N on the treatment. Earlier research has also 489 proved that leguminous crops can bind 200–300 kg of N ha per year (Viil & Võsa, 2005; Talgre, et al., 2009b). The biological production of green manures, as well as the amounts of nitrogen they bind and the C/N ratio of organic matter vary according to the crop species, soil and farming techniques. The decomposition of organic matter in soil is largely determined by its C/N ratio. and the greater its nitrogen content, the more nitrogen is released into soil from green manure mineralisation (Kumar & Goh, 2002). The C/N ratio of the applied organic matter varied significantly. The C/N ratio of barley straw and the aboveground biomass of leguminous crops were 65–69 and 20–23 respectively. 10000120001400016000Barley N 0Barley N100Red cloverBird’s-foottrefoilLucerneHybridlucerneWhite sweetcloverN kg haMg ha100150200250300 Dry matter N kg Quantities of dry matter (Mg ha) applied into soil in 2007. Means followed by the same letter are not significantly different (P 0.05In the 2007 trial, winter wheat was sown as a succeeding crop. Despite the drought in spring, the conditions were favourable for the yield formation of winter crops, though the quality of the yield was influenced by the rainy harvesting period. Aside from weather, other factors that may influence the yield of winter wheat are crop variety and nutrient supplies. Traditionally, winter wheat is known by its higher yield potential and spring wheat by better baking quality (Swenson, 2006). The highest wheat yields were attained as preceding crops. Compared to the Ntreatment, the extra yield reached 3.26 Mg hawith green manures. After the use of bird’s foot trefoil, the yield was equal to the treatment in which 100 kg of mineral nitrogen had been applied (Fig. 1). Also Maiksteniene and Arlauskiene (2004) show that the highest wheat yield is attained when wheat is grown after lucerne as a preceding crop, the yield being 18.5% higher than after clover. Higher grain yields are usually associated with lower protein concentration (Blackman & Payne, 1987). Protein is a primary quality component of cereal grains. Protein content can be increased with higher nitrogen fertilizer norms (Peterson, 1976). In the present trial, protein content increased compared to the Ntreatment, but remained lower than the protein content of wheat (13–15%). The protein content of wheat grains was 11.7–12.8% on the background of green manures, and had a lower level in the treatment where hybrid lucerne and bird’s foot trefoil had been content (Fredericson et al., 1998) which is strongly influenced by the growing 490 preceding crops. Both green manures and mineral fertilizers enhanced the quality of winter wheat yield, but the results did not vary among different green manures. REFERENCES istensen, K. 2005. Nitrate leaching from organic arable crop rotations: effects of location, manure and catch crop. Soil Use Manage, 181–188. Berry, P.M., Sylvester-Bradley, R., Philipps, L., Hatch, D.J., Cuttle, S.P., Rayns, F.W., Goslin, P. (2002). Is the productivity of organic farms restricted by the supply available nitrogen? Soil Use Manage, 248–255. Blackman, J.A.and Payne, P.I. 1987 Grain quality. In: Lupton, F.G.H. (ed) Wheat Breeding. Its scientific basis. Great Britain, pp 455–485. Brown,B., Westcott, M., Christensen, N., Pan, B., Stark, J. 2007. Nitrogen Management for hard Wheat Protein Enhancement. http://info.ag.uidaho.edu/PDF/PNW/PNW0578.pdf (20. 02. 2007). Frederiksson, H., Salomonsson, L., Andersson, L., Salomonsson, A-C. 1998. Effects of protein and starch characteristics on the baking properties of wheat cultivated by different strategies with organic fertilizers and urea. Acta Agric. Scand., Sect. B, 49–57. Gaines C.S., Finney P.L., Andrews C. 1997. Influence of kernel size and shriveling on soft wheat milling and baking quality. Cereal Chem., (6), 700–704. Grausgruber, H., Oberforster, M., Werteker, M., Ruckenbauer, J., Vollmann, J. 2000. Stability of quality traits in Austrian-grown winter wheats. Field Crop Research257–267. Harper, L.A., Hendrix, P.F., Langdale. G.W. and Coleman, D.C., (1995). Clover management to provide optimum nitrogen and soil water conservation. Crop Science.,: 176–182. Järvan, M., Adamson, A., Edesi, L. 2007. Talinisu väetamisest lämmastiku ja väävliga. Soovitusi põllukultuuride kasvatajale. Saku, lk. 9–13. (in Estonian) Kangor, T., Tamm, I., Tamm, Ü., Ingver, A. 2007. Väetamise mõju ja tasuvus suviteraviljadel. Millest sõltub teravilja saagikus. Jõgeva SAI, lk. 4–13. (in Estonian) Kumar, K., Goh, K.M. 2002. Management practices of antecedent leguminous and non–leguminous crop residues in relation to winter wheat yields, nitrogen uptake, soil nitrogen mineralization and simple nitrogen balance. European Journal of Agronomy. : 295–308. Maiksteniene S. and Arlauskiene A. 2004. Effect of preceding crops and green manure on the fertility of clay loam soil. Agronomy Research. (1), 87–97. Olesen J. E., Askegaard M., Rasmussen I. A. 2009. Winter cereal yields as affected by animal manure and green manure in organic arable farming. European Journal of Agronomy.30,119–128. Peterson, D. M., 1976. Protein concentration, concentration of protein fractions and amino acid balance in oats. – Crop Science, 663–666. Poutala, R.T, Kuoppamäki, O., Korva, J. &Varis, E. 1994. The performance of ecological, integrated and conventional nutrient management systems in cereal cropping in Finland. Field Crops Research., 3–10. Schjønning, P., Elmholt, S., Christensen, B.T., 2004. Soil quality management – synthesis. In: Schjønning, P., Elmholt, S., Christensen, B.T.(Eds.), Managing Soil Quality: Challenges in Modern Agriculture. CAB International, p. 368. Swenson, A. 2006. Wheat Economics: Spring versus Winter. www.ext.nodak.edu/extnews/newsrelease/2006/083106/12wheate.htm - (05.11.2009L., Lauringson, E., Roostalu, H., Astover, A., Eremeev, V., Selge, A. 2009a. The effects of pure and undersowing green manures on yields of succeeding spring cereals. Agric. Scand. Sect. B – Soil and Plant Sci., 2009; , (1), 70–76. Talgre, L., Lauringson, E., Roostalu, H,. Astover, A., Makke, A. 2009b. Phytomass formation and carbon amount returned to soil depending on green manure crop. Agronomy Research, (Special Issue 1), 517–521. Viil, P., Võsa, T. 2005. Liblikõielised haljasväetised. EMVI Infoleht 148, 16 pp. (in Estonian) Agronomy Research (Special Issue II), 493–498, 2010 Control possibilities of wheat with autumn and spring applications of herbicides in I. Vanaga, Z. Mintale and O. Smirnova Latvian Plant Protection Research Centre, Lielvardes iela 36/38, Riga LV-1006 Abstract.This paper presents results on weed control and yield responses in winter wheat grown after winter oilseed rape and after winter wheat, using data from field trials with a range of herbicides registered for use in Latvia that were applied either in the autumn or in the spring. Apera spica-venti was the dominant weed in these trials, accounting for 7080% of the total weed biomass. Spring application of herbicides did not provide good control of Apera spica- up to harvest time: the infestation at application time was more than 140 plants per mAutumn application of appropriate herbicides gave satisfactory control of Apera spica-venti up to harvest time in the following year. All herbicide treatments significantly increased crop yield but the autumn applications gave significantly greater increases than nearly all spring applications. Key wordsApera spica-venti, winter wheat, yield, herbicide application in autumn and in spring Economic pressures have led many arable farmers in Latvia and other countries of northern Europe to adopt crop rotations based on the sequence of winter oilseed rape followed by winter wheat or successive crops of winter wheat. From 2000–2008 the areas of winter wheat and oilseed rape in 117.4 to 170.4 thousand ha; oilseed rape from 6.9 to 82.6 thousand ha. On the larger farms the main crop rotation is now based on winter wheat and winter oilseed rape. nges in the weed flora such that Apera is now an important target for control and serious yield losses have occurred in winter wheat crops where the spica-venti has not been controlled effectively. For example, Bartels (2004) found a grain yield loss of 3 t ha in untreated plots which were infested with 200 Apera spica-venti plants m compared to treatments providing successful grass weed contcereals have also been reported by Danish researchers: Andreasen & Stryhn (2008) and Melander et al. (2008). In a ranking of the 15 most important weed species found in winter cereal crop systems in 26 European countries, was ranked fifth among all weeds and first among grasses (Schroeder et al., 1993). Weed population in treatments without herbicide application reveal the efficiency of weed management in previous years. Weed populations were more influenced by the preceding crop and by the timing of herbicide application than by the tillage system 493 long-term averages and some very rainy days occurred during the second 10-day period. Overall the daily mean temperature for the month was slightly above the long-term average and the precipitation was only 56.5 % of long-term average (Figs 1, 2). Around application time in spring 2008, during the second 10-day period of April, the mean daily temperature was higher than the long-term average and there was sufficient precipitation for plant growth. Overall, the weather during the vegetative period was drier than average which affected crop and weed emergence and development unfavourably. 100120140160180200SepOctNovAprMayJunJulPercentage of long-term mean 2006/07 2007/08 Total monthly precipitation as percentage of long-term monthly mean during 07 and 2007–2008; data from Jelgava HMS. RESULTS AND DISCUSSION In autumn 2006 the emergence of the wheatwell developed, at 14–15 BBCH stage, when the autumn herbicide treatment was applied. The infestation of within the trial was 32 plants m, up to 2 leaf stage (3–4 cm). In spring 2007 the winter wheat was at the end of the tillering stage (28–29 BBCH) when the spring herbdensity of Apera spica-venti in the untreated plots was 142 plants m, mostly at 8 cm in height and well developed. In autumn 2007 the winter wheat waautumn herbicide treatment was applied. The growth stage of to 2 leaf stage and the infestation was very high: more than 430 plants mherbicide treatments were applied on 16 April 2008 when the Apera spica-ventiwere at the tillering stage (12 cm in height) and the infestation was still very high: more than 424 plants mIn both of these winter wheat experiments dicot weed species were also recorded; the main species were: Viola arvensisCentaurea as well as volunteer oilseed rape (weeds was only 20–30% of the total weed biomass. Most of the weed biomass was accounted for by and the high infestation of this grass species suppressed the growth of the dicot weeds. The efficacy of the herbicide treatments in controlling was evaluated by counts of flowering panicles close to harvest time. All the herbicide A. spica-venti panicle numbers compared with 496 Agronomy Research (Special Issue II), 499–504, 2010 The impact of a farm’s annual cattle slurry yield on the options for moving the slurry from stable to plot: a simulation study R. Vettik and K. Tamm Estonian Research Institute of Agriculture, Teaduse 13, Saku, Estonia; e-mail: raivo.vettik@eria.ee The economical efficacy is substantial on both occasions for feeding plants with nutrients and moving the manure from stables to the plots. The aim of the present research is to explain the limit values for the annual amount of slurry and average plot distance on a farm as conditions to decide in favour of a personal eco-friendly slurry distributor or custom equipment. In their previous researches, the authors have composed models to calculate slurry management costs for different technologies depending on plot distance, taking into account ammonia emissions. In the present study, simulations were made using the composed calculation models to compare slurry distribution costs for four slurry application technologies. Calculations show that if the annual amount of slurry exceeds 4000 m, then for plot dis-tance over 2 km, custom slurry distribution is cheaper than using the farm’s own equipment. How-ever, if the annual quantity of slurry exceeds 16,000 m, then the limit value for distance is 5 km. If the annual amount of slurry is 4000 m, then full custom service is cheaper than the technology in which the farm’s own slurry distributor and custom transportation is used. In the case of the annual amount of 16,000 m, it is less expensive to use the farm’s own slurry distributor and custom transportation. In order to benefit from the use of the farm’s own distributor the minimum value for annual slurry amount is 5600 m ammonia emissions, slurry application technology, plot distance, performance, operation costs, custom machines, annual slurry amount On the basis of environmental impacts in agricultural production, the following pollution subdivisions can be distinguished: point pollutants (animal farming, manure storages, etc) and diffuse pollution (e.g., pollution from manure distribution in the fields) (Dämmgen ., 2007). Leakage of farmyard stores and runoff following slurry application to the land can lead directly to losses of organic matter, nutrients and pathogenic micro-organisms, with potential consequences for both stream ecology and human health (Naden ., 2009). These diffuse losses have mainly been characterised in terms of nutrients (Vadas ., 2007). Ammonia volatilisation can be a major source of N losses from applied slurry ., 2003). Ammonia emission has been studied in several countries. The emission is magnified by higher air temperature during the spreading, wind matter and ammonium nitrogen of the slurry (Mattila, 2006), as well as by high soil pH and temperature (Sommer et , 2003; Misselbrook , 2005) and low soil moisture (Jokela & Meisinger, 2008). 499 Although gas emission, leaching of nutrients and odour have undesirable effects on the environment, the contribution of manure to plant nutrition and build-up of soil organic matter is considered to have a positive effect. To utilise the nutrients contained in manure and minimise air pollution, it is essential to apply technology suppressing the gas emission from slurry distributed on the field. In the Defra (2006) project, the impact of different spreading devices on the ammonia emission was compared in the UK, Germany, Denmark and Finland. The average values of reduction of ammonia emission compared to technology where slurry was broadcast-spread and not incorporated from that research are as follows: trailing hose 32%, trailing shoe 60%, open slot injection 67%, closed slot injection 82% and deep injection 86%. By IPCC (2007) the ammonia emission factors for different application technologies are the following: 70% for broadcast spreading, without incorporation, 20% for spreading with a trailing hose, 10% for spreading with an open slot shallow injector and 1% for spreading with a closed slot. The effect of the use of slurry depends also on the time-lag between spreading and incorporation. The time-lag depends inter alia on the distance to the manure storage if incorporation is consecutive (one-man system) (Huijsmans and de Mol, 1999). Paudel (2009) determined by a GIS-based model a least-cost dairy manure application distance for Louisiana’s major dairy production area. A comparison between the dairy manure and commercial fertilizer application under three consistent rules – N, P, and Krevealed that the use of dairy manure is not economical after 30 km for N and 15 km Plant nutrient overloads can result from several forms of mismanagement, including over-fertilisation of crops (Gerber , 2005). The objective should be to apply slurry to match the needs of the crop both in terms of amount and timing, attempting to minimise nutrient losses while maintaining adequate yields. Nutrient absorption by soil and plants is a complex of factors including soil, climate conditions, season and plant species (Lewis ., 2003). In order to decrease excessive application of nutrients, it is not advisable to use more manure than the soil and yield properties allow. The herd size determines proportionally the area needed for distributing the manure produced by animals. However, the larger the areas, the longer are the average manure transportation distances (Tamm, 2009). The farm’s annual slurry quantity and transportation distance as the selection criteria of slurry application technology should be explained. Schindler (2009) has published data for choosing the machines for the slurry delivery chain depending on those criteria in average production conditions of Germany with labour cost 16 € ha and fuel price 1.45 € l. In Estonia these values are 3.8 € ha0.58 € l, respectively. Thus, the German data are not applicable to Estonia and no literature is available with similar data for Estonia. The equipment for slurry application can be the farm’s own or rented from a service provider. There are no data published about a farm’s annual slurry quantity as a decision criterion to choose one’s own or custom machinery. Therefore, the present paper compares slurry distribution costs considering a farm’s annual slurry quantity and average transportation distance in the case of four technological approaches for average Estonian production conditions: incorporating disc device – the slurry is simultaneously distributed and mixed incorporating disc device as in variant no. 1, but the slurry is transported to the 500 spreading by trailing hose spreader plus a separate operation to incorporate the slurry to the soil; and custom slurry distribution: slurry is transported by tank trucks to the plot and distributed with a self-propelling and incorporating slurry distributor. The results from this study are considered to be targeted for slurry producers, to enhance their knowledge of the impact of the farm’s annual slurry quantity and plot distance on the technological options. MATERIALS AND METHODS In calculations, it was presumed that manure comes from the farm’s own production and the only costs arise from transportation and distribution. The calculation model is composed by the authors and has been previously published (Tamm & Vettik, 2008). The model contains components from the method, applied to evaluate options for exploitation of a plot considering costs depending on plot distance (Tamm, 2009). The prices of fuel and custom works used in calculations are from summer 2009. The prices of machines are collected from KTBL (2008). Four simulated cases for slurry handling have been studied. A description of the technological sequence for slurry handling is as follows: 1) mixing – pumping from storage into the distributor tank – transporting with distributor to the plot – distribution and mixing with soil simultaneously; 2) mixing – pumping from storage into the custom truck tank – transporting with truck to the plot – pumping from the truck tank into the distributor tank – distribution and mixing with soil simultaneously; 3) mixing – pumping from storage into the distributor tank – transporting with o the soil with trailing hoses – separate operation to incorporate the slurry to the soil; and 4) mixing – pumping from storage into the custom truck tank – transporting with truck to the plot – pumping from truck tank into the custom distributor tank – the custom distributor tank distributes and mixes slurry with soil simultaneously. Before slurry transportation and its distribution for slurry mixing and pumping 15 kW electrical device with performance 4.5 m (price is 4605 €) is applied. From the observations of ERIA researchers, the slurry should be mixed the entire time the distribution lasts. On the plot, the distributor’s own pump is used for over-pumping. In all technological variants the distributor has a tank with 15 m and labour cost is 3.8 € h. The distributor used in variants 1 and 2 is equipped with a 4.5 m wide disc device (price of distributor is 52,560 €); tractor power is 158 kW (price is 102,560 €). The distributor used in variant 3 is equipped with a 12 m wide trailing hose spreader (price for whole system is 42,200 €) and the tractor engine power is 102 kW (price is 76,730 €). In variant 4, a custom self-propelled distributor equipped with a 4.5 m wide disc device is used with the engine power of 246 kW. The price of custom work with this distributor is 2.2 € mIf custom work is used only for transportation of the slurry to the field (variants 2 and 4), then the tanker lorry with initial cost 1.3 € m is rented. If the distance exceeds 7 km, then 0.07 € m per every extra km must be added to the initial cost. 501 In the 3rd technological variant a field-operation-unit containing a 158 kW tractor and a 4 m wide disk harrow (price is 31,950 €) to mix slurry with soil is used. The time span between slurry distribution and mixing with soil may not exceed 4 h. Ammonia emission factors used for technologies are as follows: 20% for and 5% for incorporating the disc device (as the average value between values for spreading with an open slot shallow injector and for spreading with a closed slot) (variants 1, 2 and 4) (IPPC, 2007). The annual work capacity for the spreader is 4000 m and 16,000 m. The slurry and the plot area was 20 ha for all technological variants. The RESULTS AND DISCUSSION Simulations were made using composed calculation models to compare slurry distribution costs for four slurry application technologies considering the farm’s annual slurry quantity and distance to the plot. The results for technological variant 1 (farm’s own soil mixing disc device) and 4 (custom slurry distributor) are shown in Fig. 1. Fig. 1 indicates that if the annual quantity of slurry exceeds 4000 mplot distance over 2 km, custom slurry distribution is cheaper than the use of the farm’s own equipment. Slurry management costs for 2 km and 4000 m both in the case of variant 1 and 4. However, if the annual quantity of slurry exceeds 16,000 mthen the limit value for distance is 5 km. For variant 1, slurry management costs for 5 km distance are 4.7 € m and 3.5 € m for annual slurry amounts 4000 mand 16,000 m, correspondingly. The greater the annual amount of slurry, the cheaper is management of the slurry per m (2004) got similar results. However, a greater amount of slurry needs a larger distribution area, which requires a longer distance and a greater cost for slurry transportation. Dr. Schindler (2009) has published data for a slurry distributor with a16 m tank and a 6 m wide slot injector. If the distance to the plot is 2 km, the plot area is 10 ha, and the farm’s annual quantity of slurry is 4,800 m, then the slurry distribution cost is 4.85 € m. For 5 km, this cost is 6.43 € m. The higher costs brought out by Schindler compared to our figures are probably induced by a more expensive distributor (it is wider and has a somewhat bigger tank, requiring a more powerful tractor), higher labour cost and fuel price. The calculations show that distribution is cheaper (ca 0.64 € m) in the case of the trailing hose spreader (variant No. 3), because of the greater work width and cheaper machine price; Huijsmans (2004) and Schindler (2009) had analogous results. Considering the impact of the art of distribution of slurry on the loss of nitrogen by ammonia emission it is essential to incorporate slurry into the soil on arable land. The slurry incorporation performed for diminishing the ammonia emission is a separate operation with a cost of ca 25.6 € ha. This result is the same as by using an incorpo- are not presented separately in the figure. If the slurry distributor is used for slurry distribution only, then the custom tank lorry is used for transporting the slurry to the plot (variants 2 and 4); results are presented in Fig. 2. The eco-friendly slurry application equipment is expensive; therefore, it is most effective to use these machines for distribution, rather than for the 502 transportation of slurry (Tamm, 2009). Thus, the separate vehicles with slurry tanks should be used to transport the slurry to the plot especially for longer distances. In Estonian conditions the maximum distance for transporting the slurry by distributor itself to the plot is about 4 km (Tamm & Vettik, 2008). Average field distance, kmSlurry distribution costs,€ m-3 Own distributor (16,000 m3) Own distributor (4,000 m3) Using custom machines 0510Average field distance, kmSlurry distribution costs,€ m-3 Own distributor (16,000 m3) Own distributor (4,000 m3) Using custom machinesFigure 1. Slurry distribution costs in the case of farm’s own distributor and using custom machines. Figure 2. Slurry distribution costs ifcustom tank lorry is used for transportation and spreading is performed by farm’s own distributor or custom distributor. Figure 2 demonstrates that full custom service (variant 4) will be cheaper than the farms’ own slurry distributor and custom amount of slurry is 4000 m. If the annual amount is 16,000 mexpensive to use the farm’s own slurry distributor and custom transportation. For variant 2, slurry management costs for 5 km distance are 4.0 € m and 2.8 € mannual slurry amounts of 4000 mand 16,000 m, correspondingly. In order to benefit from the use of the farm’s own distributor the minimum value for annual slurry amount is 5600 m by our calculations. Sørensen (2003) report that use of distributors with a large tank volume is rational when the annual slurry amount exceeds 9000 t. If that amount remains under 3000 t, it is not at all profitable to own a distributor; the custom distribution is cheaper. CONCLUSIONS Before investing in eco-friendly but expensive slurry distribution technology, the farmer has to calculate whether his farm has enough slurry to ensure a lower work price than custom service. The calculations show that, in the conditions used in our simulations, the minimum value for annual slurry amount is 5600 m to own a dis-tributor. We also found that the distribution cost in the case of a trailing hose spreader with an extra operation for soil mixing is equal to the distribution cost of incorporating a disc distributor. In the first case the additional time and labour should be taken into account for the soil-mixing operation. The ammonium emission is also somewhat in the present study. For longer distances to the plot, the farmer should consider hiring a custom tank lorry for slurry transpor-tation, and the farm’s own distributor should be used only for distribution on the plot. 503 REFERENCES Dämmgen, U., Hutchings, N.J. 2007. Emissions of gaseous nitrogen species from manure management: A new approach. Environmental Pollution, 488–497. Defra. 2006. ADAS Research project A Collation and Analysis of Current Ammonia Research[WWW] http://sciencesearch.defra.gov.uk/Default.aspx?Menu=Menu&Module=-More&Location=None&Completed=0&ProjectID=11440 (10.09.2009) Gerber, P., Chilonda, P., Franceschini, G., Menzi, H. 2005. Geographical determinants and environmental implications of livestock production intensification in Asia. Bioresource Technology (2), 263–276. Huijsmans, J., Verwijs, B., Rodhe, L., Smith, K. 2004. Costs of emission-reducing manure application. Bioresource Technology , 11–19. Huijsmans, J.F.M., de Mol, R.M. 1999. A Model for Ammonia Volatilization after Surface Application and Subsequent Incorporation of Manure on Arable Land. Journal of Agricultural Engineering Research, 73–82. IPPC. 2007. Integrated Pollution Prevention and Control. Best Available Techniques for Intensive Rearing of Cattle. 2007. [WWW] http://www.ippc.envir.ee/docs/PVT/-BAT%20for%20Intensive%20Rearing%20of%20Cattle.pdf (02.09.2009). Jokela, B., Meisinger, J. 2008. Ammonia Emissions From Field-applied Manure: Management For Environmental And Economic Benefits. In Proc. Of The 2008 Wisconsin Fertilizer, Aglime & Pest Management Conference. pp. 199–208. KTBL 2008. Betriebsplanung Landwirtschaft 2008/09. 21. Auflage, 752 s. (in German) Lewis, D.R., McGechan, M.B., McTaggart, I.P. 2003. Simulating field-scale nitrogen management scenarios involving fertiliser and slurry applications. , pp 159–180. Mattila, P.K. 2006. Ammonia emissions from pig and cattle slurry in the field and utilization of slurry nitrogen in crop production. Doctoral Thesis MTT Agrifood Research Finland. 136 pp. Misselbrook, T.H., Nicholson, F.A., Chambers, B.J. 2005. Predicting ammonia losses following the application of livestock manure to land. Biosystems Technology, 159–168. Naden, P.S., Old, G.H., Eliot-Laize, C., Granger, S.J., Hawkins, J.M.B., Bol, R., Haygarth, P. 2009. Assessment of natural fluorescence as a tracer of diffuse agricultural pollution from slurry spreading on intensely-farmed grasslands. Water Research. Article in press. doi:10.1016/j.watres.2009.11.038. Paudel, K.P., Bhattarai, K., Gauthier, W.M., Hall, L.M. 2009. Geographic information systems (GIS) based model of dairy manure transportation and application with environmental quality consideration. Waste Management, 1634–1643. Schindler, M. 2009. Mit Gülletechnik Dünger sparen. 3, s 104–109 (in German). Sommer, S.G., Génermont, P., Cellier, P., Hutchings, N.,J., Olsen J.E. 2003. Processes controlling ammonia emission from livestock slurry in the field. European Journal of Agronomy 465–486. Sørensen, C.G., Brian H. Jacobsen, B.H., Sommer, S.G. 2003. An Assessment Tool applied to Manure Management Systems using Innovative Technologies. Biosystems Engineering(3), 315–325. Tamm, K. & Vettik, R. 2008. Case study: Economics of spring feeding in grassland. Agronomy Research, 387–396. Tamm, K. 2009. The dependency on the structure of machinery and the locality of plots on cereal farm work activities. Doctoral Thesis. Estonian University of Life Sciences. Tartu. 127 pp. Vadas, P.A., Harmel, R.D., Kleinman, P.J.A. 2007. Transformations of soil and manure phosphorus after surface application of manure to field plots, Nutrient Cycling in Agroecosystems, 83–99. Use italics for Latin biological names and for statistical terms (-test, = 193, P � 0.05) Use single (‘……’) instead of double quotation marks (“……”) Tables All tables and figures must be referred to in the text (Table 1; Tables 1, 2) For tables use font Times New Roman, regular, 10 points Use TAB and not space bar between columns Do not use vertical lines as dividers, only horizontal lines are allowed Primary column and row headings should start with an initial capital, secondary headings without initial capital Figures Use only black and white for figures Use font Arial within the figures Legend below the figure must not be in a frame of the figure All figures must be referred to in the text (Fig. 1; Fig. 1A; Figs 1, 3; Figs 1–3) References Within the text In case of two authors use . In case of more than two authors, reduce to first author “et al.” Smith & Jones (1996); (Smith & Jones, 1996) Brown et al. (1997); (Brown et al., 1997) Adams (1998); (Adams, 1998) When referring to more than one publication, arrange them using the following keys: 1. year of publication (ascending), 2. alphabetical order for the same year of publication: (Smith & Jones, 1996; Brown et al., 1997; Adams, 1998; Smith, 1998) For whole books Name(s) and initials of the author(s), year of publishing, title of the book (in italic), publisher, town of publishing, number of pages.