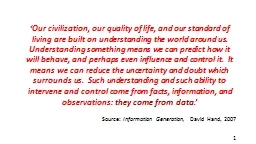
they come from data Source Information Generation David Hand 2007 Data Data Everywhere But Lets Just Stop and Think David J Hand We are on the cusp of a tremendous wave of ID: 638954
Download Presentation The PPT/PDF document "‘Our civilization, our quality of life..." is the property of its rightful owner. Permission is granted to download and print the materials on this web site for personal, non-commercial use only, and to display it on your personal computer provided you do not modify the materials and that you retain all copyright notices contained in the materials. By downloading content from our website, you accept the terms of this agreement.
Slide1
‘Our civilization, our quality of life, and our standard of living are built on understanding the world around us. Understanding something means we can predict how it will behave, and perhaps even influence and control it. It means we can reduce the uncertainty and doubt which surrounds us. Such understanding and such ability to intervene and control come from facts, information, and observations:
they come from data
.’
Source:
Information Generation,
David Hand, 2007Slide2
Data, Data Everywhere
-
But Let’s Just Stop and Think
David J. HandSlide3
‘We
are on the cusp of a tremendous wave of
innovation, productivity
, and
growth … all
driven by
big data as consumers
, companies, and economic sectors exploit its potential’
Source: McKinsey
,
2011
Similar claims for the impact on science, medicine, government,
etcSlide4
Interest in
data science
, 2004 to present
Source: Google TrendsSlide5
Number of US students studying statistics and biostatistics
Source:
Amstat
News
, 1 October 2016Slide6
Why is all this happening now?
(1) g
rowth in
computer memory capacity
→
larger data sets
Source: Kurzweil, 2001
LSST
: 30 trillion
observations
LHC
data from 100 trillion proton collisions
racing
car engine telemetry: 1000 values per
sec
ICU: 200 variables
. . . . . Slide7
Why is all this happening now?
(2) faster computers
Source: Kurzweil, 2006
Slide8
Why is all this happening now?
(3)
automatic data capture
→
real-time: streaming data
→ often
secondary, as a by-product of operations
→ variety
: signals,
traces,
images,
….
Source: Pixabay
Source:
D.J.HandSlide9
Why is all this happening now?
(4) Open
data
-
in
science
Source: NASA
Source: Wiley
- in societySlide10
Two
aspects to capitalising on this revolution:
Understanding
, inference, forecasting, ...Higgs Boson
Climate change
Social network analysis
Medical research
....
Matching
, choosing, searching, ...UberGoogle TranslateStreetbumpWhere’s My Bus....Slide11
Sounds wonderful?
Sounds easy ?Slide12
Need the technical skills and understanding
Which is what we teach at university
But also needs an understanding of
the risks, problems, and obstacles Slide13
Some of the challenges
Bad
data
:not the data you want,
but a
distorted
version
Invisible
data
:not just the data you’ve got, but also the data you’d likeChanging data:
not the data you’ve got, but the data you’ll have
Alternative data:not the data you’ve got, but the data you would have hadMisleading data:not the data you’ve got, but the data you think you’ve gotSlide14
BAD DATA
Not the data you want,
but a distorted version
“Britain’s
largest bat, the greater mouse-eared bat, which was officially declared extinct in the UK 12 years ago, has been rediscovered hibernating in an underground hole in West Sussex. They can weigh up to 30kg and have ears as long as 3 cm
.”
Source: The Times
, December 2002
The newspaper then included a
footnote:
A
greater mouse-eared bat usually weighs about 30g, not
30kgSlide15
Last week:
“Two students suffered ‘life threatening reactions’ when they were given enough caffeine for 300 cups of coffee.
… spent several days in ICU…dialysis…
Should have been given 0.3g of caffeine. Instead they were given 30g.”
The Times, 26 January 2017
The
Mars Climate Orbiter
Launched 1998, but communication lost on September 1999 when the spacecraft trajectory brought it too close to Mars
… because one of the software teams forgot to convert Imperial units to SI unitsSlide16
“Poor data quality costs the US economy around $3.1 trillion per year”
Source: IBMSlide17
What causes bad data?
Human error:
Shares in J-Com losing $200m after a broker tried to sell 610,000 shares for 1 yen each, instead of 1 share for 610,000 yen
Poor data collection methods
:
P
eak at 11 November 1911 for
d.o.b
. in a database
Fabrication
of data?
S
cientific fraud
Source: Steen
RG,
Casadevall
A, Fang FC (2013
)Slide18
Berry and
Linoff
(2000) example:
“The
data is clean because it is automatically generated
– no human ever touches
it
”
But it turned out that 20
% of transactions
had“arrived before they were sent .... not only did people never touch the data, but they didn’t set the clocks on the computers either
”Slide19
Not merely human
error
Source: Dave YearlingSlide20
Bad data can occur in an unlimited number of ways
Cannot check a billion values by hand
The computer is a necessary intermediarySlide21
Maintain a healthy scepticism
Twyman’s
Law:
Any figure that looks interesting or different is usually wrongSlide22
Other aspects of bad data:
relevance,
timeliness,
consistency,
coherence,
availability,
and accessibilitySlide23
INVISIBLE DATA
Not just the data you’ve got,
but also the data you’d likeSlide24
INVISIBLE DATA
Not just the data you’ve got,
but also the data you’d likeSlide25Slide26Slide27Slide28
28Slide29
Non-response and refusals
LFS quarterly survey wave-specific response rates
: March-May
2000 to July-Sept 2015
Source: http
://www.ons.gov.uk/ons/guide-method/method-quality
/
specific/labour-market/labour-force-survey/index.htmlSlide30
The magazine survey which asks readers one question:
Do you reply to magazine surveys?
And discovers that apparently
all the readers reply to surveys
The Actuary
, July 2006, editorial:
“
A couple of months ago I invited all 16,245 of you to participate in our online survey concerning the sex of actuarial offspring.”
“ ... Well, I’m pleased to say that a number of you (13, in fact) replied to our poll.
”Slide31
Hurricane Sandy
20 million tweets between 27
Oct
and 1 Nov 2012 But
most
tweets came from
Manhattan
few
from Breezy Point, Coney Island and Rockawaywhich were more severely affected- because of relative density of population / smartphones- because power outages meant phones not recharged → distorted impression of where the damage occurredSlide32
CHANGING DATA
Not the data you’ve got,
but the data you’ll have
Non-
stationarity
Slide33
ALTERNATIVE DATA
Not the data you’ve got,
but the data you would have had
“
Counterfactuals”
Credit card transaction fraud detection
- compare
existing detector with proposed new one- stop transaction when existing detector says its suspicious- not when proposed (untried, untested) new one says so
→ data asymmetry→ comparison artificially favours one methodSlide34
MISLEADING DATA
Not the data you collect,
but the data you think you’ve got
Answering
the wrong
question
Crime
rates, 1997-2003
Crime Survey England and Wales
vs Police Recorded Crime
CSE&W: …not group residences; not crimes against commercial or public sector bodies; victim-based (not include murder); capping repeat victimisation ...
PRC: reported to and recorded by police; crime defined by “Notifiable Offence List” (incl. murder, public order, ...); incl. residents of institutions and tourists; incl. commercial bodies …Slide35
So what should we
do?
Detection
Prevention
CorrectionSlide36
Detection
Does the data conform to what you expect?
Are different data sources consistent?
- outliers
- expected distributions
- triangulation
- change points
Slide37
Prevention
Consistency checks on data entry
- logical, rule-based
Careful design of data collection systems
Why were so many doctors born on 11
th
November 1911 ?Slide38
38
Correction
Imputation
Sophisticated statistical adjustment
Rule-based consistency
But cannot perform miracles !Slide39
So where does all this leave
us?
Some
recommendations
1) Consider the origin of the data: don’t take at face value
“We
don’t have any fraud at my
bank”
Said to me by a banker at a conference
2) Sense checkThe 1970 US Census showed that 289 boys had been both widowed and divorced by the age of 143) Statistics and data science MScs should have a module on data qualityCan’t teach data quality issues while teaching methods and ideasSlide40
“
With enough
data,
the
numbers speak for
themselves
”
Chris Anderson in
Wired magazine, 2008
“the most reckless and treacherous of all theorists is he who professes to let
facts and figures speak for themselves, ...” Alfred Marshall, Inaugural Lecture to Chair in Political Economy, Cambridge, 1885Slide41
If the data can speak for themselves
They can also lie
for
themselves
David HandSlide42
t
hank you