/
Validation of Temporal Scoring Metrics Validation of Temporal Scoring Metrics

Validation of Temporal Scoring Metrics - PowerPoint Presentation

martin
martin . @martin
Follow
343 views
Uploaded On 2022-06-15

Validation of Temporal Scoring Metrics - PPT Presentation

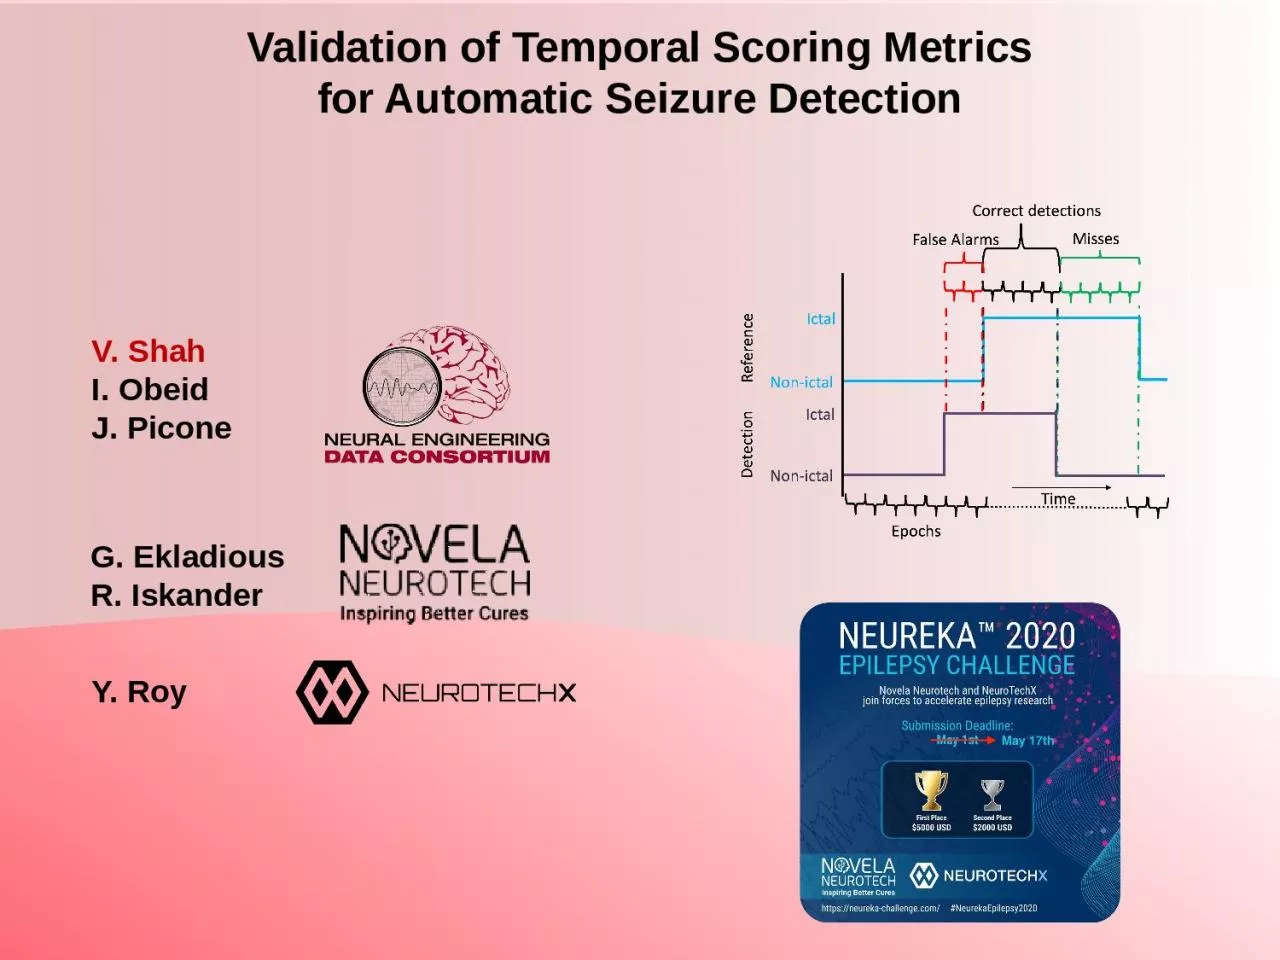
for Automatic Seizure Detection V Shah I Obeid J Picone Y Roy G Ekladious R Iskander Abstract Standardized databases and evaluation metrics accelerate research and technology development by enabling direct comparisons of research results ID: 919012

event metrics taes events metrics event events taes scoring system seizure nedc 2020 evaluation time eeg fas sia hypothesis

Share:

Link:

Embed:

Download Presentation from below link

Download Presentation The PPT/PDF document "Validation of Temporal Scoring Metrics" is the property of its rightful owner. Permission is granted to download and print the materials on this web site for personal, non-commercial use only, and to display it on your personal computer provided you do not modify the materials and that you retain all copyright notices contained in the materials. By downloading content from our website, you accept the terms of this agreement.


Presentation Transcript

Slide1

Validation of Temporal Scoring Metricsfor Automatic Seizure Detection

V. Shah

I. Obeid

J. Picone

Y. Roy

G. Ekladious

R. Iskander

Slide2

Abstract

Standardized databases and evaluation metrics accelerate research and technology development by enabling direct comparisons of research results.

The bioengineering community lacks standard evaluation metrics for scoring of sequential decoding algorithms.

The Neureka 2020 Epilepsy Challenge was created to bring a community-wide focus on automated seizure detection and establish meaningful baselines.In this presentation, we analyze the results of 4 research groups that provided sufficiently detailed results using four evaluation metrics:

Dynamic Programming Alignment (DPAL)

Epoch Sampling (EPCH)Any-Overlap Method (OVLP)

Time Aligned Event Scoring (TAES)We validate the use of the TAES metric because it evaluates partial overlaps and penalizes errors based on a reference event’s duration.We also demonstrate that scoring a system using multiple metrics gives insight into the system’s behavior that can be used to improve an algorithm and optimally tune it for a specific evaluation metric.

Slide3

Based on the Temple University Hospital

Seizure Detection Corpus (TUSZ) v1.5.2,

which includes a blind evaluation set.

The results were scored using v3.3.3 of

our open source evaluation software.

Time Aligned Event Scoring (TAES) was

used as a basis for ranking the submissions. In order to stimulate interest in the use oflow cost commercial sensors, penalties were further imposed based on the number of channels.To emphasize the importance of a low false alarm rate, a single integrated metric was used that penalized false alarms and the number of channels:

where

Sens, FA

and NC are sensitivity, false alarms per 24 hours and the number of channels respectively.This metric was designed with an expectation that Sens would be in the range of 40%, FAs in the range of 10, and so that NC would be a tiebreaker.


The Neureka™ 2020 Epilepsy Challenge

DescriptionTrainDev

Patients

592

50

Sessions

1,185

238

Files

4,599

1,013

No. Events

2,377

673

Event Dur. (sec.)

169,794

58,445

Total Dur (sec.)

2,710,483

613,232

Slide4

The scoring metrics used for evaluating a system should reflect the performance requirements of an application (e.g., word error rate in speech recognition is highly correlated with the usability of a voice interface).

Clinicians are overwhelmingly emphatic that false alarm rate is the most important criterion for user acceptance.

Clinicians argue that performance goals for seizure detection are 75% sensitivity and 1 false alarm per 24 hours for a system to be usable.

We have introduced open source sequential decoding software that integrates five metrics for measuring similarity and produces a wide variety of popular statistics for evaluating system performance:

https://www.isip.piconepress.com/publications/unpublished/

book_sections

/2021/springer/metrics/This software has been used internally for many years and one external evaluation conducted by IBM Research.The Python implementation of the scoring software can be found at:https://www.isip.piconepress.com/projects/tuh_eeg/downloads/nedc_eval_eeg

Using the Neureka Challenge data, we have analyzed several of the leading systems and validate the accuracy of our Time-Aligned Event Scoring (TAES) metric, showing it correlates with other measure including DET curves.

Open Source Scoring Software

Slide5

There are 4 fundamental quantities that must be calculated to derive most performance measures:

True Positive (TP)

False Positive (FP)

False Negative (FN)

True Negative (TN)

From these we calculate traditional measures such as:

Sensitivity = TP / (TP + FN) Accuracy = (TP+TN)/(TP+FN+TN+FP) Specificity = TN / (TN + FP) Precision = TP/(TP + FN) There are many ways to compute quantities such as TP and FP. In our scoring software, we introduce four ways to measure errors.

Fundamental Scores and Derived Measures

Slide6

Evaluation Metrics – Dynamic Programming Align. (DPAL)

Popularized in the speech recognition community when time alignments were not available. Computed error rates correlate well with time-aligned results.

Minimizes an edit distance (the Levenshtein distance) to map the hypotheses onto the reference:

Three types of errors are recorded: substitution, deletion and insertion.

A dynamic programming algorithm is used to find the optimal alignment. Weights can be applied to different error classes (we use equal weights).

A fast, simple algorithm with few tunable parameters that can be easily applied to system output.

Alignments do not necessarily reflect the errors that actually occurred, though the aggregated results display the correct trends.

Slide7

Evaluation Metrics – Epoch-based Sampling (EPCH)

Uses a metric that treats the reference and hypothesis as signals sampled at a fixed frame rate (an epoch):

The epoch duration used for scoring EEG events is 1.0 second.

Fixed-size epochs avoid the problem of disambiguating overlap between reference and hypothesis events (a ‘many to many’ mapping).

Tends to bias scores by weighting longer events more heavily and tends to produce a higher value of specificity.

Since seizure events can be very long, this is a concern.

Also, since each epoch is scored independently, false alarms are very high because each event can generate more than one false alarm.

Slide8

Evaluation Metrics – Any-Overlap (OVLP)

If a hypothesis event

overlaps within the

proximity of the

reference event, it is

considered a hit.

No penalty when

multiple reference

events overlap with

a single large hypothesis event.Misses and false alarms are counted when no overlap between hypothesis and reference is found.Short and long events are weighed equally.

A very permissive metric that scores a match as correct even though the accuracy of the time alignment might be very poor.

Widely used in the neuroengineering community because it tends to produce a high sensitivity. Used in FDA submissions which has created an overly optimistic view of the accuracy of state of the art systems.

Slide9

Evaluation Metrics – Time-aligned Event Scoring (TAES)

Similar to EPCH, TAES scores events based on their time-alignments.

A seizure can vary in duration from a few seconds to hours depending on its type and severity. TAES attempts to balance errors on short duration events with errors on long duration events.

The amount of

overlap is tabulated

for each error.

Each event is

weighed equally bynormalizing the scoreto a range of [0.0,1.0].Multiple hypotheses

that map to the samereference event areaccumulated intoa single score.Multiple reference events that map to the same hypothesis event add FP errors for all but the first event.

Slide10

System Performance – Neureka Leaderboard

Submissions were scored using the TAES metric and a weighted measure that combines sensitivity, false alarms and the number of channels:


sia

pnc98

yff

1zk

Slide11

All sites were invited to submit detailed results. Only four external sites participated: Lan Wei (1zk),

NeuroSyd

(pnc98), EEG miners (yff) and Biomed Irregulars (sia).

We also included an internallydeveloped system (nedc).Some sites could not producedetailed hypothesis files necessary for analysis 

Comparisons using multiple

evaluation metrics gives greater insight into a

system’s behavior.nedc and 1zk are balancedand have the highest sensitivities but higher FA rates.pnc98 was biased to have alow FA rate. It is conservativein how it assigns an onset.Analysis of Several Selected Neureka Contributions (dev)

System

nedc

1zkpnc98yff

D

P

ALSens37.2327.646.98

20.51

Spec

96.88

85.27

98.33

91.98

FAs

5.63

29.16

2.54

14.09

E

P

C

H

Sens

36.28

13.78

1.56

31.18

Spec

97.30

97.89

99.99

94.06

FAs

2,101

1,647

8

4,644

O

V

L

P

Sens

40.29

23.92

6.39

26.15

Spec

97.56

90.29

99.65

94.19

FAs

5.77

25.36

0.85

14.23

T

A

ESSens32.6014.362.0414.03Spec90.7283.5399.4287.44FAs17.0331.320.8721.42

Slide12

1zk performs well on isolated events because FA rates for all metrics are comparable. The difference between OVLP and TAES sensitivities suggest that while parts of an event are identified correctly, the alignments are off.

pnc98 is conservative in detecting

boundaries and only correctly

identifies the center regionof an event.yff detects regions which extendbeyond the boundaries of an

event. This is inferred by

comparing OVLP FA rates with TAES and EPCH FA rates.

nedc tends to generate a singlelong hypothesis that maps tomultiple reference events, whichcan be seen by difference in FA rates for OVLP and TAES.Overall performance was better onthe eval set than the dev sets which suggests the eval set is relatively easier.Analysis of Several Selected Neureka Contributions (dev)

System

nedc

1zkpnc98yff

D

P

ALSens37.2327.646.98

20.51

Spec

96.88

85.27

98.33

91.98

FAs

5.63

29.16

2.54

14.09

E

P

C

H

Sens

36.28

13.78

1.56

31.18

Spec

97.30

97.89

99.99

94.06

FAs

2,101

1,647

8

4,644

O

V

L

P

Sens

40.29

23.92

6.39

26.15

Spec

97.56

90.29

99.65

94.19

FAs

5.77

25.36

0.85

14.23

T

A

ESSens32.6014.362.0414.03Spec90.7283.5399.4287.44FAs17.0331.320.8721.42

Slide13

DET Analysis: nedc vs. sia (eval)

Scores

sia

nedcA

T

W

VSens22.7041.08Spec

99.02

93.20

FAs1.6113.36D

P

A

LSens23.4542.96Spec

99.47

94.39

FAs

0.96

11.77

E

P

C

H

Sens

12.84

51.58

Spec

99.97

98.38

FAs

25

1,301

O

V

L

P

Sens

23.26

42.96

Spec

99.74

95.54

FAs

0.64

11.45

T

A

E

S

Sens

11.37

35.55

Spec

99.46

91.80

FAs

0.99

17.23

Many sites could not provide data

suitable for DET curve analysis because their systems did not output a ‘confidence’:

sia has a low FA rate at the expense of sensitivity.

nedc has a higher sensitivity and a higher FA rate.

In cases like this, performance must be compared using a DET curve:

Slide14

Statistical Analysis: nedc vs. sia

Hypothesis event durations for nedc and sia are significantly different.

A distribution of event durations for both systems are shown to the right.

The sia system detects seizures which are mostly in the range of 15-40 seconds in duration.The nedc system detects seizures for durations as low as 4 seconds.

The sia system is very careful with overdetection and performs well with mid-duration seizure events.

The nedc system provides more balanced performance across metrics whereas the sia system performs better where time-alignment and partial overlaps are important.

System: siaSystem: nedc

Slide15


DPAL

EPCH

OVLPTAESDPAL1.00

0.4029

(p=0.121)

0.9535(p<0.001)0.5746(p=0.019)EPCH—

1.00

0.6141

(p=0.011)0.9144(p<0.001)OVLP

1.000.7641(p<0.001)TAES——

1.00


DPAL

EPCH

OVLP

TAES

DPAL

1.00

0.6676

(p=0.004)

0.9985

(p<0.001)

0.9980

(p<0.001)

EPCH

1.00

0.6777

(p=0.003)

0.6948

(p=0.002)

OVLP

1.00

0.9971

(p<0.001)

TAES

1.00

Statistical Analysis

Pairwise Pearson’s correlation coefficient was calculated for all four metrics for all 16 submissions.

OVLP and DPAL are highly correlated.

DPAL and EPCH show very low correlation in terms of both sensitivity and specificity.

EPCH and TAES show higher correlation in terms of sensitivity but EPCH fails to correlate well with the other metrics.

TAES combines salient features of the other metrics and provides a more accurate view of overall performance.

Slide16

Summary

Seizure events can vary significantly in duration. Each event should be weighed equally regardless of its duration to avoid bias.

Traditional metrics, such as OVLP, are too lenient when it comes to assessing the time alignment of a hypothesis.

TAES, by scoring partial overlaps and weighing seizure events equally, was designed to evaluate systems where time-alignments are crucial and ‘many-to-many’ mappings between reference and hypothesis events are required.

Analyzing systems using multiple scoring metrics can provide insight into a system’s behavior without the need for extensive manual error analysis.

Standardization of scoring software in the research community is an important step towards accelerating progress and establishing statistically significant advances.Many modern machine learning algorithms, when properly evaluated, are marginally different on difficult tasks such as seizure prediction. Real world challenges such as artifacts and event segmentation dominate system performance.

Neureka™ 2020 Epilepsy Challenge demonstrated that the TAES metric is a viable alternative to traditional scoring metrics.

Slide17

Acknowledgments

The Neureka 2020 Epilepsy Challenge was made by possible by a generous grant from Novela Neurotech (

https://

www.novelaneuro.com

).

The research reported in this publication by the Neural Engineering Data Consortium was most recently supported by the National Science Foundation Partnership for Innovation award number IIP-1827565 and the Pennsylvania Commonwealth Universal Research Enhancement Program (PA CURE). Any opinions, findings, and conclusions or recommendations expressed in this material are those of the author(s) and do not necessarily reflect the official views of any of these organizations.

Slide18

References

The Neureka Challenge:

Y. Roy, R. Iskander, and J. Picone, “The Neureka® 2020 Epilepsy Challenge,”

NeuroTechX, 2020. [Online]. Available: https://

neureka-challenge.com/

. [Accessed: 01-Jul-2020].V. Shah

et al., “The Temple University Hospital Seizure Detection Corpus,” Front. Neuroinform., vol. 12, pp. 1–6, 2018.I. Obeid and J. Picone, “Machine Learning Approaches to Automatic Interpretation of EEGs,” in Biomedical Signal Processing in Big Data, 1st ed., E. Sejdik and T. Falk, Eds. Boca Raton, Florida, USA: CRC Press, 2017 (in press).V. Shah, M. Golmohammadi, I. Obeid, and J. Picone, “Objective Evaluation Metrics for Automatic Classification of EEG Events,” in Signal Processing in Medicine and Biology: Emerging Trends in Research and Applications, 1st ed., I. Obeid, I. Selesnick, and J. Picone, Eds. New York City, New York, USA: Springer, 2021, pp. 1–26.V. Shah and J. Picone, “NEDC Eval EEG: A Comprehensive Scoring Package for Sequential Decoding of Multichannel Signals,” The TUH EEG Project Web Site

, 2019. [Online]. Available:

https://www.isip.piconepress.com/projects/tuh_eeg

/downloads/nedc_eval_eeg/. [Accessed: 01-Jul-2020].Participants:nedc: M. Golmohammadi, V. Shah, I. Obeid, and J. Picone, “Deep Learning Approaches for Automatic Seizure Detection from Scalp Electroencephalograms,” in Signal Processing in Medicine and Biology: Emerging Trends in Research and Applications, 1st ed., I. Obeid, I. Selesnick, and J. Picone, Eds. New York, New York, USA: Springer, 2020, pp. 233–274.lwei: L. Wei and C. Mooney, “An Automatic Seizure Detection Method for Clinical EEG data,” in Proceedings of the IEEE Signal Processing in Medicine and Biology Symposium (SPMB), 2020.pnc98: Y. Yang, N. D. Truong, C. Maher, A.

Nikpour, and O.

Kavehei, “Two-Channel Epileptic Seizure Detection with Blended Multi-Time Segments Electroencephalography (EEG) Spectrogram,” in

Proceedings of the IEEE Signal Processing in Medicine and Biology Symposium (SPMB), 2020.yff: T. Anand, M. G. Kumar, M. Sur, R. Aghoram, and H. Murphy, “Seizure Detection Using Time Delay Neural Networks and LSTM,” in Proceedings of the IEEE Signal Processing in Medicine and Biology Symposium (SPMB), 2020.sia: C. Chatzichristos et al., “Epileptic Seizure Detection in EEG via Fusion of Multi-View Attention-Gated U-net Deep Neural Networks,” in Proceedings of the IEEE Signal Processing in Medicine and Biology Symposium (SPMB), 2020.